Detached Duplex with Heated
For Sale
$1,699,000
31 E Tenafly Ave, Staten Island, NY 10312
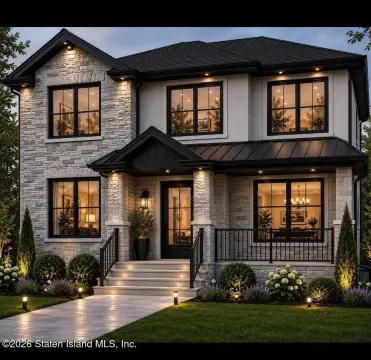
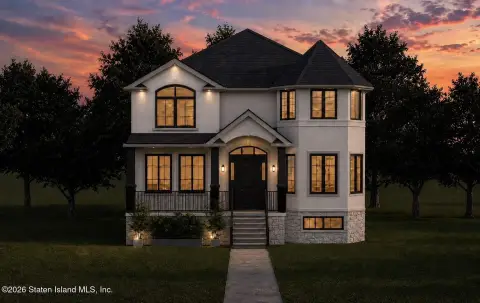
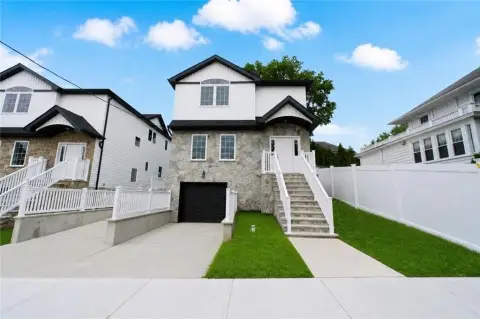
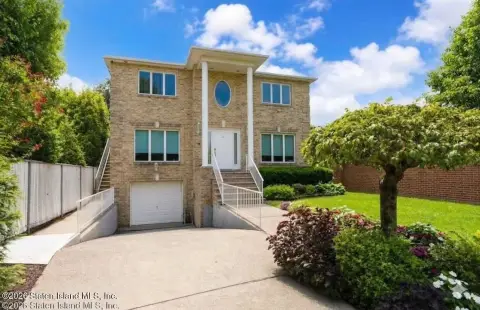
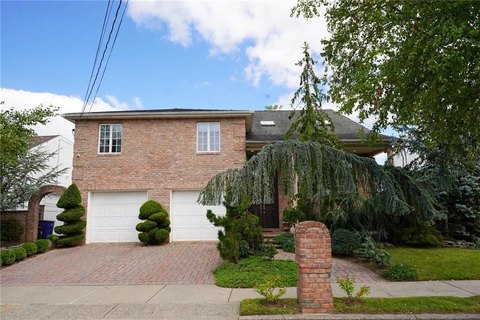
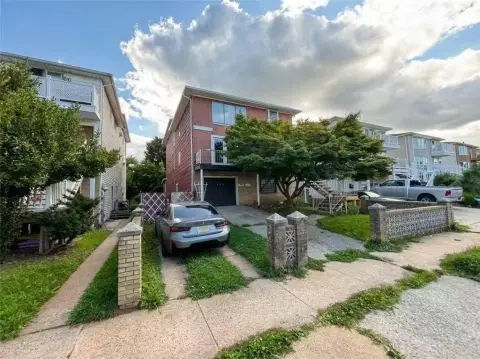
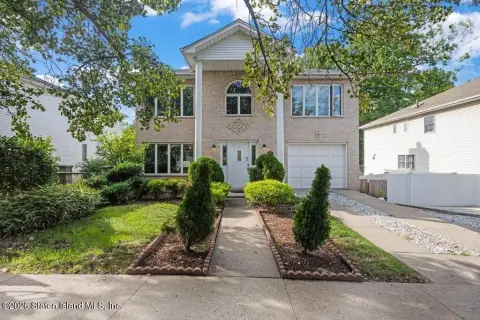
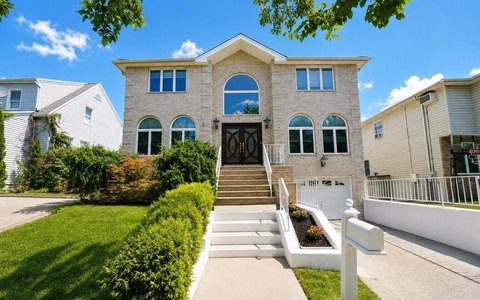
Updated two-family residence with finished lower level, private primary bath, and separate one-bedroom apartment.
Property Size3,369 SF
Days on Market61
Property Features for 31 E Tenafly Ave
General Information
Standard status
Active
Size
3,369 SF
Property subtype
Multi Family
Units
Unit Mix
1 x 3BR/4BA, 1 x 1BR
Multifamily Units
2
Additional Details
Public Transit
Yes
Taxes and HOA fees
Annual Taxes
$11,919
Amenities
pool
wood-burning fireplace
security system
solar panels
skylights
barbecue area
shed
paver backyard
hardwood floors
central air conditioning
laundry room
Building Details
Building Size
3,369 SF
Year Built
1989
Buildings
1
Stories
2
Listing Agency:
JOHN A MAGUIRE REAL ESTATE LLC
Listed By:
Steven Maguire Jr.
(718) 836-4330
Source:
Elliman
Added: Aug 23
Changed: Oct 21
Last Checked: Oct 20 at 9:18PM
Displayed information is deemed reliable but is not guaranteed and should be independently verified. All listing content including descriptions, pricing, images are the copyrighted material of JOHN A MAGUIRE REAL ESTATE LLC

Ask AI about this property
Review the available facts, identify missing information and prepare questions for the agent.
Investment Insights
Based on property information with market context.
Located at 31 E. Tenafly Avenue, this detached duplex, built in 1989, combines a spacious primary residence with a separate one-bedroom apartment. The main home includes 3 bedrooms, 4 baths, a custom eat-in kitchen with granite counters and center island, formal dining and living rooms, a family room with wood-burning fireplace, hardwood floors, and 10 ft. ceilings. The primary bedroom has its own full bath.
The finished basement adds 1800 SF with a great room, custom kitchen, full bathroom, laundry room, pantry, storage, utility room, and sliders opening to the backyard. Outdoor improvements include a heated in-ground pool, gas pool heater, gas-line Bar-B-Q, paver yard, shed, and cement driveway. Additional features include 4-Zone baseboard heat, 2-Zone central air conditioning in the main home, an 8 Camera security system, solar panel roof, skylights, and a Built-In 2-Car Garage with epoxy floor. The property is near shopping, parks, local transportation, and express buses to Manhattan.
The finished basement adds 1800 SF with a great room, custom kitchen, full bathroom, laundry room, pantry, storage, utility room, and sliders opening to the backyard. Outdoor improvements include a heated in-ground pool, gas pool heater, gas-line Bar-B-Q, paver yard, shed, and cement driveway. Additional features include 4-Zone baseboard heat, 2-Zone central air conditioning in the main home, an 8 Camera security system, solar panel roof, skylights, and a Built-In 2-Car Garage with epoxy floor. The property is near shopping, parks, local transportation, and express buses to Manhattan.
Key Highlights
- Detached 2‑Family home at 31 E. Tenafly Avenue, Staten Island, NY 10312
- Main home includes 3 bedrooms, 4 Baths, 10 ft. Ceilings, and a private primary‑bedroom bath
- Finished basement provides 1800 SF with kitchen, full bathroom, laundry, storage, and great room
Financial Insights
Estimated NOI and Cap Rate
NOI / Yr
$83,251
Cap Rate
4.90%
Suggested Prices Based on Cap Rates
Cap Rate 5%
$1,665,020
$1.7M
Cap Rate 7%
$1,189,300
$1.2M
Cap Rate 9%
$925,011
$925.0K
Market Conditions
NOI Build-Up for 3,369 SF
Gross rent
$129.4K $38.40/SF
− Vacancy
−$10.4K −$3.10/SF
EGI
$118.9K $35.30/SF
− OpEx
−$35.7K −$10.59/SF
NOI
$83.3K $24.71/SF
Area
ZIP 10312
Vacancy
8.07%
Lease Rate
$38.40 /SF/Yr
Expense Ratio
30.00%
Simulate Cap Rate and NOI
Suggested Prices Based on Cap Rates
Cap Rate 5%
$1,665,020
Cap Rate 7%
$1,189,300
Cap Rate 9%
$925,011
Alternative Uses
Best Use
Multifamily LT 5
$1.19M
$1.04M – $1.39M
NOI $83,251 @ 7.0% cap · market cap 4.90%
Second Best
Apartment 5plus
$1.05M
$915.5K – $1.22M
NOI $73,243 @ 7.0% cap · market cap 4.31%
Theoretical Best
Office A
$1.61M
$1.41M – $1.88M
NOI $112,525 @ 7.0% cap · market cap 6.62%
Zoning and permitted uses should be independently verified with authorities.
How Realmo checks its estimates
Property Analytics
Who owns this building?
See the owner, sales and loan history
Open Analytics
Lease Details
2
Residential units
Location Intelligence
Trade Area within ½ mile
403
Businesses Nearby
Explore this area
Business Placement
Demographics for 10312, NY
61,642
Population
22,547
Households
2.7
Avg Household Size
43
Median Age
41%
College-Educated
92%
High-School Grad
6.9 sq mi
ZIP Area
8,934
Density / Sq Mi
$111,434
Median Household Income
$62,700
Median Earnings
$1,911
Median Rent
$698,900
Median Home Value
Check the figures for this property
Cap Rate, Value Estimation, Potential NOI and more
View Realmo Analytics
Market
Vacancy Rate% for Multifamily in Northeast region
Frequently Asked Questions
What type of property is this?
Duplex - Updated two-family residence with finished lower level, private primary bath, and separate one-bedroom apartment.
Where is this duplex located?
The property is located at 31 E Tenafly Ave Staten Island, NY.
What is the asking price?
The asking price for this property is $1,699,000.
What are key features of this property?
This property features: Detached 2‑Family home at 31 E. Tenafly Avenue, Staten Island, NY 10312; Main home includes 3 bedrooms, 4 Baths, 10 ft. Ceilings, and a private primary‑bedroom bath; Finished basement provides 1800 SF with kitchen, full bathroom, laundry, storage, and great room


