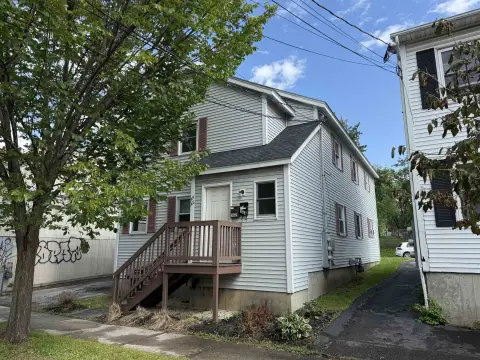
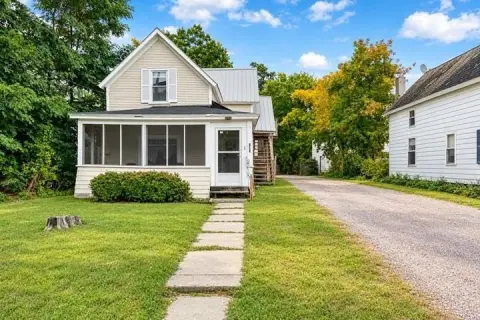
Well-Maintained Four-Unit Investment
For Sale
$849,000
31-33 Hickok Place, Burlington, VT 05401
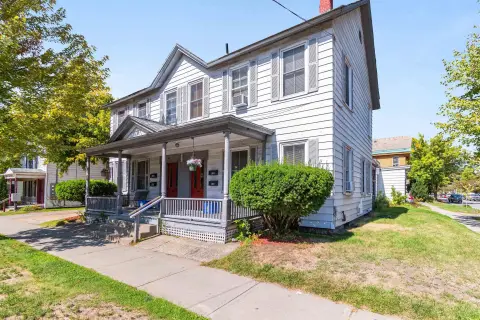
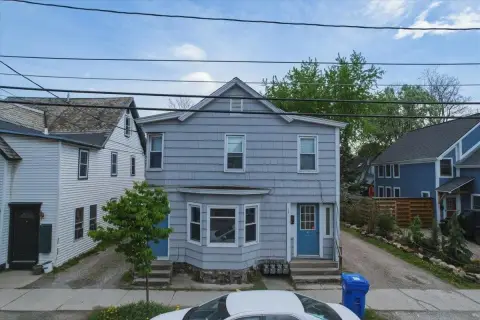
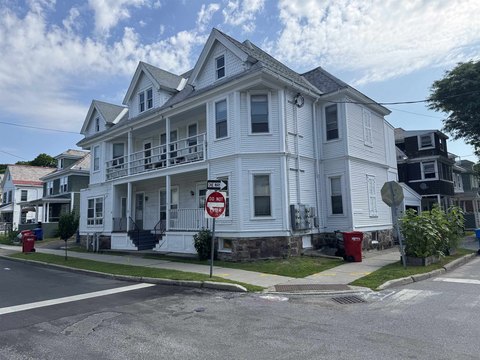
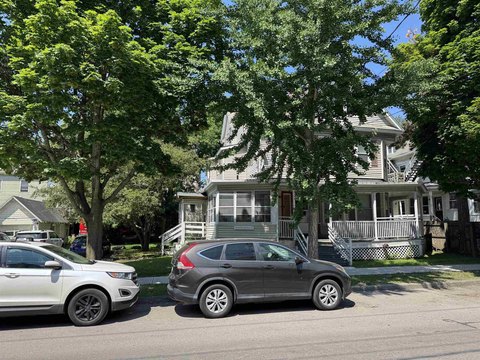
Fully leased multifamily property near UVM Campus and downtown.
Property Size4,243 SF
Price / SF$200.09
Days on Market186
Property Features for 31-33 Hickok Place
General Information
Standard status
Active
Size
4,243 SF
Property subtype
Multi-Family
Zoning
RM
Taxes and HOA fees
Annual Taxes
$15,758
Building Details
Year Built
1899
Stories
2
Listing Agency:
Coldwell Banker Hickok and Boardman
(802) 863-1500
Listed By:
Lipkin Audette Team
(802) 846-8800
Source:
Churchillprop
Added: Apr 24
Changed: Oct 25
Last Checked: Oct 24 at 3:25PM
Displayed information is deemed reliable but is not guaranteed and should be independently verified. All listing content including descriptions, pricing, images are the copyrighted material of Coldwell Banker Hickok and Boardman

Ask AI about this property
Review the available facts, identify missing information and prepare questions for the agent.
Investment Insights
Based on property information with market context.
This well-maintained four-unit investment property features three 2-bedroom apartments and one 1-bedroom unit. The turn-key multi-family property is fully leased through May 2027. Located between UVM Campus and downtown, the property is an exceptional student rental in an ideal location. The property has strong financials with separate heat and electricity paid by the tenants. It also features plenty of off-street parking, on-site coin-op laundry, and large rear decks. There is an expansion opportunity into an amazing attic space, providing a rare opportunity for added value and reconfiguration. This is a strong opportunity for investors seeking consistent above-market income with the potential to add value in an unparalleled student rental location. The bike score is 51, making it bikeable. The walk score is 29, indicating car dependence, and the transit score is 31, suggesting some transit options.
Key Highlights
- Fully leased through May 2027, providing immediate and consistent income.
- Prime location between UVM Campus and downtown, ideal for student rentals.
- Strong financials with tenants paying separate heat and electricity.
Financial Insights
Estimated NOI and Cap Rate
NOI / Yr
$46,862
Cap Rate
5.52%
Suggested Prices Based on Cap Rates
Cap Rate 5%
$937,240
$937.2K
Cap Rate 7%
$669,457
$669.5K
Cap Rate 9%
$520,689
$520.7K
Market Conditions
NOI Build-Up for 4,243 SF
Gross rent
$67.7K $15.96/SF
− Vacancy
−$772 −$0.18/SF
EGI
$66.9K $15.78/SF
− OpEx
−$20.1K −$4.73/SF
NOI
$46.9K $11.04/SF
Area
Chittenden County, VT
Vacancy
1.14%
Lease Rate
$15.96 /SF/Yr
Expense Ratio
30.00%
Simulate Cap Rate and NOI
Suggested Prices Based on Cap Rates
Cap Rate 5%
$937,240
Cap Rate 7%
$669,457
Cap Rate 9%
$520,689
Alternative Uses
Best Use
Multifamily LT 5
$669.5K
$585.8K – $781.0K
NOI $46,862 @ 7.0% cap · market cap 5.52%
Second Best
Apartment 5plus
$592.9K
$518.8K – $691.7K
NOI $41,502 @ 7.0% cap · market cap 4.89%
Theoretical Best
Office A
$1.16M
$1.02M – $1.36M
NOI $81,466 @ 7.0% cap · market cap 9.60%
Zoning and permitted uses should be independently verified with authorities.
How Realmo checks its estimates
Property Analytics
Unlock full access to Insights
Subscribe to Realmo Intelligence
Open Analytics
Location Intelligence
Trade Area within ½ mile
4,024
Businesses Nearby
Explore this area
Business Placement
Demographics for 05401, VT
32,059
Population
13,898
Households
2.3
Avg Household Size
28
Median Age
63%
College-Educated
95%
High-School Grad
6.1 sq mi
ZIP Area
5,256
Density / Sq Mi
$60,532
Median Household Income
$23,422
Median Earnings
$1,614
Median Rent
$463,300
Median Home Value
Check the figures for this property
Cap Rate, Value Estimation, Potential NOI and more
View Realmo Analytics
Market
Vacancy Rate% for Multifamily in Northeast region






Frequently Asked Questions
What type of property is this?
Quadplex - Fully leased multifamily property near UVM Campus and downtown.
Where is this quadplex located?
The property is located at 31-33 Hickok Place Burlington, VT.
What is the asking price?
The asking price for this property is $849,000.
What are key features of this property?
This property features: Fully leased through May 2027, providing immediate and consistent income.; Prime location between UVM Campus and downtown, ideal for student rentals.; Strong financials with tenants paying separate heat and electricity.


