Two-Unit Duplex with Mountain
For Sale
$180,000
31-33 Gorham Bridge Rd, Proctor, VT 05765
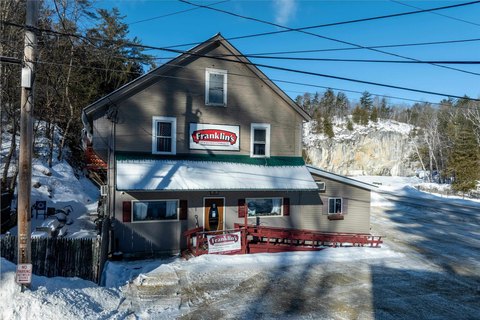
Distinct living spaces support owner occupancy, investment use, or additional household space under one roof.
Property Size1,809 SF
Lot Size0.36 Acres
Price / SF$99.50
Days on Market52
Property Features for 31-33 Gorham Bridge Rd
General Information
Standard status
Active
Size
1,809 SF
Lot size
0.36 Acres
Property subtype
Multi-Family
Property Condition
Severity
Repairs Needed
Evidence
some TLC
Units
Unit Mix
1 x 4BR/2BA, 1 x 1BR/1BA
Multifamily Units
2
Additional Details
Utilities to Site
Yes
Building Details
Year Built
1880
Buildings
1
Listing Agency:
Flex Realty
Listed By:
Chris Williams chris@flexrealtyvt.com
Source:
Nhlakesandmountainshomesearch
Added: Aug 25
Changed: Oct 3
Last Checked: Oct 14 at 11:07PM
Displayed information is deemed reliable but is not guaranteed and should be independently verified. All listing content including descriptions, pricing, images are the copyrighted material of Flex Realty
Investment Insights
Based on property information with market context.
This two-unit duplex contains approximately 1,809 finished square feet, with a 4-bedroom, 2-bath unit alongside a 1-bedroom, 1-bath unit. The property includes a full basement, enclosed front porch, slate roof, wall air conditioning units, and oil-fired forced-air heat. Public water and sewer serve the building, which conveys in As-Is condition.
Set on 0.36 acres in Proctor, the property has a landscaped yard, mountain views, and a residential setting. Local destinations include Beaver Pond, the Carriage Trails, hiking areas, Proctor Pool, the town ice and roller skating rink, the Vermont Marble Museum, Marble Bridge, Wilson Castle, parks, schools, and the Proctor Free Library. Rutland provides additional shopping, dining, entertainment, and services, while the surrounding region offers skiing, golf, and other Green Mountain recreation.
Set on 0.36 acres in Proctor, the property has a landscaped yard, mountain views, and a residential setting. Local destinations include Beaver Pond, the Carriage Trails, hiking areas, Proctor Pool, the town ice and roller skating rink, the Vermont Marble Museum, Marble Bridge, Wilson Castle, parks, schools, and the Proctor Free Library. Rutland provides additional shopping, dining, entertainment, and services, while the surrounding region offers skiing, golf, and other Green Mountain recreation.
Key Highlights
- Two‑unit layout with a 4‑bedroom, 2‑bath unit and a 1‑bedroom, 1‑bath unit
- Approximately 1,809 finished square feet on 0.36 acres
- Slate roof, full basement, enclosed front porch, and wall air conditioning units
Financial Insights
Estimated NOI and Cap Rate
NOI / Yr
$15,796
Cap Rate
8.78%
Suggested Prices Based on Cap Rates
Cap Rate 5%
$315,920
$315.9K
Cap Rate 7%
$225,657
$225.7K
Cap Rate 9%
$175,511
$175.5K
Market Conditions
NOI Build-Up for 1,809 SF
Gross rent
$29.3K $16.20/SF
− Vacancy
−$586 −$0.32/SF
EGI
$28.7K $15.88/SF
− OpEx
−$12.9K −$7.14/SF
NOI
$15.8K $8.73/SF
Area
Rutland County, VT
Vacancy
2.00%
Lease Rate
$16.20 /SF/Yr
Expense Ratio
45.00%
Simulate Cap Rate and NOI
Suggested Prices Based on Cap Rates
Cap Rate 5%
$315,920
Cap Rate 7%
$225,657
Cap Rate 9%
$175,511
Alternative Uses
Best Use
Multifamily LT 5
$244.9K
$214.3K – $285.7K
NOI $17,143 @ 7.0% cap · market cap 9.52%
Second Best
Apartment 5plus
$225.7K
$197.5K – $263.3K
NOI $15,796 @ 7.0% cap · market cap 8.78%
Theoretical Best
Healthcare Medical
$315.0K
$275.6K – $367.5K
NOI $22,048 @ 7.0% cap · market cap 12.25%
Zoning and permitted uses should be independently verified with authorities.
How Realmo checks its estimates
Property Analytics
Unlock full access to Insights
Subscribe to Realmo Intelligence
Open Analytics
Current Use
Lease Details
2
Residential units
Yes
Utilities to site
Location Intelligence
Trade Area within ½ mile
40
Businesses Nearby
Explore this area
Business Placement
Demographics for 05765, VT
1,722
Population
761
Households
2.3
Avg Household Size
44
Median Age
28%
College-Educated
97%
High-School Grad
7.2 sq mi
ZIP Area
239
Density / Sq Mi
$65,000
Median Household Income
$42,115
Median Earnings
$997
Median Rent
$199,300
Median Home Value
Check the figures for this property
Cap Rate, Value Estimation, Potential NOI and more
View Realmo Analytics
Market
Vacancy Rate% for Multifamily in Northeast region

Questions? Ask Rey
Realmo’s AI knows this listing — price, zoning, demand, history. Ask anything.

Frequently Asked Questions
What type of property is this?
Duplex - Distinct living spaces support owner occupancy, investment use, or additional household space under one roof.
Where is this duplex located?
The property is located at 31-33 Gorham Bridge Rd Proctor, VT.
What is the asking price?
The asking price for this property is $180,000.
What are key features of this property?
This property features: Two‑unit layout with a 4‑bedroom, 2‑bath unit and a 1‑bedroom, 1‑bath unit; Approximately 1,809 finished square feet on 0.36 acres; Slate roof, full basement, enclosed front porch, and wall air conditioning units


