Storefront Property with Appliance
For Sale
$249,000
308 Santini St, Biloxi, MS 39530
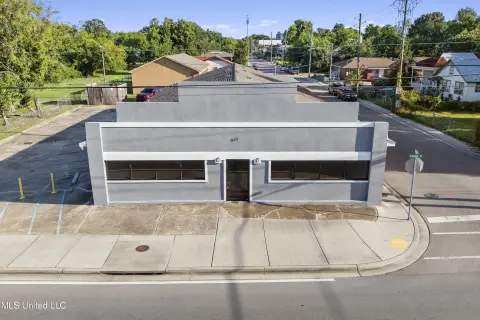
Operating appliance repair and parts business with building improvements and a newly paved parking area.
Property Size1,288 SF
Price / SF$193.32
Days on Market87
Property Features for 308 Santini St
General Information
Standard status
Active
Size
1,288 SF
Additional Details
Business Included
Yes
Building Details
Year Built
1930
Listing Agency:
Fidelis Realty, LLC.
Listed By:
Sandra French Rushing · License #B24422
(228) 234-6971
Source:
Fiorellaavenue
Added: Jul 21
Changed: Sep 15
Last Checked: Oct 7 at 5:16PM
Displayed information is deemed reliable but is not guaranteed and should be independently verified. All listing content including descriptions, pricing, images are the copyrighted material of Fidelis Realty, LLC.
Investment Insights
Based on property information with market context.
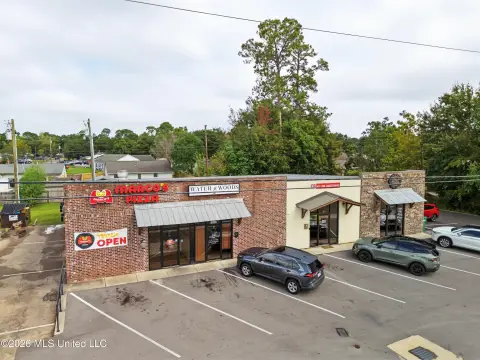
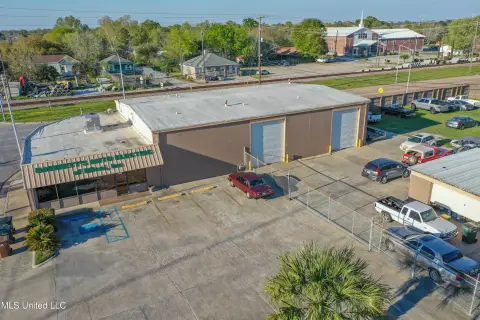
This storefront property includes an established appliance repair and parts business that has served the community since 2009. The 1,288-square-foot building was constructed in 1930 and has been partially remodeled, with a new roof and freshly paved parking lot. The property and business are offered together in as-is condition.
Located at 308 Santini St in Biloxi, the property is near Beau Rivage, Keesler Air Force Base, the city’s entertainment district, and major shopping centers. Showings are available by appointment during business hours.
Located at 308 Santini St in Biloxi, the property is near Beau Rivage, Keesler Air Force Base, the city’s entertainment district, and major shopping centers. Showings are available by appointment during business hours.
Key Highlights
- Established appliance repair and parts business serving the community since 2009
- 1,288‑square‑foot storefront property at 308 Santini St
- Partially remodeled building with a new roof
Financial Insights
Estimated NOI and Cap Rate
NOI / Yr
$11,582
Cap Rate
4.65%
Suggested Prices Based on Cap Rates
Cap Rate 5%
$231,640
$231.6K
Cap Rate 7%
$165,457
$165.5K
Cap Rate 9%
$128,689
$128.7K
Market Conditions
NOI Build-Up for 1,288 SF
Gross rent
$18.1K $14.04/SF
− Vacancy
−$1.5K −$1.19/SF
EGI
$16.5K $12.85/SF
− OpEx
−$5.0K −$3.85/SF
NOI
$11.6K $8.99/SF
Area
Harrison County, MS
Vacancy
8.50%
Lease Rate
$14.04 /SF/Yr
Expense Ratio
30.00%
Simulate Cap Rate and NOI
Suggested Prices Based on Cap Rates
Cap Rate 5%
$231,640
Cap Rate 7%
$165,457
Cap Rate 9%
$128,689
Alternative Uses
Best Use
Retail
$165.5K
$144.8K – $193.0K
NOI $11,582 @ 7.0% cap · market cap 4.65%
Second Best
—
—
no second resolved use
Theoretical Best
Healthcare Medical
$207.5K
$181.6K – $242.1K
NOI $14,525 @ 7.0% cap · market cap 5.83%
Zoning and permitted uses should be independently verified with authorities.
How Realmo checks its estimates
Property Analytics
Unlock full access to Insights
Subscribe to Realmo Intelligence
Open Analytics
Current Use
Lease Details
Turnkey business
Opportunity
Location Intelligence
Trade Area within ½ mile
785
Businesses Nearby
Balanced
Demand for This Use
Explore this area
Business Placement
Demographics for 39530, MS
8,392
Population
4,533
Households
1.9
Avg Household Size
41
Median Age
18%
College-Educated
82%
High-School Grad
4.5 sq mi
ZIP Area
1,865
Density / Sq Mi
$39,755
Median Household Income
$26,222
Median Earnings
$821
Median Rent
$149,600
Median Home Value
Check the figures for this property
Cap Rate, Value Estimation, Potential NOI and more
View Realmo Analytics
Market
Vacancy Rate% for Retail in South region

Questions? Ask Rey
Realmo’s AI knows this listing — price, zoning, demand, history. Ask anything.




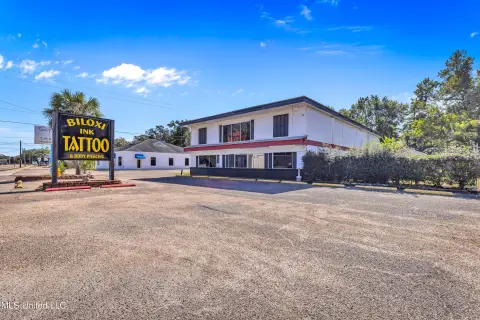
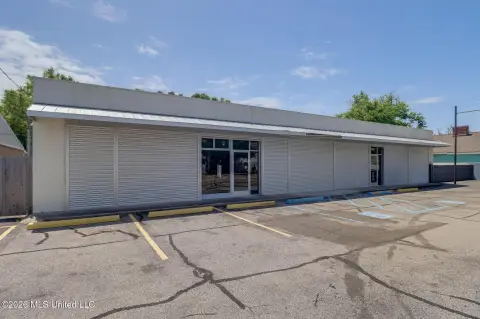
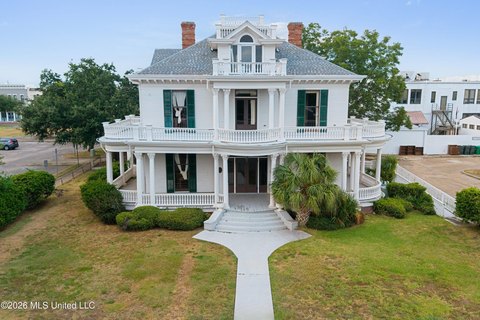
Similar Off Market Nearby
- Kay's Flowers — 713 Howard Ave, Biloxi, MS 39530
- Flower Basket Florist — 999 Howard Ave, Biloxi, MS 39530
Frequently Asked Questions
What type of property is this?
Storefront property - Operating appliance repair and parts business with building improvements and a newly paved parking area.
Where is this storefront property located?
The property is located at 308 Santini St Biloxi, MS.
What is the asking price?
The asking price for this property is $249,000.
What are key features of this property?
This property features: Established appliance repair and parts business serving the community since 2009; 1,288‑square‑foot storefront property at 308 Santini St; Partially remodeled building with a new roof


