Historic 3-Unit Income
For Sale
Contact for pricing
308 HIGH ST, Oregon City, OR 97045
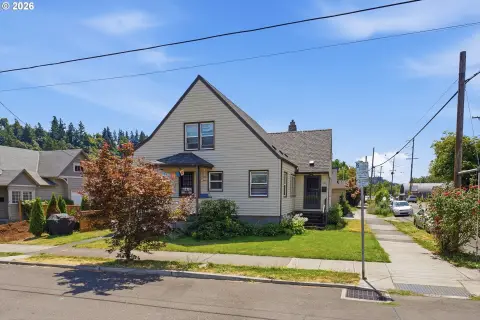
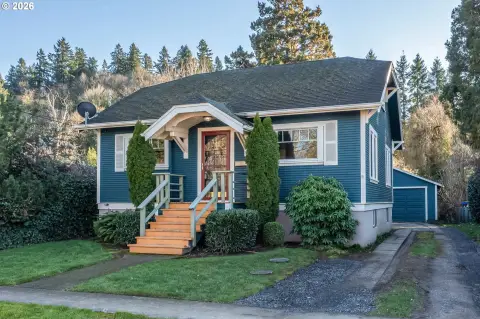
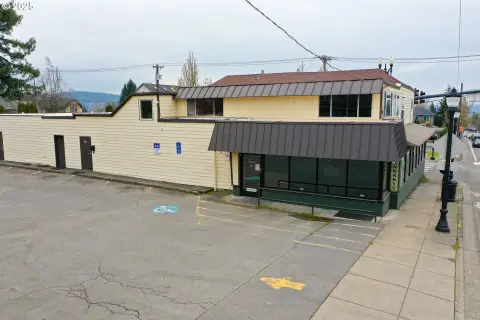
Three-unit property across from a park with recent exterior and interior improvements for rental-ready occupancy.
Property Size3,174 SF
Price / SF$189
Days on Market146
Property Features for 308 HIGH ST
General Information
Standard status
Active
Size
3,174 SF
Class
B
Property subtype
Multifamily
Zoning
R3.5
Occupancy
100%
Investment Type
Stabilized
Net Operating Income
$37,814
Additional Details
Multifamily Units
3
Building Details
Year Built
1905
Year Renovated
2016
Buildings
1
Stories
2
Units
3
Tenancy
Multi
Listing Agency:
Keller Williams Realty Portland Premiere
Listed By:
Darryl Bodle · License #199910100
(503) 709-4632
Source:
Crexi
Added: May 31
Changed: Oct 10
Last Checked: Oct 20 at 6:59PM
Displayed information is deemed reliable but is not guaranteed and should be independently verified. All listing content including descriptions, pricing, images are the copyrighted material of Keller Williams Realty Portland Premiere

Ask AI about this property
Review the available facts, identify missing information and prepare questions for the agent.
Investment Insights
Based on property information with market context.
Built in 1905, this three-unit multifamily property is configured with one unit on each level. The offering includes multiple interior updates across the units, including updated kitchen cabinets and appliances, lighting fixtures, bathroom updates, heating updates, and plumbing repairs as needed, along with fresh paint and attic finish work. The basement utility area has also seen improvements, including updated electrical panels, furnaces, and water heaters. Exterior work completed in 2025 includes roof, siding, and gutter replacement, kitchen porch and porch roof replacement, dormer window repairs, select window replacement, porch rail repairs, and fencing repairs.
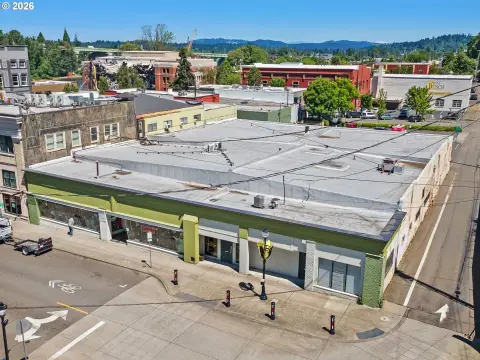
The property is located at 308 High St in Oregon City, positioned across from Promenade Park. The setting provides views toward historic downtown Oregon City and Willamette Falls. The area offers walkable access to downtown Oregon City and Main Street shops, coffee, restaurants, pubs, river viewpoints, and Willamette Falls views, as well as nearby outdoor spaces including Clackamette Park and Canemah, plus access to Providence Willamette Falls Medical Center, Clackamas Community College, and commuter routes. Street parking is available.
For buyers seeking an income-oriented residential property, the current configuration and recent renovations support a straightforward rental layout with demonstrated attention to core systems and building envelope. Buyer to verify unit configuration, rents, expenses, square footage, zoning, legal use, and future potential.
The property is located at 308 High St in Oregon City, positioned across from Promenade Park. The setting provides views toward historic downtown Oregon City and Willamette Falls. The area offers walkable access to downtown Oregon City and Main Street shops, coffee, restaurants, pubs, river viewpoints, and Willamette Falls views, as well as nearby outdoor spaces including Clackamette Park and Canemah, plus access to Providence Willamette Falls Medical Center, Clackamas Community College, and commuter routes. Street parking is available.
For buyers seeking an income-oriented residential property, the current configuration and recent renovations support a straightforward rental layout with demonstrated attention to core systems and building envelope. Buyer to verify unit configuration, rents, expenses, square footage, zoning, legal use, and future potential.
Key Highlights
- Three‑unit multifamily built in 1905, configured with one unit on each level
- Exterior improvements in 2025: roof, siding, gutters, kitchen porch and porch roof, dormer repairs, select windows, porch rail and fencing repairs
- Interior updates include kitchen cabinet and appliance updates, lighting fixtures, bathroom updates, fresh paint, and heating and plumbing repairs as needed
Financial Insights
Estimated NOI and Cap Rate
NOI / Yr
$40,754
Cap Rate
6.79%
Suggested Prices Based on Cap Rates
Cap Rate 5%
$815,080
$815.1K
Cap Rate 7%
$582,200
$582.2K
Cap Rate 9%
$452,822
$452.8K
Market Conditions
NOI Build-Up for 3,174 SF
Gross rent
$78.1K $24.60/SF
− Vacancy
−$4.0K −$1.25/SF
EGI
$74.1K $23.35/SF
− OpEx
−$33.3K −$10.51/SF
NOI
$40.8K $12.84/SF
Area
Clackamas County, OR
Vacancy
5.10%
Lease Rate
$24.60 /SF/Yr
Expense Ratio
45.00%
Simulate Cap Rate and NOI
Suggested Prices Based on Cap Rates
Cap Rate 5%
$815,080
Cap Rate 7%
$582,200
Cap Rate 9%
$452,822
Alternative Uses
Best Use
Apartment 5plus
$582.2K
$509.4K – $679.2K
NOI $40,754 @ 7.0% cap · market cap 6.79%
Second Best
Multifamily LT 5
$569.6K
$498.4K – $664.5K
NOI $39,869 @ 7.0% cap · market cap 6.65%
Theoretical Best
Office A
$856.7K
$749.7K – $999.5K
NOI $59,972 @ 7.0% cap · market cap 10.00%
Zoning and permitted uses should be independently verified with authorities.
How Realmo checks its estimates
Property Analytics
Unlock full access to Insights
Subscribe to Realmo Intelligence
Open Analytics
Lease Details
3
Residential units
Location Intelligence
Trade Area within ½ mile
1,176
Businesses Nearby
Explore this area
Business Placement
Demographics for 97045, OR
57,403
Population
21,702
Households
2.6
Avg Household Size
41
Median Age
33%
College-Educated
95%
High-School Grad
86.8 sq mi
ZIP Area
661
Density / Sq Mi
$100,388
Median Household Income
$49,342
Median Earnings
$1,600
Median Rent
$563,600
Median Home Value
Check the figures for this property
Cap Rate, Value Estimation, Potential NOI and more
View Realmo Analytics
Market
Vacancy Rate% for Multifamily in West region





Frequently Asked Questions
What type of property is this?
Triplex - Three-unit property across from a park with recent exterior and interior improvements for rental-ready occupancy.
Where is this triplex located?
The property is located at 308 HIGH ST Oregon City, OR.
What is the asking price?
The asking price for this property is $599,900.
What are key features of this property?
This property features: Three‑unit multifamily built in 1905, configured with one unit on each level; Exterior improvements in 2025: roof, siding, gutters, kitchen porch and porch roof, dormer repairs, select windows, porch rail and fencing repairs; Interior updates include kitchen cabinet and appliance updates, lighting fixtures, bathroom updates, fresh paint, and heating and plumbing repairs as needed


