Medical Center with Treatment
For Sale
Contact for pricing
305 River Drive, La Follette, TN 37766
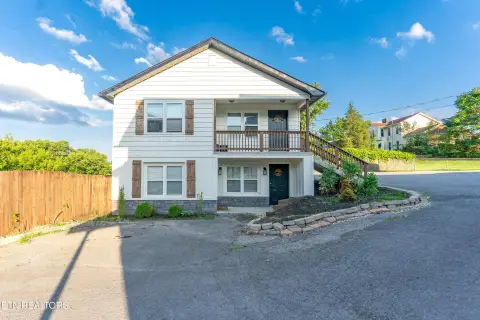
Freestanding healthcare facility with specialized plumbing, multiple exam rooms, secure reception, and dedicated storage areas.
Property Size5,688 SF
Price / SF$175.81
Days on Market79
Property Features for 305 River Drive
General Information
Standard status
Active
Size
5,688 SF
Class
A
Property subtype
Retail, Office
Building Details
Year Built
2007
Listing Agency:
Cushman & Wakefield - Nashville, Tennessee
Listed By:
Phil Fletcher · License #373909
Source:
Crexi
Added: Jul 28
Changed: Oct 10
Last Checked: Oct 12 at 8:39PM
Displayed information is deemed reliable but is not guaranteed and should be independently verified. All listing content including descriptions, pricing, images are the copyrighted material of Cushman & Wakefield - Nashville, Tennessee
Investment Insights
Based on property information with market context.
Freestanding medical center at 305 River Drive in LaFollette, Tennessee, completed in 2007. The 5,688-square-foot facility includes a treatment bay measuring approximately 70' × 29', four exam rooms, four restrooms, a lobby, waiting area, and several storage rooms. Integrated sinks support the treatment area, while dialysis-grade water and plumbing infrastructure are installed throughout the facility.
The building also features a secured reception area with a check-in window and dedicated hazardous materials storage. Set on 0.57 acres, the property provides 25 parking spaces and offers a purpose-built configuration for healthcare operations.
The building also features a secured reception area with a check-in window and dedicated hazardous materials storage. Set on 0.57 acres, the property provides 25 parking spaces and offers a purpose-built configuration for healthcare operations.
Key Highlights
- 5,688‑square‑foot medical center completed in 2007
- Treatment bay measures approximately 70' × 29' with integrated sinks
- Dialysis‑grade water and plumbing infrastructure
Financial Insights
Estimated NOI and Cap Rate
NOI / Yr
$75,252
Cap Rate
7.53%
Suggested Prices Based on Cap Rates
Cap Rate 5%
$1,505,040
$1.5M
Cap Rate 7%
$1,075,029
$1.1M
Cap Rate 9%
$836,133
$836.1K
Market Conditions
NOI Build-Up for 5,688 SF
Gross rent
$119.4K $21.00/SF
− Vacancy
−$19.1K −$3.36/SF
EGI
$100.3K $17.64/SF
− OpEx
−$25.1K −$4.41/SF
NOI
$75.3K $13.23/SF
Area
Campbell County, TN
Vacancy
16.00%
Lease Rate
$21.00 /SF/Yr
Expense Ratio
25.00%
Simulate Cap Rate and NOI
Suggested Prices Based on Cap Rates
Cap Rate 5%
$1,505,040
Cap Rate 7%
$1,075,029
Cap Rate 9%
$836,133
Alternative Uses
Best Use
Office B
$1.08M
$940.7K – $1.25M
NOI $75,252 @ 7.0% cap · market cap 7.53%
Second Best
Healthcare Medical
$1.03M
$904.6K – $1.21M
NOI $72,365 @ 7.0% cap · market cap 7.24%
Theoretical Best
Office A
$1.41M
$1.23M – $1.64M
NOI $98,616 @ 7.0% cap · market cap 9.86%
Zoning and permitted uses should be independently verified with authorities.
How Realmo checks its estimates
Property Analytics
Unlock full access to Insights
Subscribe to Realmo Intelligence
Open Analytics
Current Use
Location Intelligence
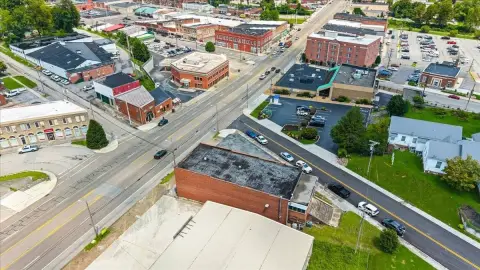
Trade Area within ½ mile
346
Businesses Nearby
Explore this area
Business Placement
Demographics for 37766, TN
18,011
Population
9,721
Households
1.9
Avg Household Size
44
Median Age
12%
College-Educated
82%
High-School Grad
137.3 sq mi
ZIP Area
131
Density / Sq Mi
$46,692
Median Household Income
$31,379
Median Earnings
$747
Median Rent
$160,500
Median Home Value
Check the figures for this property
Cap Rate, Value Estimation, Potential NOI and more
View Realmo Analytics
Market
Vacancy Rate% for Office in South region

Questions? Ask Rey
Realmo’s AI knows this listing — price, zoning, demand, history. Ask anything.



Frequently Asked Questions
What type of property is this?
Medical center - Freestanding healthcare facility with specialized plumbing, multiple exam rooms, secure reception, and dedicated storage areas.
Where is this medical center located?
The property is located at 305 River Drive La Follette, TN.
What is the asking price?
The asking price for this property is $1,000,000.
What are key features of this property?
This property features: 5,688‑square‑foot medical center completed in 2007; Treatment bay measures approximately 70' × 29' with integrated sinks; Dialysis‑grade water and plumbing infrastructure


