Mixed-Use Property with Four
For Sale
$760,000
Pending
3020 NE GLISAN ST, Portland, OR 97232
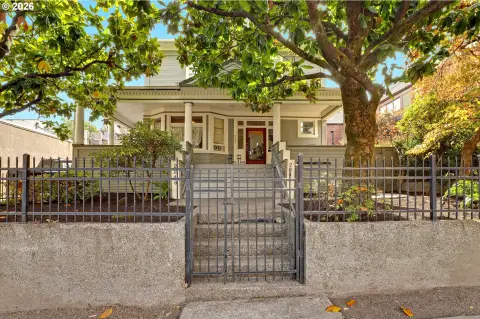
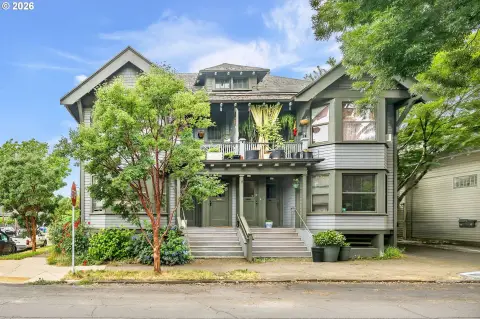
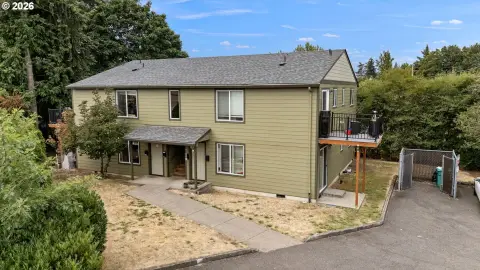
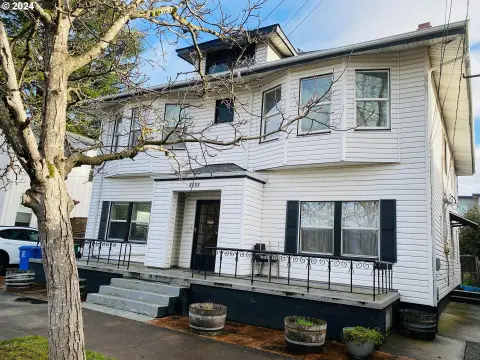
Fully leased commercial space complements four residential studios in a vertically integrated mixed-use configuration.
Property Size4,326 SF
Days on Market54
Property Features for 3020 NE GLISAN ST
General Information
Standard status
Pending
Size
4,326 SF
Class
Class C
Property subtype
MULTI_FAMILY
Zoning
CM2
Occupancy
100%
Site & Location
Highway Access
Yes
Road Access
Yes
Public Transit
Yes
Units
Unit Mix
4 x studio
Multifamily Units
4
Taxes and HOA fees
Annual Taxes
$6,608
Building Details
Building Size
4,326 SF
Year Built
1925
Buildings
1
Stories
2
Tenancy
Multi
Listing Agency:
ELEETE Real Estate
Listed By:
Lee Davies · License #851200114
(503) 468-4018
Source:
Eleeterealestate
Added: Aug 14
Changed: Sep 28
Last Checked: Oct 6 at 12:21AM
Displayed information is deemed reliable but is not guaranteed and should be independently verified. All listing content including descriptions, pricing, images are the copyrighted material of ELEETE Real Estate
Investment Insights
Based on property information with market context.
Built in 1925, this mixed-use property combines four residential studio units with a ground-floor commercial space. The studios range from approx. 550-640 sq. ft. and include hardwood and tile flooring, gas ranges, and refrigerators. Residential occupancy is 100%, with updated rent rolls supporting the existing income profile.
The approximately 1,953-square-foot commercial premises are occupied by Brassworks Gallery under a modified-gross lease extending through 2030. The space fronts NE Glisan Street near NE 30th and provides street-level exposure. CM2 zoning supports the property’s mixed-use classification, while nearby access to I-84, TriMet, the Lloyd District, Broadway, and Providence Medical Center places the asset within an established inner Northeast Portland employment and service area.
The approximately 1,953-square-foot commercial premises are occupied by Brassworks Gallery under a modified-gross lease extending through 2030. The space fronts NE Glisan Street near NE 30th and provides street-level exposure. CM2 zoning supports the property’s mixed-use classification, while nearby access to I-84, TriMet, the Lloyd District, Broadway, and Providence Medical Center places the asset within an established inner Northeast Portland employment and service area.
Key Highlights
- Four residential studio units with 100% occupancy
- Studio units range from approx. 550‑640 sq. ft.
- Approximately 1,953 sq. ft. of ground‑floor commercial space
Financial Insights
Estimated NOI and Cap Rate
NOI / Yr
$58,401
Cap Rate
7.68%
Suggested Prices Based on Cap Rates
Cap Rate 5%
$1,168,020
$1.2M
Cap Rate 7%
$834,300
$834.3K
Cap Rate 9%
$648,900
$648.9K
Market Conditions
NOI Build-Up for 4,326 SF
Gross rent
$103.8K $24.00/SF
− Vacancy
−$10.4K −$2.40/SF
EGI
$93.4K $21.60/SF
− OpEx
−$35.0K −$8.10/SF
NOI
$58.4K $13.50/SF
Area
Portland, OR
Vacancy
10.00%
Lease Rate
$24.00 /SF/Yr
Expense Ratio
37.50%
Simulate Cap Rate and NOI
Suggested Prices Based on Cap Rates
Cap Rate 5%
$1,168,020
Cap Rate 7%
$834,300
Cap Rate 9%
$648,900
Alternative Uses
Best Use
Mixed Use
$834.3K
$730.0K – $973.4K
NOI $58,401 @ 7.0% cap · market cap 7.68%
Second Best
Apartment 5plus
$793.5K
$694.3K – $925.8K
NOI $55,546 @ 7.0% cap · market cap 7.31%
Theoretical Best
Office A
$1.21M
$1.06M – $1.42M
NOI $85,039 @ 7.0% cap · market cap 11.19%
Zoning and permitted uses should be independently verified with authorities.
Property Analytics
Unlock full access to Insights
Subscribe to Realmo Intelligence
Open Analytics
Current Use
Lease Details
4
Residential units
100%
Occupancy
Multi-tenant
Tenancy
Yes
Highway access
Yes
Paved road access
Location Intelligence
Trade Area within ½ mile
2,379
Businesses Nearby
Explore this area
Business Placement
Demographics for 97232, OR
15,382
Population
9,594
Households
1.6
Avg Household Size
37
Median Age
65%
College-Educated
96%
High-School Grad
1.9 sq mi
ZIP Area
8,096
Density / Sq Mi
$71,278
Median Household Income
$49,794
Median Earnings
$1,584
Median Rent
$801,300
Median Home Value
Check the figures for this property
Cap Rate, Value Estimation, Potential NOI and more
View Realmo Analytics
Market
Vacancy Rate% for Multifamily in West region

Questions? Ask Rey
Realmo’s AI knows this listing — price, zoning, demand, history. Ask anything.




Frequently Asked Questions
What type of property is this?
Mixed-use property - Fully leased commercial space complements four residential studios in a vertically integrated mixed-use configuration.
Where is this mixed-use property located?
The property is located at 3020 NE GLISAN ST Portland, OR.
What is the asking price?
The asking price for this property is $760,000.
What are key features of this property?
This property features: Four residential studio units with 100% occupancy; Studio units range from approx. 550‑640 sq. ft.; Approximately 1,953 sq. ft. of ground‑floor commercial space


