Corner Storefront Redevelopment
For Sale
$160,000
301 4TH S Street, Opelika, AL 36801
Brick commercial building with a storefront layout and paved parking on a prominent corner lot.
Property Size1,344 SF
Price / SF$119.05
Days on Market132
Property Features for 301 4TH S Street
General Information
Standard status
Active
Size
1,344 SF
Property subtype
Commercial/Industrial
Taxes and HOA fees
Annual Taxes
$744
Listing Agency:
PHOENIX REAL ESTATE FIRM LLC
(334) 610-3414
Listed By:
ZANDRA DAVIS · License #000088129
(334) 663-8420
Source:
Exitrealty
Added: Jun 5
Changed: Sep 1
Last Checked: Sep 15 at 6:07AM
Displayed information is deemed reliable but is not guaranteed and should be independently verified. All listing content including descriptions, pricing, images are the copyrighted material of PHOENIX REAL ESTATE FIRM LLC
Investment Insights
Based on property information with market context.
The former Renee's Mod Shop is a brick commercial building featuring a storefront-oriented layout. The property includes a paved parking area and offers flexible space that may support retail, office, service-based businesses, studio use, or future redevelopment. The sale is being made as-is, and buyers should plan accordingly when evaluating building condition and finish details.
The property sits on a prominent corner lot at the intersection of South 4th Street and Avenue B in Opelika, Alabama. With visibility and accessibility associated with the corner location, the site is positioned for convenient customer and client access. It is also described as being near downtown Opelika and major thoroughfares.
For prospective tenants or owners, this asset can be reviewed as a straightforward option for a storefront business or a service or office user seeking an on-site parking arrangement. For buyers considering redevelopment, the seller notes the opportunity for future use and emphasizes that zoning, square footage, utilities, and intended use must be verified by the buyer. This property may be well suited for an operator who wants a recognizable local address and a layout that can be adapted to multiple commercial purposes, subject to due diligence.
The property sits on a prominent corner lot at the intersection of South 4th Street and Avenue B in Opelika, Alabama. With visibility and accessibility associated with the corner location, the site is positioned for convenient customer and client access. It is also described as being near downtown Opelika and major thoroughfares.
For prospective tenants or owners, this asset can be reviewed as a straightforward option for a storefront business or a service or office user seeking an on-site parking arrangement. For buyers considering redevelopment, the seller notes the opportunity for future use and emphasizes that zoning, square footage, utilities, and intended use must be verified by the buyer. This property may be well suited for an operator who wants a recognizable local address and a layout that can be adapted to multiple commercial purposes, subject to due diligence.
Key Highlights
- Brick commercial building built in 1973 on a prominent corner lot
- Corner location at the intersection of South 4th Street and Avenue B in Opelika
- Storefront layout with paved parking area on‑site
Financial Insights
Estimated NOI and Cap Rate
NOI / Yr
$12,658
Cap Rate
7.91%
Suggested Prices Based on Cap Rates
Cap Rate 5%
$253,160
$253.2K
Cap Rate 7%
$180,829
$180.8K
Cap Rate 9%
$140,644
$140.6K
Market Conditions
NOI Build-Up for 1,344 SF
Gross rent
$20.2K $15.00/SF
− Vacancy
−$2.1K −$1.55/SF
EGI
$18.1K $13.46/SF
− OpEx
−$5.4K −$4.04/SF
NOI
$12.7K $9.42/SF
Area
Lee County, AL
Vacancy
10.30%
Lease Rate
$15.00 /SF/Yr
Expense Ratio
30.00%
Simulate Cap Rate and NOI
Suggested Prices Based on Cap Rates
Cap Rate 5%
$253,160
Cap Rate 7%
$180,829
Cap Rate 9%
$140,644
Alternative Uses
Best Use
Retail
$180.8K
$158.2K – $211.0K
NOI $12,658 @ 7.0% cap · market cap 7.91%
Second Best
—
—
no second resolved use
Theoretical Best
Office A
$327.8K
$286.8K – $382.4K
NOI $22,946 @ 7.0% cap · market cap 14.34%
Zoning and permitted uses should be independently verified with authorities.
How Realmo checks its estimates
Property Analytics
Unlock full access to Insights
Subscribe to Realmo Intelligence
Open Analytics
Current Use
Location Intelligence
Trade Area within ½ mile
876
Businesses Nearby
71k
Monthly Visits Nearby
Balanced
Demand for This Use
Explore this area
Business Placement
Foot Traffic Nearby
Shops & Services 59%
Dining 41%
Burger King
Dining
16,480 visits/mo
0.5 miles
Circle K
Shops & Services
14,118 visits/mo
0.5 miles
Dollar Tree
Shops & Services
9,583 visits/mo
0.4 miles
Guthrie's
Dining
7,951 visits/mo
0.5 miles
Wells Fargo
Shops & Services
6,122 visits/mo
0.3 miles
Demographics for 36801, AL
24,590
Population
11,363
Households
2.2
Avg Household Size
38
Median Age
33%
College-Educated
89%
High-School Grad
78.3 sq mi
ZIP Area
314
Density / Sq Mi
$58,256
Median Household Income
$39,018
Median Earnings
$926
Median Rent
$211,400
Median Home Value
Check the figures for this property
Cap Rate, Value Estimation, Potential NOI and more
View Realmo Analytics
Market
Vacancy Rate% for Retail in South region

Questions? Ask Rey
Realmo’s AI knows this listing — price, zoning, demand, history. Ask anything.
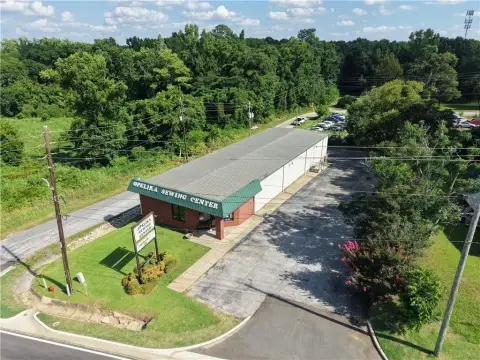

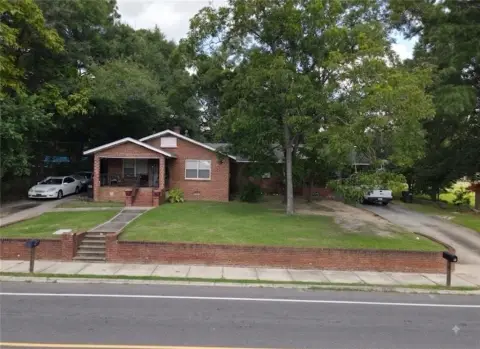
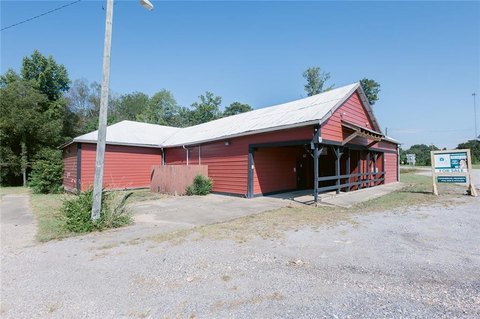


Similar Off Market Nearby
- The New Blossom Shop — 905 Geneva St, Opelika, AL 36801
- A & O Florists — 131 Columbus Pkwy, Opelika, AL 36801
Frequently Asked Questions
What type of property is this?
Storefront property - Brick commercial building with a storefront layout and paved parking on a prominent corner lot.
Where is this storefront property located?
The property is located at 301 4TH S Street Opelika, AL.
What is the asking price?
The asking price for this property is $160,000.
What are key features of this property?
This property features: Brick commercial building built in 1973 on a prominent corner lot; Corner location at the intersection of South 4th Street and Avenue B in Opelika; Storefront layout with paved parking area on‑site


