Six-Parcel Mixed-Use
For Sale
$7,500,000
3004-3090 N Downing & 3057 Marion St, Denver, CO 80205
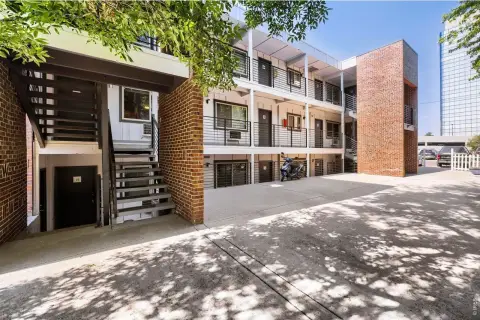
Five commercial spaces, seven residential units, and multiple parking parcels form an assembled urban property.
Property Size42,351 SF
Lot Size1.30 Acres
Price / SF$177.09
Days on Market113
Property Features for 3004-3090 N Downing & 3057 Marion St
General Information
Standard status
Active
Size
42,351 SF
Lot size
1.30 Acres
Property subtype
Development/Value Add Portfolio
Site & Location
Highway Access
Yes
Public Transit
Yes
Additional Details
Asking Price
$7,500,000
Multifamily Units
7
Building Details
Building Size
42,351 SF
Listing Agency:
Unique Properties, Inc
Listed By:
Sam Leger · License #FA.040042452
(303) 941-8112
Source:
Uniqueprop
Added: Jun 25
Changed: Oct 13
Last Checked: Oct 12 at 6:42PM
Displayed information is deemed reliable but is not guaranteed and should be independently verified. All listing content including descriptions, pricing, images are the copyrighted material of Unique Properties, Inc
Investment Insights
Based on property information with market context.
This mixed-use portfolio comprises six parcels with approximately 42,351 SF of existing improvements on approximately 56,540 SF of land. The configuration includes five commercial spaces, seven residential units, and separate parking parcels, providing a varied combination of income-producing components within one assembled holding.
The property includes 3004-3090 N. Downing Street and 3057 Marion Street in Denver’s Five Points/Whittier area. Its location offers access to I-25, I-70, Downtown Denver, RiNo, and the broader urban core. The 30th & Downing light rail station is adjacent to the property, while the 38th & Blake commuter rail station is within walking distance.
The assemblage sits along the Downing Street corridor amid mixed-use, multifamily, retail, and commercial development activity. Multiple buildings and parking parcels create a varied physical layout across the assembled site.
The property includes 3004-3090 N. Downing Street and 3057 Marion Street in Denver’s Five Points/Whittier area. Its location offers access to I-25, I-70, Downtown Denver, RiNo, and the broader urban core. The 30th & Downing light rail station is adjacent to the property, while the 38th & Blake commuter rail station is within walking distance.
The assemblage sits along the Downing Street corridor amid mixed-use, multifamily, retail, and commercial development activity. Multiple buildings and parking parcels create a varied physical layout across the assembled site.
Key Highlights
- Six‑parcel mixed‑use portfolio at 3004‑3090 N. Downing Street and 3057 Marion Street
- Approximately 42,351 SF of existing improvements on approximately 56,540 SF of land
- Five commercial spaces and seven residential units
Financial Insights
Estimated NOI and Cap Rate
NOI / Yr
$643,042
Cap Rate
8.57%
Suggested Prices Based on Cap Rates
Cap Rate 5%
$12,860,840
$12.9M
Cap Rate 7%
$9,186,314
$9.2M
Cap Rate 9%
$7,144,911
$7.1M
Market Conditions
NOI Build-Up for 42,351 SF
Gross rent
$1.25M $29.40/SF
− Vacancy
−$76.0K −$1.79/SF
EGI
$1.17M $27.61/SF
− OpEx
−$526.1K −$12.42/SF
NOI
$643.0K $15.18/SF
Area
Denver, CO
Vacancy
6.10%
Lease Rate
$29.40 /SF/Yr
Expense Ratio
45.00%
Simulate Cap Rate and NOI
Suggested Prices Based on Cap Rates
Cap Rate 5%
$12,860,840
Cap Rate 7%
$9,186,314
Cap Rate 9%
$7,144,911
Alternative Uses
Best Use
Apartment 5plus
$9.19M
$8.04M – $10.72M
NOI $643,042 @ 7.0% cap · market cap 8.57%
Second Best
Mixed Use
$8.52M
$7.46M – $9.94M
NOI $596,514 @ 7.0% cap · market cap 7.95%
Theoretical Best
Office A
$13.48M
$11.80M – $15.73M
NOI $943,729 @ 7.0% cap · market cap 12.58%
Zoning and permitted uses should be independently verified with authorities.
How Realmo checks its estimates
Property Analytics
Current Use
Lease Details
7
Residential units
Yes
Highway access
Location Intelligence
Trade Area within ½ mile
2,351
Businesses Nearby
Explore this area
Business Placement
Demographics for 80205, CO
34,967
Population
19,040
Households
1.8
Avg Household Size
34
Median Age
61%
College-Educated
94%
High-School Grad
4.6 sq mi
ZIP Area
7,602
Density / Sq Mi
$98,770
Median Household Income
$69,760
Median Earnings
$1,816
Median Rent
$627,600
Median Home Value
Market
Vacancy Rate% for Multifamily in West region

Questions? Ask Rey
Realmo’s AI knows this listing — price, zoning, demand, history. Ask anything.




Frequently Asked Questions
What type of property is this?
Mixed-use property - Five commercial spaces, seven residential units, and multiple parking parcels form an assembled urban property.
Where is this mixed-use property located?
The property is located at 3004-3090 N Downing & 3057 Marion St Denver, CO.
What is the asking price?
The asking price for this property is $7,500,000.
What are key features of this property?
This property features: Six‑parcel mixed‑use portfolio at 3004‑3090 N. Downing Street and 3057 Marion Street; Approximately 42,351 SF of existing improvements on approximately 56,540 SF of land; Five commercial spaces and seven residential units


