Mixed-Use Apartment and Retail
For Sale
$475,000
Pending
30 East 25th Street, Baltimore, MD 21218
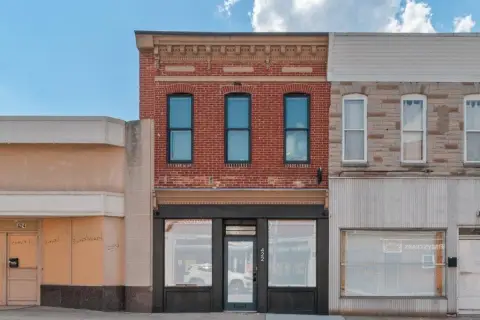
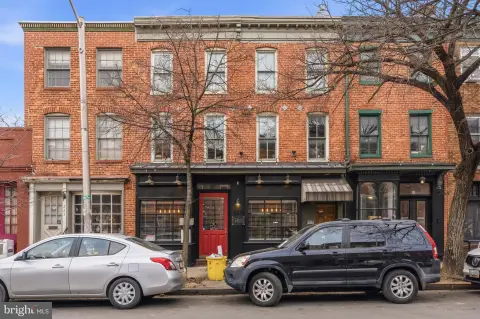
Six-unit property combines four apartments with two street-level suites for a diversified tenant mix.
Property Size3,135 SF
Days on Market149
Property Features for 30 East 25th Street
General Information
Standard status
Pending
Size
3,135 SF
Property subtype
Multi-Family / Fee Simple
Zoning
C-1
Additional Details
Cap Rate
9.2%
Multifamily Units
4
Taxes and HOA fees
Annual Taxes
$7,349
Amenities
No Pool
Building Details
Year Built
1900
Tenancy
Multi
Listing Agency:
Ben Frederick Realty, Inc.
Listed By:
Will A Cannon III · License #657102
(410) 916-3331
Source:
Compass
Added: May 27
Changed: Oct 21
Last Checked: Oct 20 at 11:56PM
Displayed information is deemed reliable but is not guaranteed and should be independently verified. All listing content including descriptions, pricing, images are the copyrighted material of Ben Frederick Realty, Inc.

Ask AI about this property
Review the available facts, identify missing information and prepare questions for the agent.
Investment Insights
Based on property information with market context.
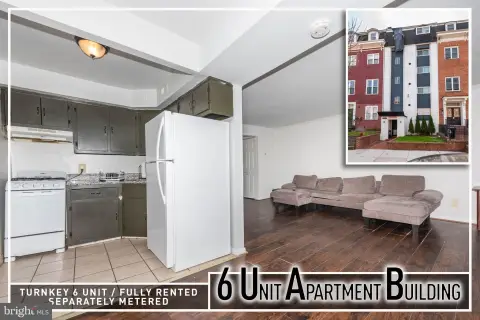
30 East 25th Street is a six-unit mixed-use building featuring four residential apartments and two commercial suites. The residential mix includes two one-bedroom apartments and two studio apartments, with kitchens that feature laminate counters, wood cabinetry, stainless steel sinks, 30-inch electric ranges, and built-in microwaves. Bathrooms include modern vanities, steel tubs, and ceramic tile surrounds. Each one-bedroom apartment includes stacked washer/dryer units. Both commercial suites are tenant fit-out with flexible layouts for office, retail, studio, or service-oriented use, and each includes a half-bath. Suite 101 has hardwood flooring, and the lower-level suite has laminate flooring.
The property is located along Baltimore’s East 25th Street commercial corridor in the Charles Village neighborhood. The building benefits from steady pedestrian activity and visibility associated with the corridor, and Johns Hopkins University’s Homewood Campus is approximately five blocks to the north. Walk Score is 96, Transit Score is 80, and Bike Score is 85.
As an all-electric asset, the building uses separate systems for residential and commercial spaces, with each unit and suite served by its own electric heat pump with central air conditioning and its own electric water heater. Seven electric meters serve the property, and the landlord currently pays public service electric and water and sewer, with potential to implement water bill-back practices to improve operating efficiency. The current operations reflect diversified market rents across apartment and street-level commercial tenancy.
The property is located along Baltimore’s East 25th Street commercial corridor in the Charles Village neighborhood. The building benefits from steady pedestrian activity and visibility associated with the corridor, and Johns Hopkins University’s Homewood Campus is approximately five blocks to the north. Walk Score is 96, Transit Score is 80, and Bike Score is 85.
As an all-electric asset, the building uses separate systems for residential and commercial spaces, with each unit and suite served by its own electric heat pump with central air conditioning and its own electric water heater. Seven electric meters serve the property, and the landlord currently pays public service electric and water and sewer, with potential to implement water bill-back practices to improve operating efficiency. The current operations reflect diversified market rents across apartment and street-level commercial tenancy.
Key Highlights
- Six‑unit mixed‑use building: four residential apartments plus two street‑level commercial suites at 30 East 25th Street
- Residential mix includes two 1‑bedroom apartments and two studio apartments
- Each residential unit includes stacked washer/dryer; kitchens feature laminate counters, wood cabinetry, electric ranges, and built‑in microwaves
Financial Insights
Estimated NOI and Cap Rate
NOI / Yr
$36,371
Cap Rate
7.66%
Suggested Prices Based on Cap Rates
Cap Rate 5%
$727,420
$727.4K
Cap Rate 7%
$519,586
$519.6K
Cap Rate 9%
$404,122
$404.1K
Market Conditions
NOI Build-Up for 3,135 SF
Gross rent
$70.7K $22.56/SF
− Vacancy
−$4.6K −$1.47/SF
EGI
$66.1K $21.09/SF
− OpEx
−$29.8K −$9.49/SF
NOI
$36.4K $11.60/SF
Area
ZIP 21218
Vacancy
6.50%
Lease Rate
$22.56 /SF/Yr
Expense Ratio
45.00%
Simulate Cap Rate and NOI
Suggested Prices Based on Cap Rates
Cap Rate 5%
$727,420
Cap Rate 7%
$519,586
Cap Rate 9%
$404,122
Alternative Uses
Best Use
Apartment 5plus
$519.6K
$454.6K – $606.2K
NOI $36,371 @ 7.0% cap · market cap 7.66%
Second Best
Retail
$437.9K
$383.2K – $510.9K
NOI $30,653 @ 7.0% cap · market cap 6.45%
Theoretical Best
Office A
$852.4K
$745.8K – $994.4K
NOI $59,665 @ 7.0% cap · market cap 12.56%
Zoning and permitted uses should be independently verified with authorities.
How Realmo checks its estimates
Property Analytics
Contact the owner directly
Get the owner's phone numbers and email
Open Analytics
Current Use
Lease Details
4
Residential units
Multi-tenant
Tenancy
Location Intelligence
Trade Area within ½ mile
2,933
Businesses Nearby
Explore this area
Business Placement
Demographics for 21218, MD
46,238
Population
21,751
Households
2.1
Avg Household Size
34
Median Age
44%
College-Educated
90%
High-School Grad
4.3 sq mi
ZIP Area
10,753
Density / Sq Mi
$58,378
Median Household Income
$38,316
Median Earnings
$1,239
Median Rent
$229,800
Median Home Value
Check the figures for this property
Cap Rate, Value Estimation, Potential NOI and more
View Realmo Analytics
Market
Vacancy Rate% for Multifamily in South region







Frequently Asked Questions
What type of property is this?
Apartment building - Six-unit property combines four apartments with two street-level suites for a diversified tenant mix.
Where is this apartment building located?
The property is located at 30 East 25th Street Baltimore, MD.
What is the asking price?
The asking price for this property is $475,000.
What are key features of this property?
This property features: Six‑unit mixed‑use building: four residential apartments plus two street‑level commercial suites at 30 East 25th Street; Residential mix includes two 1‑bedroom apartments and two studio apartments; Each residential unit includes stacked washer/dryer; kitchens feature laminate counters, wood cabinetry, electric ranges, and built‑in microwaves


