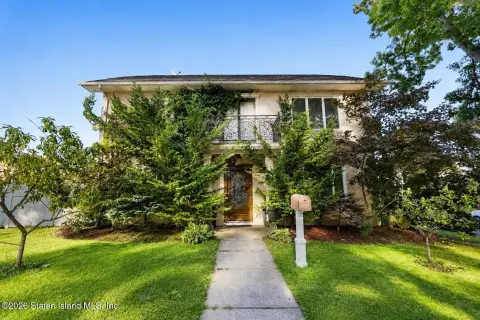
Four-Unit Quadplex with
For Sale
$1,550,000
30-32 Nicholas Street, Staten Island, NY 10301
Residential Income, Staten Island, NY
Property Size2,829 SF
Lot Size0.12 Acres
Price / SF$547.90
Days on Market151
Property Features for 30-32 Nicholas Street
General Information
Property type
Residential Multi Family
Property subtype
Duplex
Zoning
R3A
Bedrooms
12
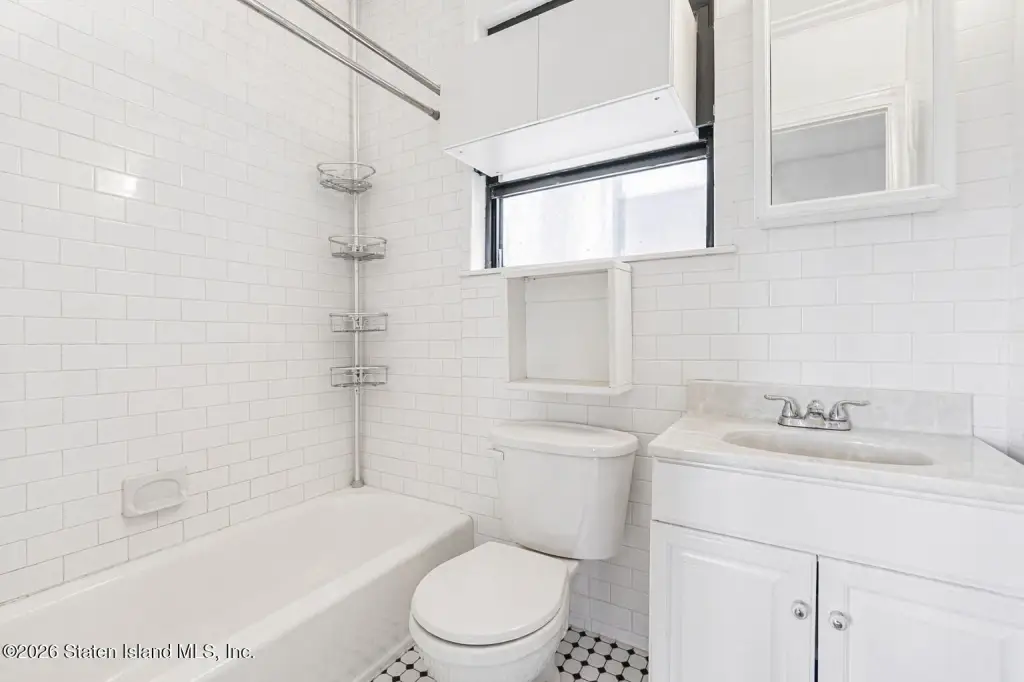
Bathrooms
6
Full bathrooms
4
Rooms
Bathroom 4, Bedroom 9, Bathroom 3, Bedroom 7, Bathroom 2, Bathroom 5, Bedroom 6, Bedroom 1, Bedroom 10, Bedroom 4, Bedroom 12, Bathroom 6, Bedroom 11, Bathroom 1, Bedroom 8, Bedroom 5, Bedroom 3, Bedroom 2
Parking features
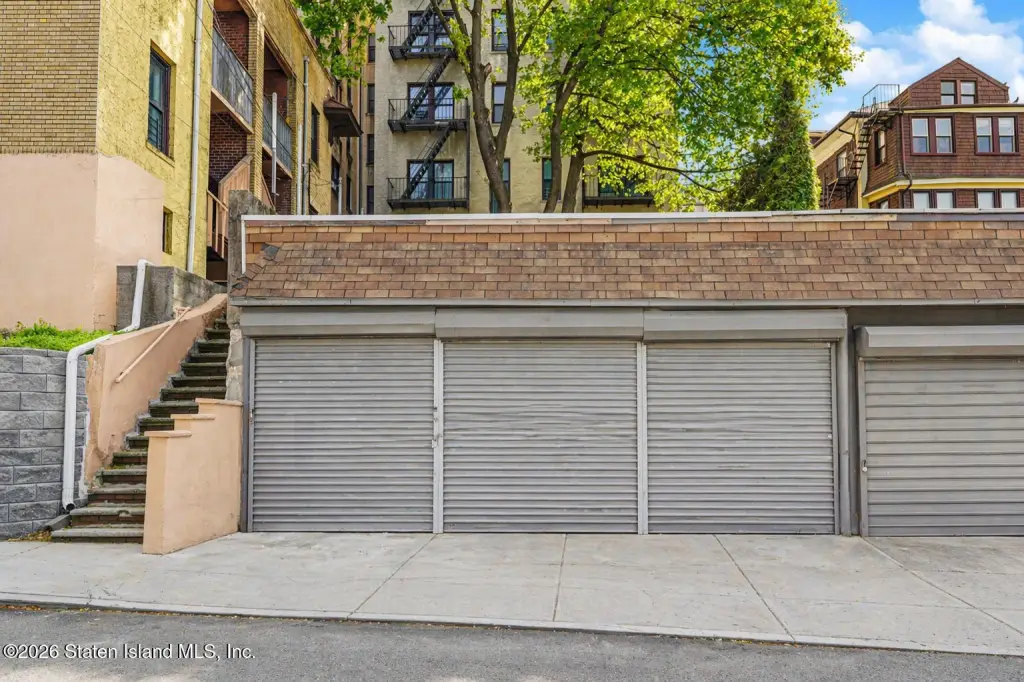
On Street, Garage
Patio and Porch features
Deck
Exterior features
Balcony
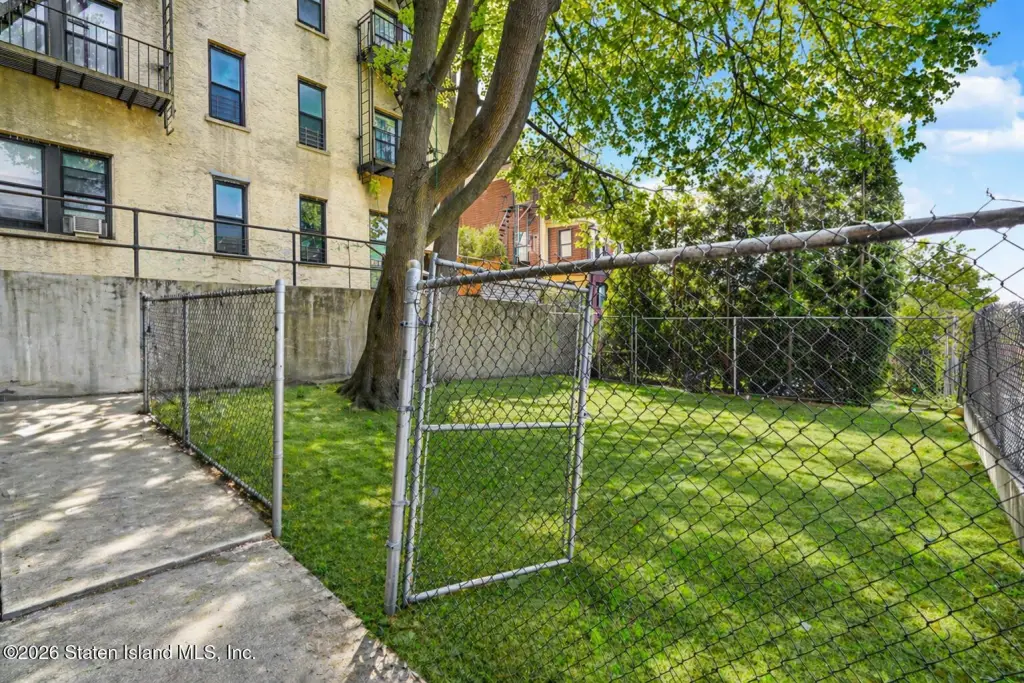
Fencing
Fenced, Chain Link
Basement
Finished, Partially Finished, Full
Lot features
Front Yard, Back Yard
Subdivision
St. George
Standard status
Active
Size
2,829 SF
Lot size
0.12 Acres
Taxes and HOA fees
Tax Annual Amount
9072
Utilities
Sewer type
Public Sewer
Heating system
Hot Water(Heating), Natural Gas
Amenities
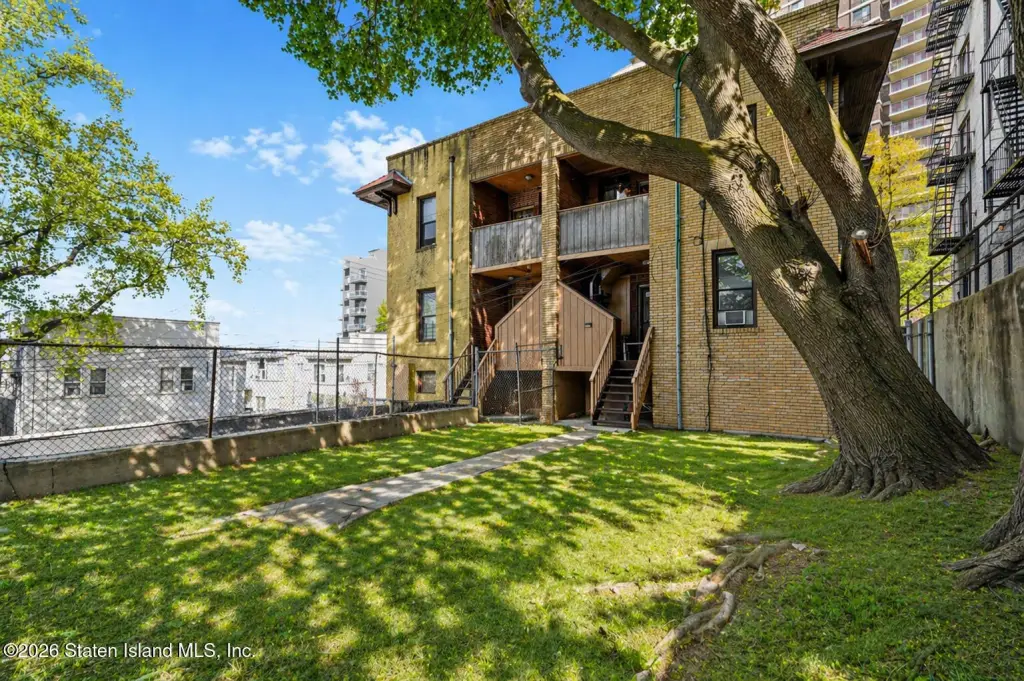
shared backyard
finished basement
Building Details
Year built
1931
Floors in Building
2
Number of units
4
Building materials
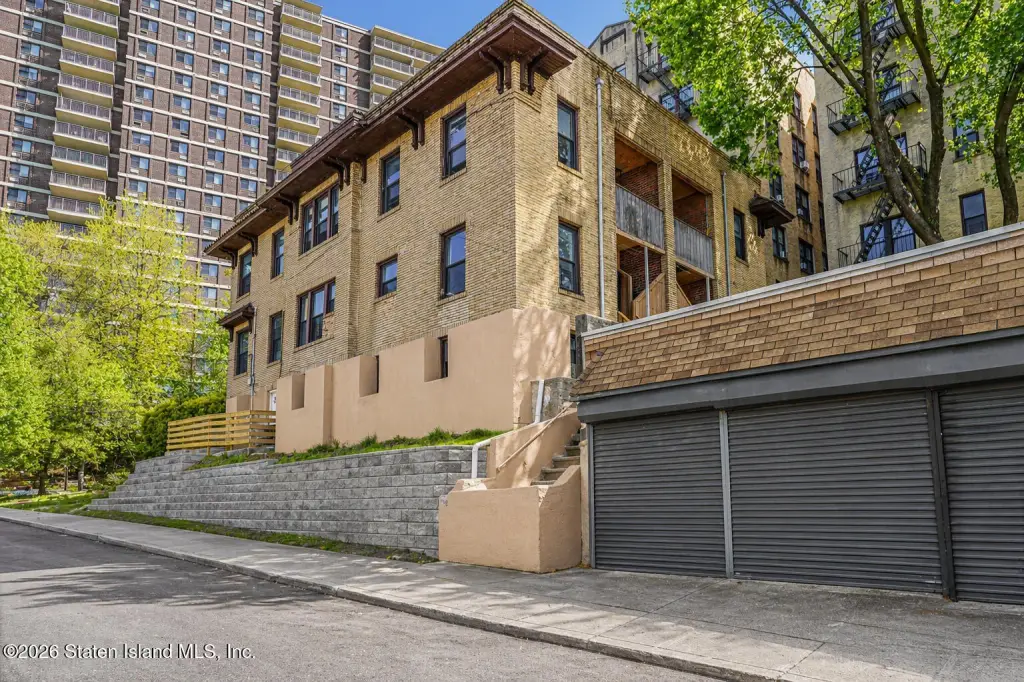
Brick
Listing Agency:
EXP Realty
(888) 276-0630
Listed By:
Allison Mireau · License #2298995
(646) 266-0188
Added: May 18
Changed: Oct 6
Last Checked: Oct 15 at 8:06AM
MLS# 2602773
Copyright © 2026 Staten Island Board of Realtors. All rights reserved. All information provided by the listing agent/broker is deemed reliable but is not guaranteed and should be independently verified.
Investment Insights
Based on property information with market context.
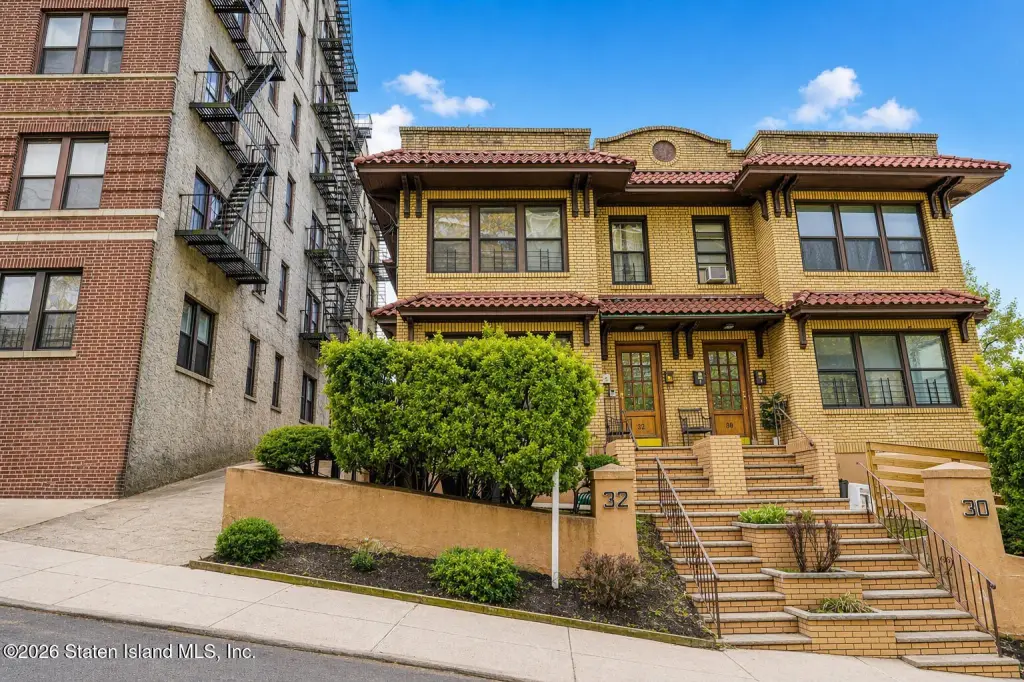
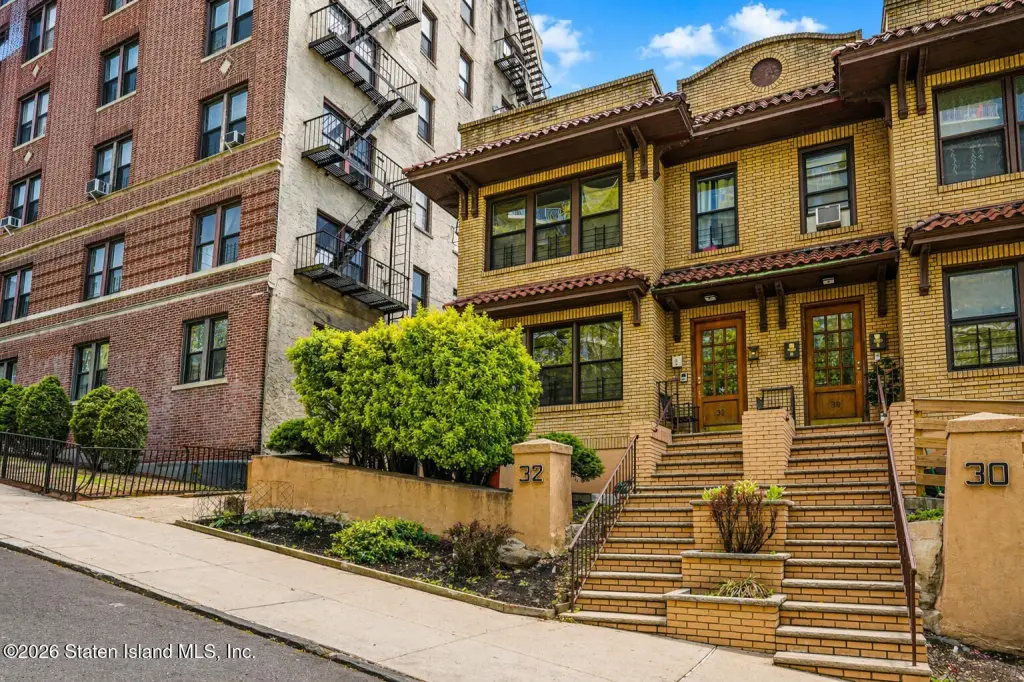
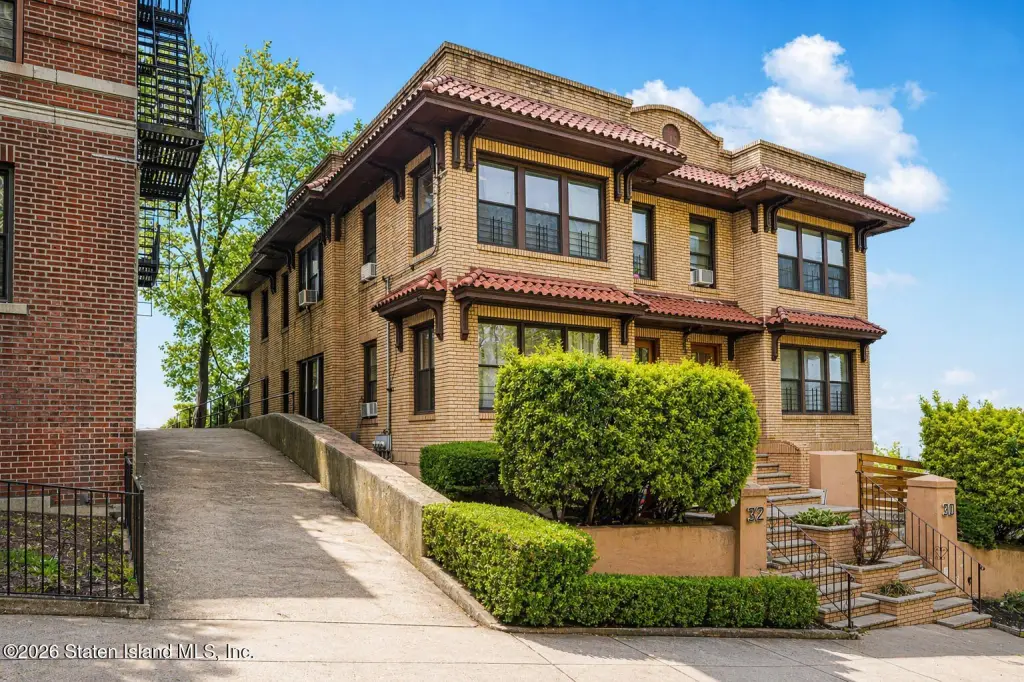
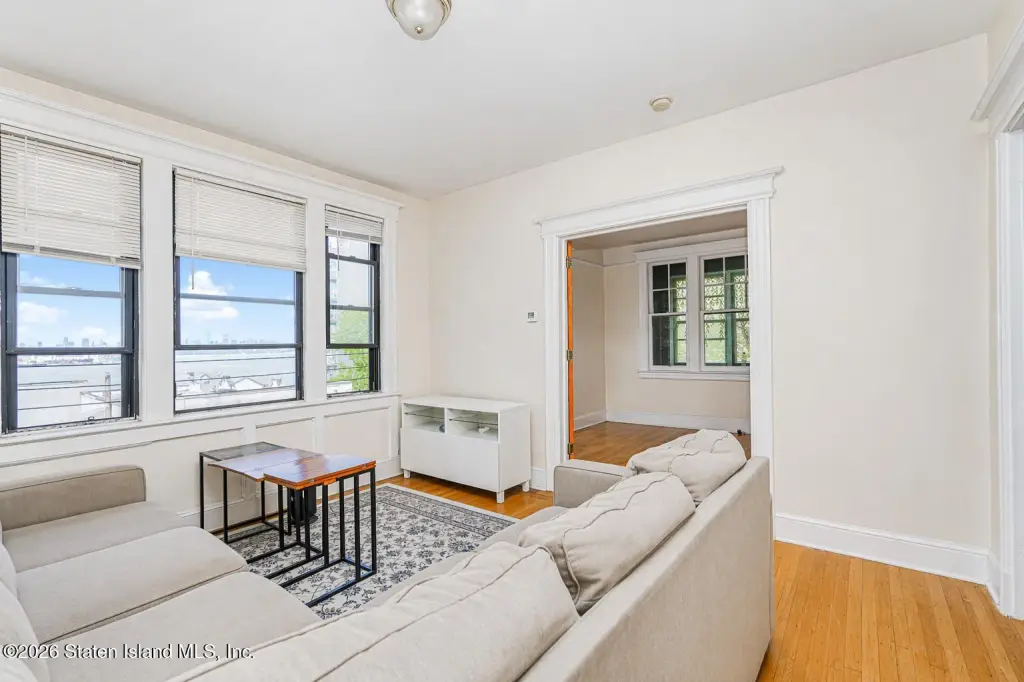
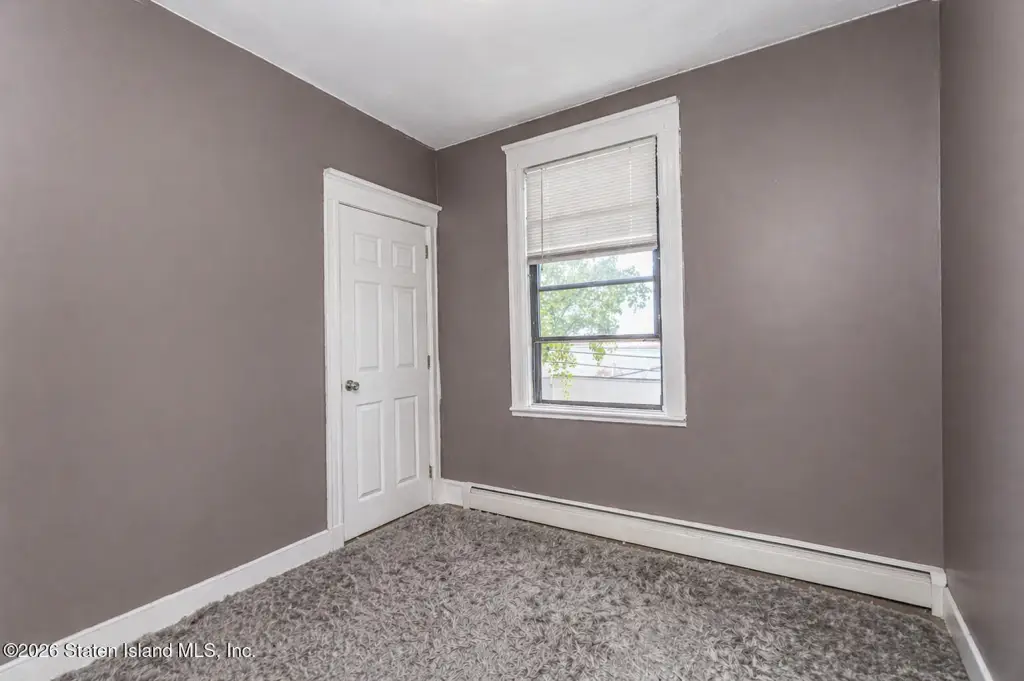
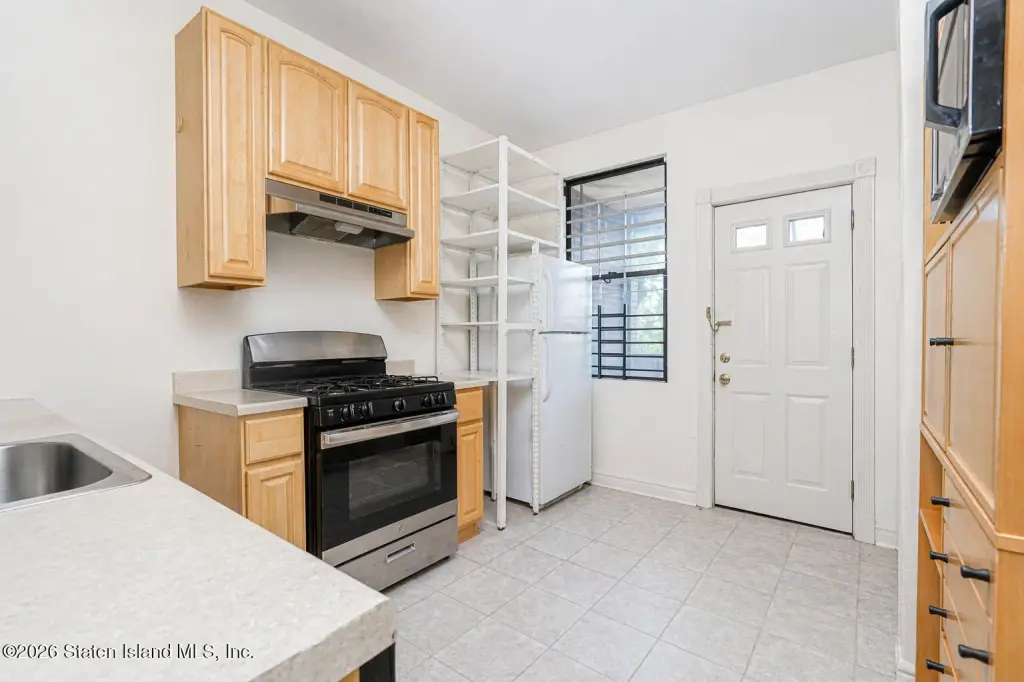
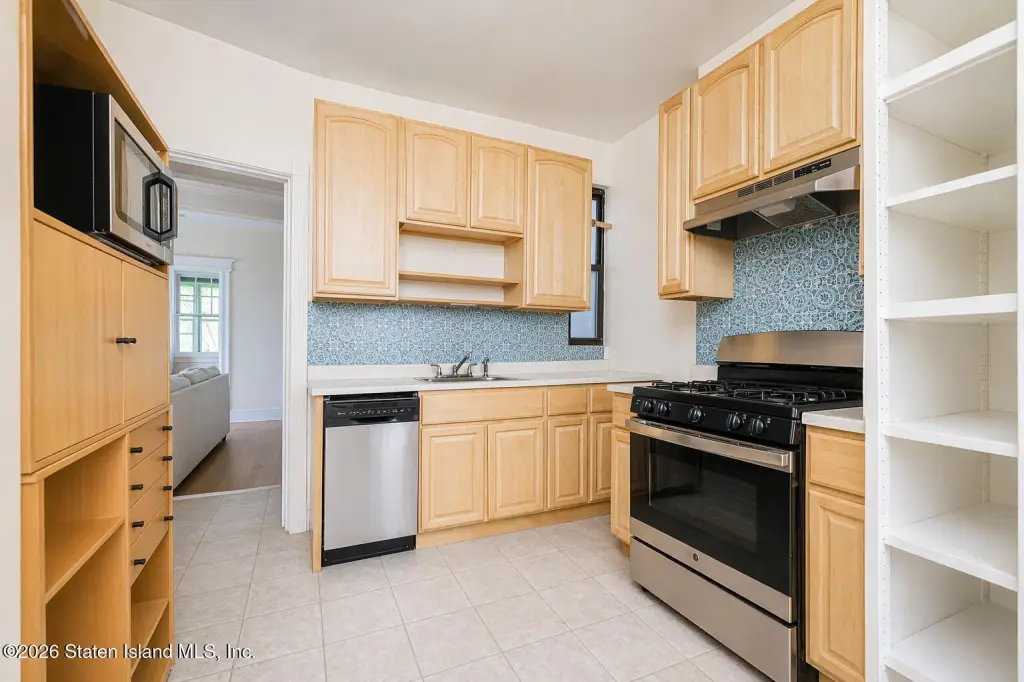
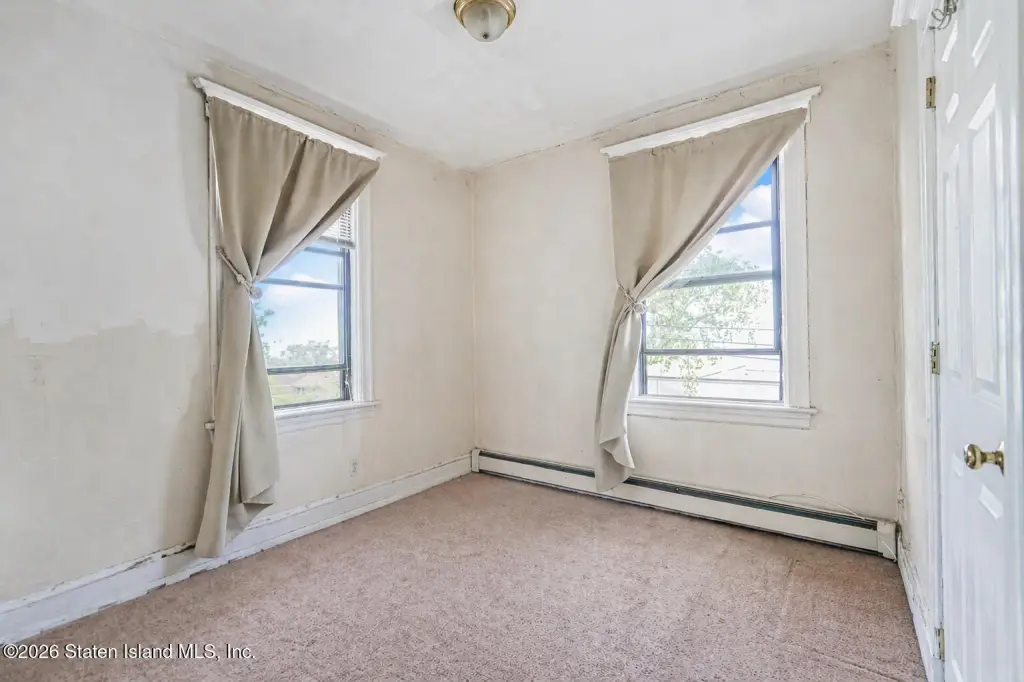
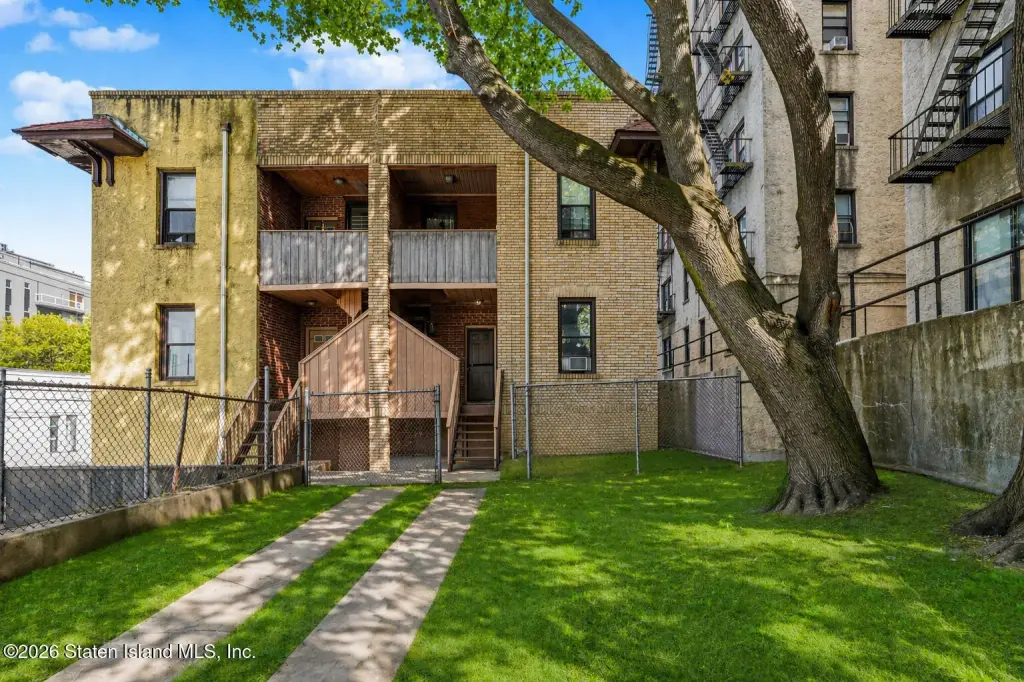
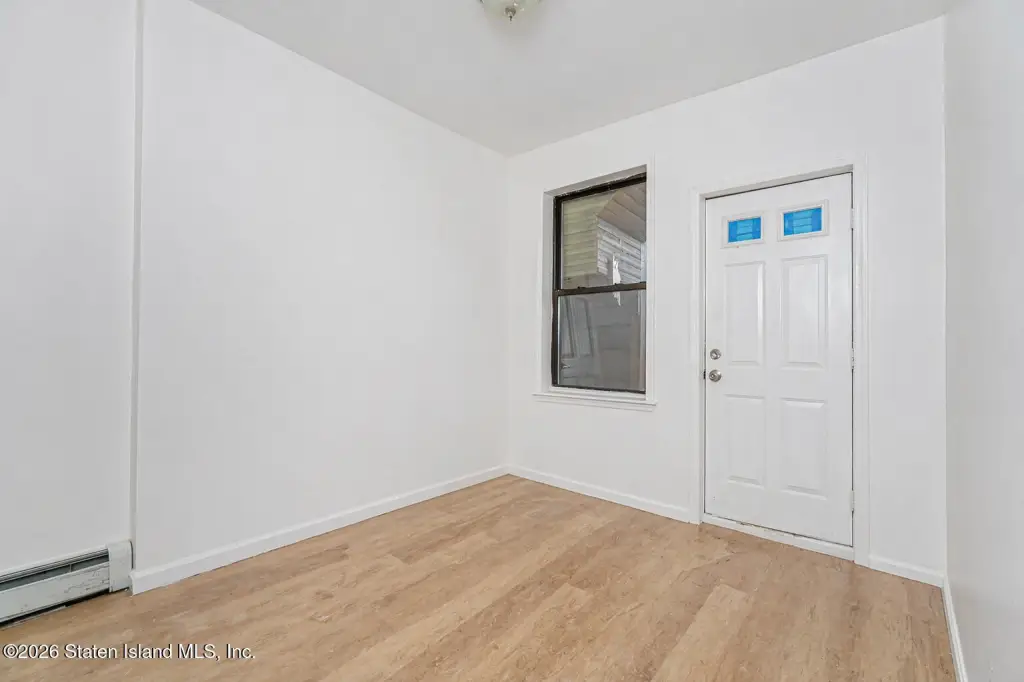
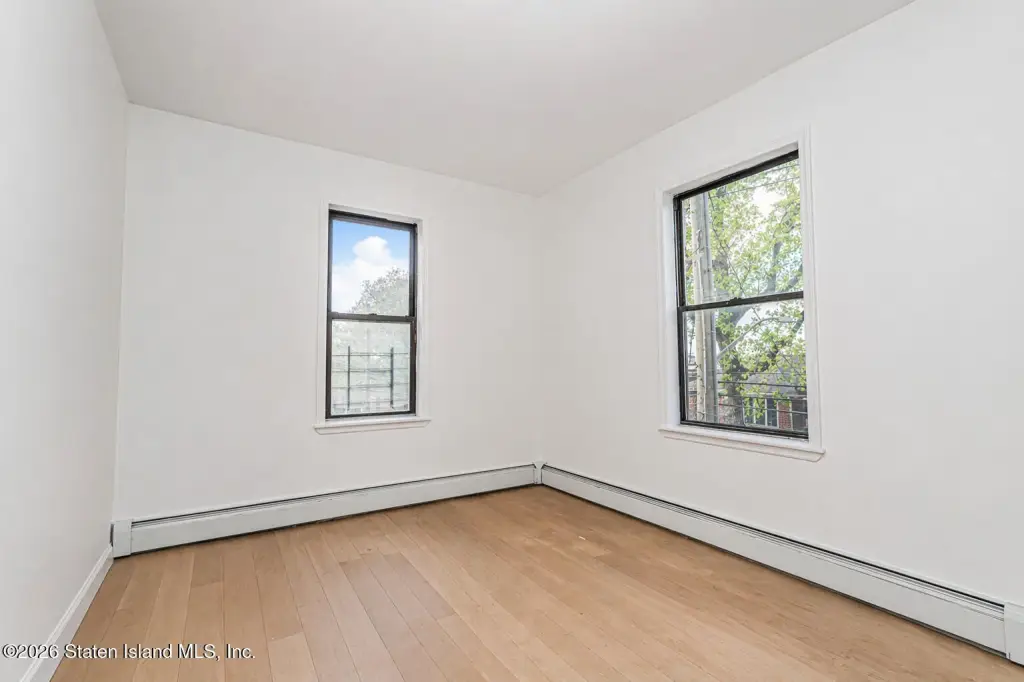
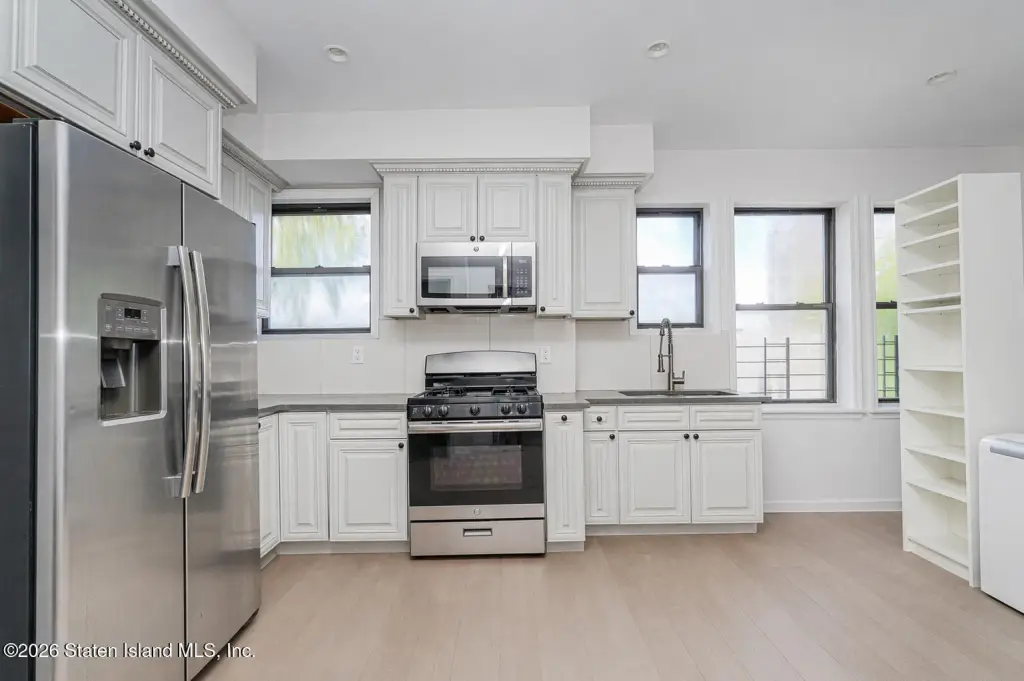
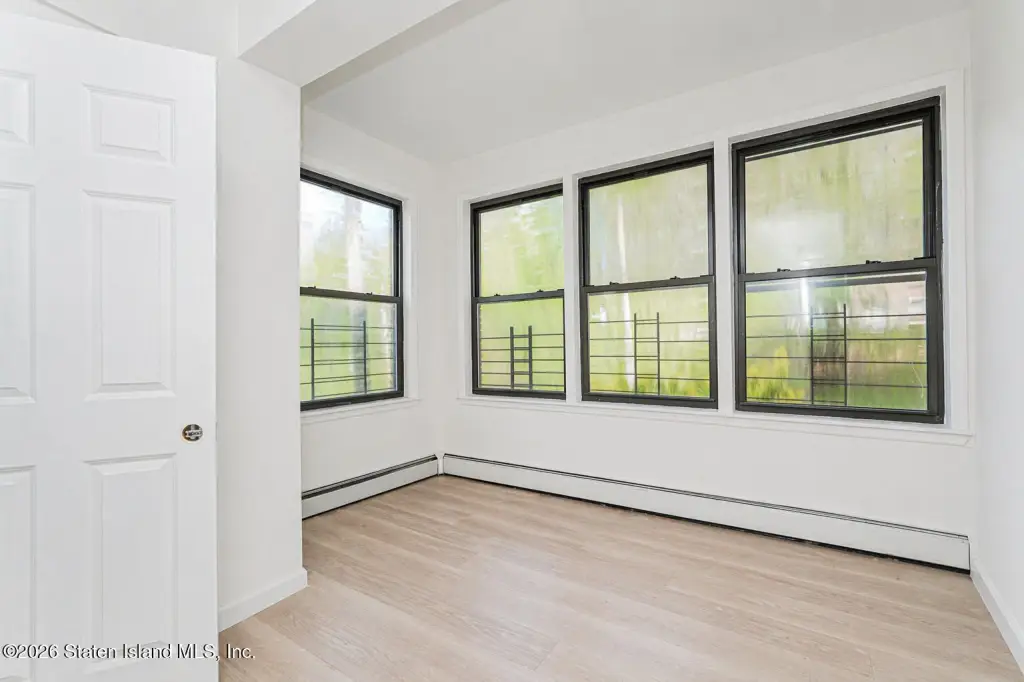
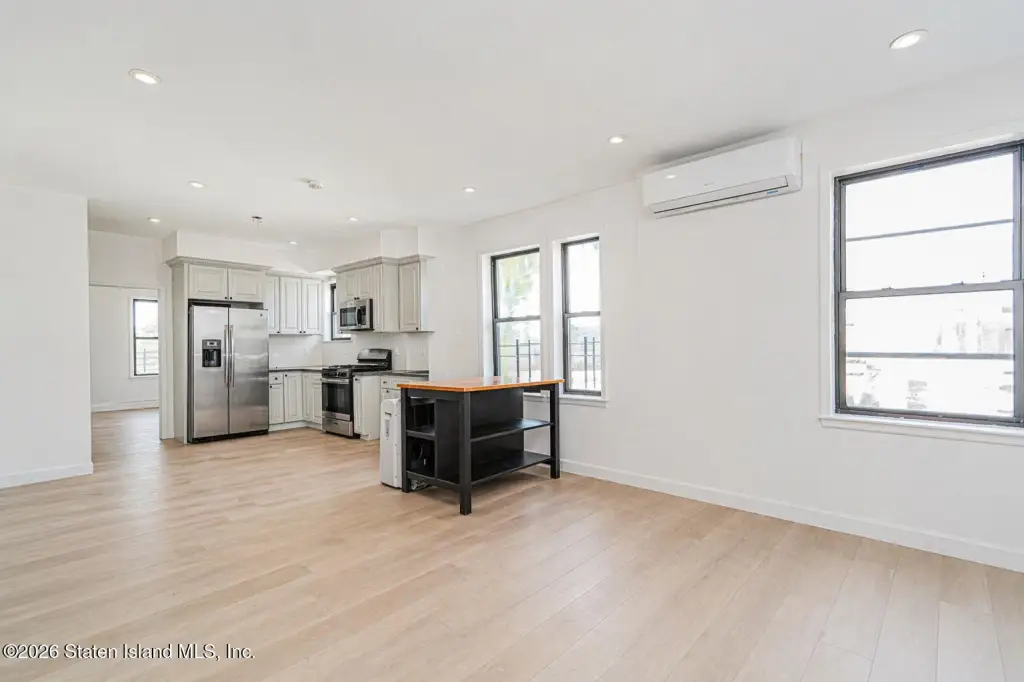
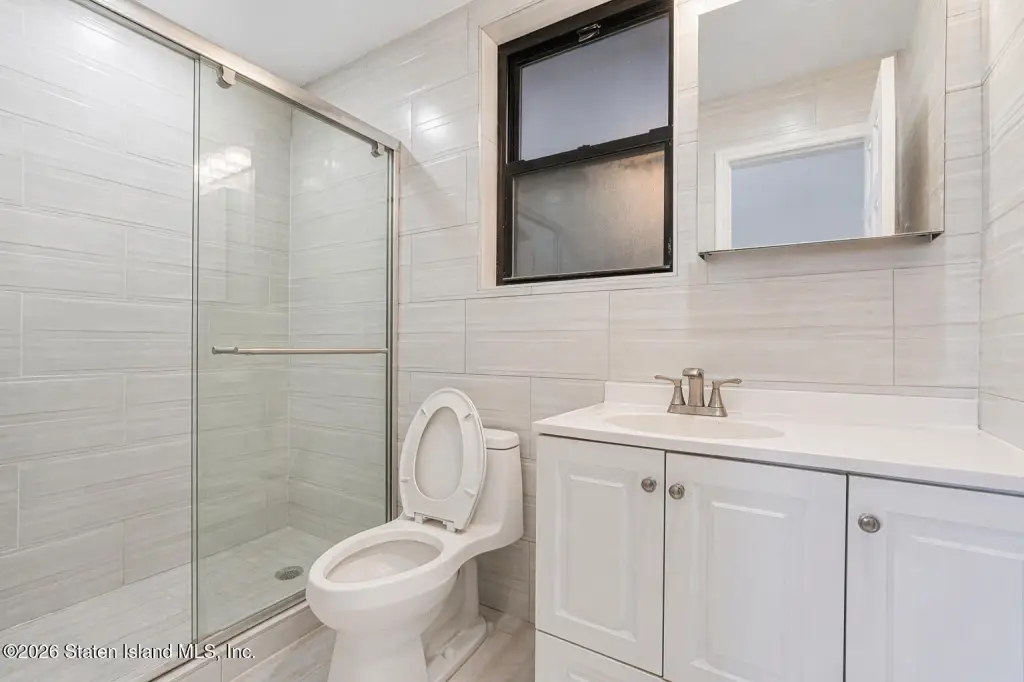
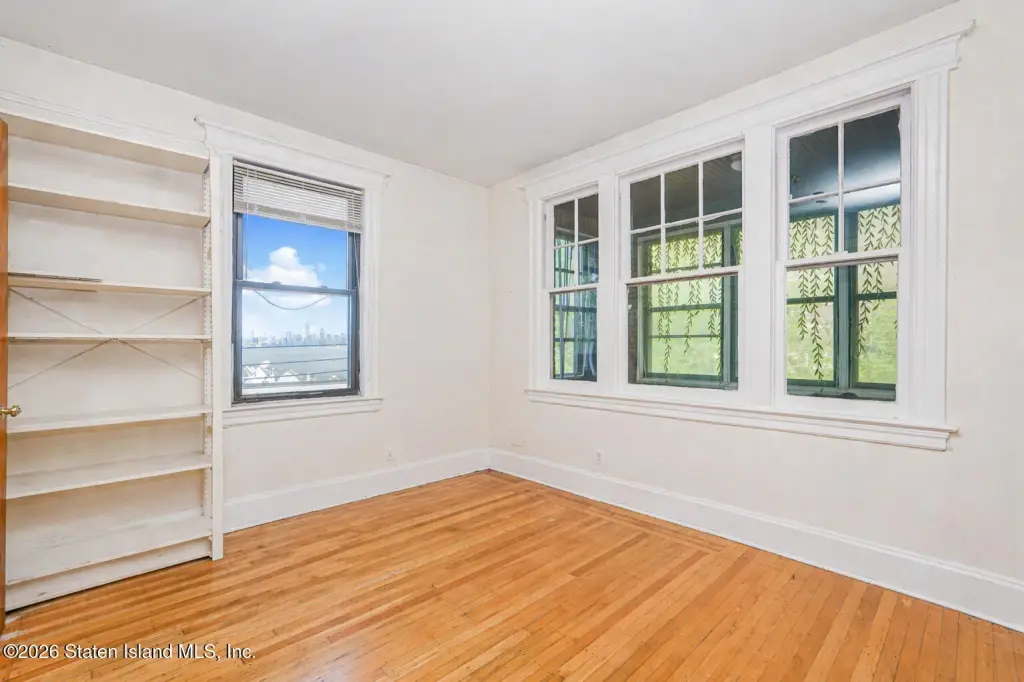
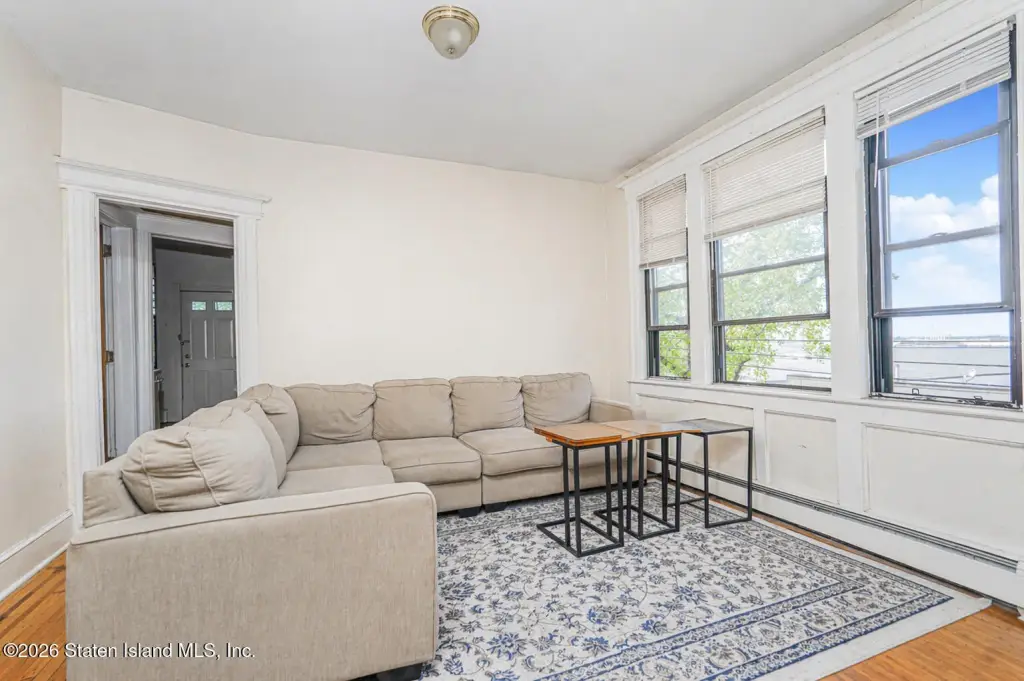
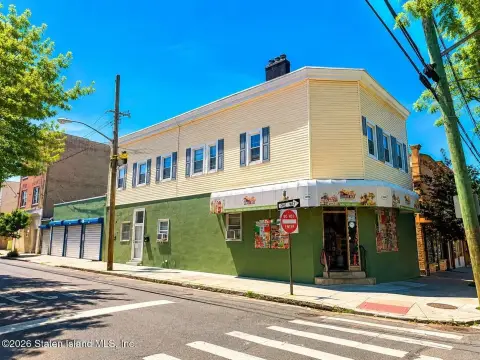
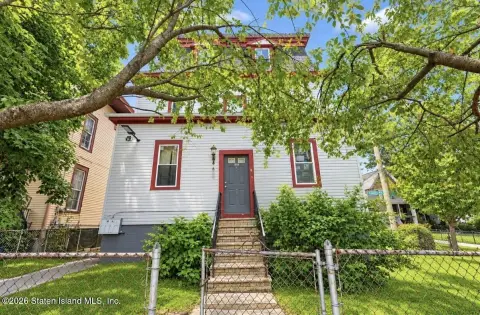
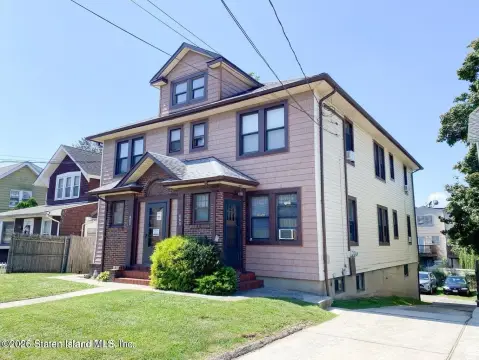
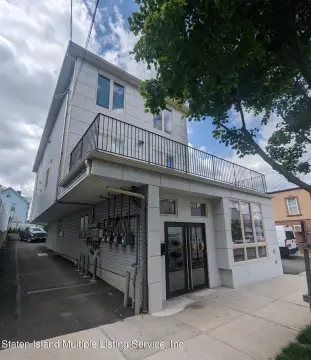
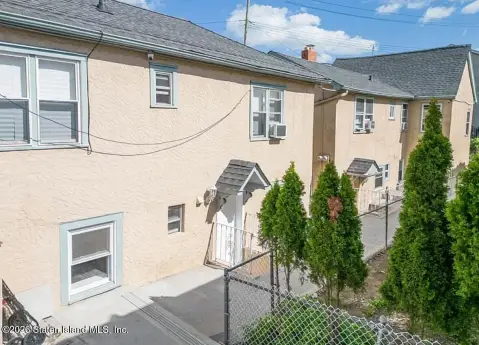
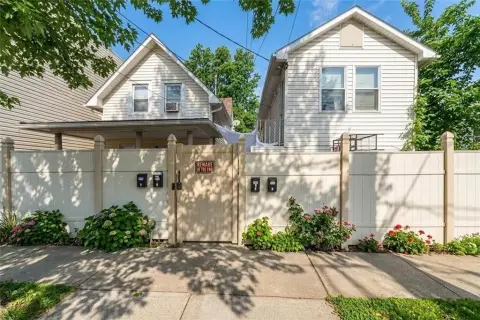
This multifamily property comprises two semi-attached, two-family homes situated on two lots, with four total residential units and 2,829 square feet of property size. Each apartment is arranged with six rooms, including three bedrooms, one full bath, living room, dining room, and kitchen. One building is tenant-occupied on a month-to-month basis, while the other is renovated and vacant with a finished basement. An additional unfinished basement has permits pulled for completion, subject to approvals and buyer verification.
The property includes three garages, on-street parking, a shared backyard, deck, balcony, fenced areas, and brick construction. Built in 1931, it has hot-water heating, natural gas, and public sewer service. R3A zoning is identified in the property information. The address is near the Staten Island Ferry, courthouses, Empire Outlets, restaurants, shopping, and transportation.
The property includes three garages, on-street parking, a shared backyard, deck, balcony, fenced areas, and brick construction. Built in 1931, it has hot-water heating, natural gas, and public sewer service. R3A zoning is identified in the property information. The address is near the Staten Island Ferry, courthouses, Empire Outlets, restaurants, shopping, and transportation.
Key Highlights
- Four total residential units across two semi‑attached, two‑family homes
- 2,829 square feet on 0.1162 acres and two lots
- Three garages plus on‑street parking
Financial Insights
Estimated NOI and Cap Rate
NOI / Yr
$70,352
Cap Rate
4.54%
Suggested Prices Based on Cap Rates
Cap Rate 5%
$1,407,040
$1.4M
Cap Rate 7%
$1,005,029
$1.0M
Cap Rate 9%
$781,689
$781.7K
Market Conditions
NOI Build-Up for 2,829 SF
Gross rent
$105.2K $37.20/SF
− Vacancy
−$4.7K −$1.67/SF
EGI
$100.5K $35.53/SF
− OpEx
−$30.2K −$10.66/SF
NOI
$70.4K $24.87/SF
Area
Staten Island, NY
Vacancy
4.50%
Lease Rate
$37.20 /SF/Yr
Expense Ratio
30.00%
Simulate Cap Rate and NOI
Suggested Prices Based on Cap Rates
Cap Rate 5%
$1,407,040
Cap Rate 7%
$1,005,029
Cap Rate 9%
$781,689
Alternative Uses
Best Use
Multifamily LT 5
$1.01M
$879.4K – $1.17M
NOI $70,352 @ 7.0% cap · market cap 4.54%
Second Best
Apartment 5plus
$896.2K
$784.2K – $1.05M
NOI $62,736 @ 7.0% cap · market cap 4.05%
Theoretical Best
Office A
$1.35M
$1.18M – $1.57M
NOI $94,489 @ 7.0% cap · market cap 6.10%
Zoning and permitted uses should be independently verified with authorities.
How Realmo checks its estimates
Property Analytics
Unlock full access to Insights
Subscribe to Realmo Intelligence
Open Analytics
Current Use
Lease Details
4
Residential units
Multi-tenant
Tenancy
Location Intelligence
Trade Area within ½ mile
995
Businesses Nearby
Explore this area
Business Placement
Demographics for 10301, NY
41,474
Population
16,631
Households
2.5
Avg Household Size
40
Median Age
38%
College-Educated
88%
High-School Grad
3.8 sq mi
ZIP Area
10,914
Density / Sq Mi
$84,937
Median Household Income
$50,140
Median Earnings
$1,697
Median Rent
$657,000
Median Home Value
Check the figures for this property
Cap Rate, Value Estimation, Potential NOI and more
View Realmo Analytics
Market
Vacancy Rate% for Multifamily in Northeast region

Questions? Ask Rey
Realmo’s AI knows this listing — price, zoning, demand, history. Ask anything.

Frequently Asked Questions
What type of property is this?
Quadplex - Two semi-attached residential buildings provide flexible multifamily configuration with shared outdoor space and garage parking.
Where is this quadplex located?
The property is located at 30-32 Nicholas Street Staten Island, NY.
What is the asking price?
The asking price for this property is $1,550,000.
What are key features of this property?
This property features: Four total residential units across two semi‑attached, two‑family homes; 2,829 square feet on 0.1162 acres and two lots; Three garages plus on‑street parking


