Light Manufacturing Multi-Building
For Sale
Contact for pricing
2905 N Lincoln Rd, Escanaba, MI 49829
Multi-building campus with light manufacturing zoning, large overhead doors, and extensive fenced, secure storage.
Property Size37,765 SF
Lot Size9.70 Acres
Price / SF$99.30
Days on Market191
Property Features for 2905 N Lincoln Rd
General Information
Standard status
Active
Size
37,765 SF
Lot size
9.70 Acres
Property subtype
Industrial, Mixed Use
Zoning
F-Light Manufacturing & E-3 Centralized Commercial Business District
Site & Location
Highway Access
Yes
Road Access
Yes
Fenced Yard
Yes
Outdoor Storage
Yes
Building Details
Year Built
1979
Buildings
3
Listing Agency:
RE/MAX 1st Realty
Listed By:
Terry Huffman · License #MI 6506001775
(906) 225-7653
Source:
Crexi
Added: Apr 16
Changed: Oct 5
Last Checked: Oct 23 at 4:54AM
Displayed information is deemed reliable but is not guaranteed and should be independently verified. All listing content including descriptions, pricing, images are the copyrighted material of RE/MAX 1st Realty

Ask AI about this property
Review the available facts, identify missing information and prepare questions for the agent.
Investment Insights
Based on property information with market context.
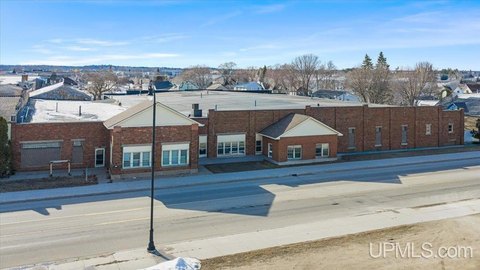
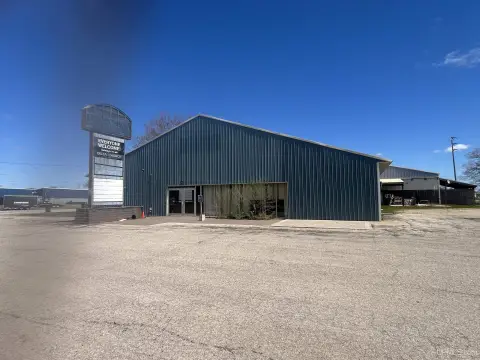
The property is a multi-parcel commercial campus featuring three buildings totaling approximately 37,765 sq ft. The primary building includes office and showroom space, six large overhead garage doors, and additional storage areas. A service building provides a wide-open interior layout with five large garage doors, suitable for operational work or storage. A third building was previously used as a daycare and offers flexible space for reimagining. Infrastructure includes extensive asphalt paving of approximately 180,785 sq ft for parking, staging, and maneuvering, plus rooftop HVAC to support building operations. The site also includes signage and lighting improvements, including one 20-foot sign, one 12-foot sign, and four light poles.
Approximately 6.6 acres front US-41/US-2/N Lincoln Avenue with additional frontage on N 29th Avenue, and the property includes multiple access points with curb cuts along US-41/US-2 and N 29th Avenue. A separate 3-acre parcel across the train tracks provides additional frontage between N 29th Street and N 28th Road and adds development flexibility. The main parcels are zoned F – Light Manufacturing, while the additional parcel is zoned E-3 Central Commercial District.
The additional parcel is fully enclosed with a high-security fence and a keyed gate, supporting secure storage of equipment, inventory, or supplies.
Approximately 6.6 acres front US-41/US-2/N Lincoln Avenue with additional frontage on N 29th Avenue, and the property includes multiple access points with curb cuts along US-41/US-2 and N 29th Avenue. A separate 3-acre parcel across the train tracks provides additional frontage between N 29th Street and N 28th Road and adds development flexibility. The main parcels are zoned F – Light Manufacturing, while the additional parcel is zoned E-3 Central Commercial District.
The additional parcel is fully enclosed with a high-security fence and a keyed gate, supporting secure storage of equipment, inventory, or supplies.
Key Highlights
- 4‑parcel commercial/industrial campus totaling 9.7 acres with 875 ft of frontage on US‑41/US‑2/N Lincoln Ave plus 425 ft on N 29th Ave
- Multiple access points, including 1 curb cut on US‑41/US‑2 and 2 curb cuts on N 29th Ave, for customer and large‑vehicle traffic flow
- Zoned F – Light Manufacturing on the main parcels and E‑3 Central Commercial District on the additional 3‑acre parcel for commercial/industrial flexibility
Financial Insights
Estimated NOI and Cap Rate
NOI / Yr
$283,617
Cap Rate
7.56%
Suggested Prices Based on Cap Rates
Cap Rate 5%
$5,672,340
$5.7M
Cap Rate 7%
$4,051,671
$4.1M
Cap Rate 9%
$3,151,300
$3.2M
Market Conditions
NOI Build-Up for 37,765 SF
Gross rent
$358.0K $9.48/SF
− Vacancy
−$24.3K −$0.64/SF
EGI
$333.7K $8.84/SF
− OpEx
−$50.1K −$1.33/SF
NOI
$283.6K $7.51/SF
Area
Delta County, MI
Vacancy
6.80%
Lease Rate
$9.48 /SF/Yr
Expense Ratio
15.00%
Simulate Cap Rate and NOI
Suggested Prices Based on Cap Rates
Cap Rate 5%
$5,672,340
Cap Rate 7%
$4,051,671
Cap Rate 9%
$3,151,300
Alternative Uses
Best Use
Warehouse
$4.05M
$3.55M – $4.73M
NOI $283,617 @ 7.0% cap · market cap 7.56%
Second Best
Flex RnD
$3.83M
$3.35M – $4.47M
NOI $268,056 @ 7.0% cap · market cap 7.15%
Theoretical Best
Office A
$7.39M
$6.47M – $8.62M
NOI $517,495 @ 7.0% cap · market cap 13.80%
Zoning and permitted uses should be independently verified with authorities.
How Realmo checks its estimates
Property Analytics
Contact the owner directly
Get the owner's phone numbers and email
Open Analytics
Current Use
Lease Details
Yes
Fenced yard
Yes
Highway access
Yes
Paved road access
Location Intelligence
Trade Area within ½ mile
163
Businesses Nearby
Well-served
Demand for This Use
Explore this area
Business Placement
Demographics for 49829, MI
17,009
Population
8,729
Households
1.9
Avg Household Size
45
Median Age
19%
College-Educated
90%
High-School Grad
66.8 sq mi
ZIP Area
255
Density / Sq Mi
$45,808
Median Household Income
$31,366
Median Earnings
$667
Median Rent
$139,000
Median Home Value
Check the figures for this property
Cap Rate, Value Estimation, Potential NOI and more
View Realmo Analytics
Market
Vacancy Rate% for Industrial in Midwest region



Frequently Asked Questions
What type of property is this?
Flex space - Multi-building campus with light manufacturing zoning, large overhead doors, and extensive fenced, secure storage.
Where is this flex space located?
The property is located at 2905 N Lincoln Rd Escanaba, MI.
What is the asking price?
The asking price for this property is $3,750,000.
What are key features of this property?
This property features: 4‑parcel commercial/industrial campus totaling 9.7 acres with 875 ft of frontage on US‑41/US‑2/N Lincoln Ave plus 425 ft on N 29th Ave; Multiple access points, including 1 curb cut on US‑41/US‑2 and 2 curb cuts on N 29th Ave, for customer and large‑vehicle traffic flow; Zoned F – Light Manufacturing on the main parcels and E‑3 Central Commercial District on the additional 3‑acre parcel for commercial/industrial flexibility


