Duplex Townhome
For Sale
Contact for pricing
Pending
2887 SW 33rd Ave, Miami, FL 33133
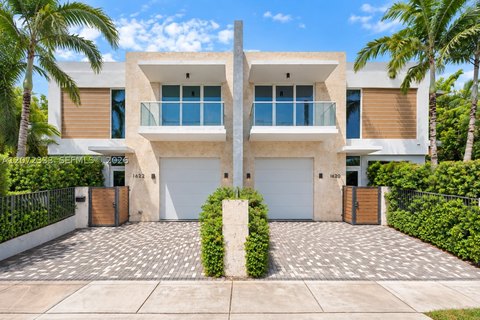
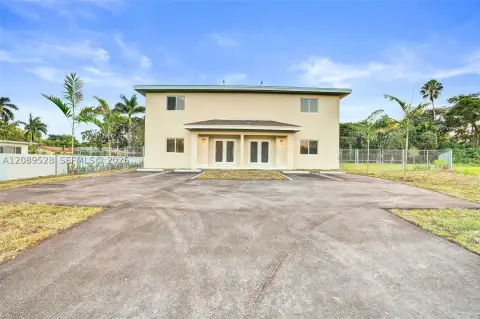
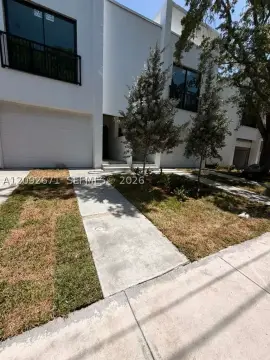
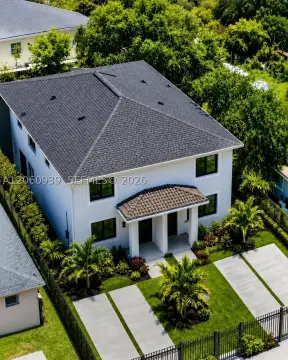
Built in 2020 duplex with two mirror-image townhomes, each featuring enclosed patios and long-term tenant occupancy through 2026.
Property Size5,000 SF
Days on Market149
Property Features for 2887 SW 33rd Ave
General Information
Standard status
Pending
Size
5,000 SF
Total Parking Spaces
8
Property subtype
Multifamily
Zoning
5700
Site & Location
Neighborhood
Douglas Park
Additional Details
Multifamily Units
2
Building Details
Year Built
2020
Stories
2
Units
2
Tenancy
Multi
Listing Agency:
The Beracha Team LLC
Listed By:
Francis Beracha · License #3315360
(305) 798-6300
Source:
Crexi
Added: May 30
Changed: Oct 12
Last Checked: Oct 24 at 3:29PM
Displayed information is deemed reliable but is not guaranteed and should be independently verified. All listing content including descriptions, pricing, images are the copyrighted material of The Beracha Team LLC

Ask AI about this property
Review the available facts, identify missing information and prepare questions for the agent.
Investment Insights
Based on property information with market context.
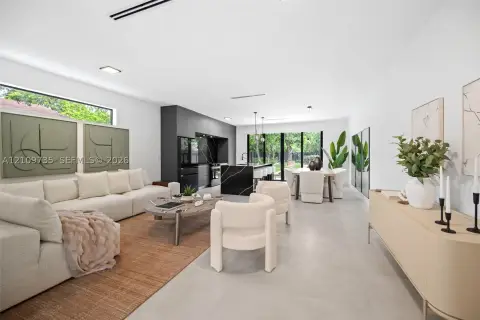
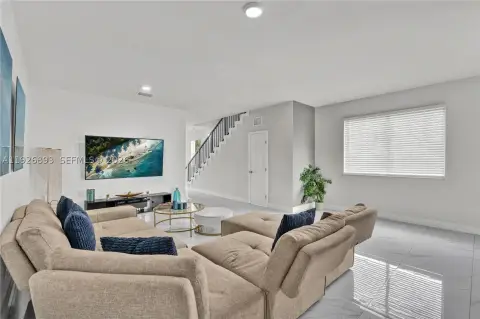
Built in 2020, this duplex property consists of two mirror-image townhomes, each approximately 2,500 square feet. The layout includes four bedrooms and four bathrooms per unit, with three rooms configured as en-suites. Each townhome also offers a kitchen and foyer, along with a laundry room/storage area. Large walk-in closets are included throughout, and each unit features an enclosed patio.
Both units are currently rented through the end of July 2026, with lease-end dates of June 30, 2026 and July 31, 2026. The property includes parking for up to four cars per side, with additional space described on the swale area. Owner does not pay utilities, including water, sewer, trash, or electricity; the owner pays lawn care, pest control, and taxes. The location is described as within walking distance to major stores, Coconut Grove, the Underline, and the new Grove Central, with the address at 2887 SW 33rd Ave, Miami, FL 33133.
This offering is positioned for buyers seeking a residential income duplex with four-bedroom, four-bath configurations and enclosed patios in each unit, supported by established tenant occupancy. Prospective purchasers should be prepared to provide a pre-approval, proof of funds, or 1031 exchange information, along with buyer ID, for showings.
Both units are currently rented through the end of July 2026, with lease-end dates of June 30, 2026 and July 31, 2026. The property includes parking for up to four cars per side, with additional space described on the swale area. Owner does not pay utilities, including water, sewer, trash, or electricity; the owner pays lawn care, pest control, and taxes. The location is described as within walking distance to major stores, Coconut Grove, the Underline, and the new Grove Central, with the address at 2887 SW 33rd Ave, Miami, FL 33133.
This offering is positioned for buyers seeking a residential income duplex with four-bedroom, four-bath configurations and enclosed patios in each unit, supported by established tenant occupancy. Prospective purchasers should be prepared to provide a pre-approval, proof of funds, or 1031 exchange information, along with buyer ID, for showings.
Key Highlights
- Duplex built in 2020 with 2,500 sq. ft on each side (two mirror‑image townhomes).
- Each townhome has 4 bedrooms and 4 bathrooms, with 3 en‑suites plus a laundry room/storage area.
- Enclosed patio in each townhome and large walk‑in closets.
Financial Insights
Estimated NOI and Cap Rate
NOI / Yr
$100,278
Cap Rate
4.02%
Suggested Prices Based on Cap Rates
Cap Rate 5%
$2,005,560
$2.0M
Cap Rate 7%
$1,432,543
$1.4M
Cap Rate 9%
$1,114,200
$1.1M
Market Conditions
NOI Build-Up for 5,000 SF
Gross rent
$153.0K $30.60/SF
− Vacancy
−$9.7K −$1.95/SF
EGI
$143.3K $28.65/SF
− OpEx
−$43.0K −$8.60/SF
NOI
$100.3K $20.06/SF
Area
Miami, FL
Vacancy
6.37%
Lease Rate
$30.60 /SF/Yr
Expense Ratio
30.00%
Simulate Cap Rate and NOI
Suggested Prices Based on Cap Rates
Cap Rate 5%
$2,005,560
Cap Rate 7%
$1,432,543
Cap Rate 9%
$1,114,200
Alternative Uses
Best Use
Multifamily LT 5
$1.43M
$1.25M – $1.67M
NOI $100,278 @ 7.0% cap · market cap 4.02%
Second Best
Apartment 5plus
$1.32M
$1.15M – $1.54M
NOI $92,367 @ 7.0% cap · market cap 3.70%
Theoretical Best
Specialty Retail
$3.38M
$2.95M – $3.94M
NOI $236,252 @ 7.0% cap · market cap 9.47%
Zoning and permitted uses should be independently verified with authorities.
How Realmo checks its estimates
Property Analytics
Who owns this building?
See the owner, sales and loan history
Open Analytics
Lease Details
2
Residential units
Multi-tenant
Tenancy
Location Intelligence
Trade Area within ½ mile
3,873
Businesses Nearby
Explore this area
Business Placement
Demographics for 33133, FL
34,141
Population
17,235
Households
2
Avg Household Size
43
Median Age
62%
College-Educated
95%
High-School Grad
4.2 sq mi
ZIP Area
8,129
Density / Sq Mi
$92,734
Median Household Income
$58,233
Median Earnings
$1,945
Median Rent
$906,800
Median Home Value
Check the figures for this property
Cap Rate, Value Estimation, Potential NOI and more
View Realmo Analytics
Market
Vacancy Rate% for Multifamily in South region





Frequently Asked Questions
What type of property is this?
Duplex - Built in 2020 duplex with two mirror-image townhomes, each featuring enclosed patios and long-term tenant occupancy through 2026.
Where is this duplex located?
The property is located at 2887 SW 33rd Ave Miami, FL.
What is the asking price?
The asking price for this property is $2,495,000.
What are key features of this property?
This property features: Duplex built in 2020 with 2,500 sq. ft on each side (two mirror‑image townhomes).; Each townhome has 4 bedrooms and 4 bathrooms, with 3 en‑suites plus a laundry room/storage area.; Enclosed patio in each townhome and large walk‑in closets.


