Flex Space with Overhead Door
For Sale
$495,000
284 S Colorado Ave, Idaho Falls, ID 83402
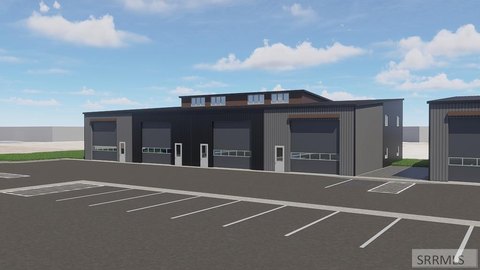
Adaptable commercial building with roughed-in accessible bathrooms and Highway Commercial zoning.
Property Size5,000 SF
Price / SF$99
Days on Market55
Property Features for 284 S Colorado Ave
General Information
Standard status
Active
Size
5,000 SF
Zoning
Highway Commercial
Building Details
Year Built
1984
Listing Agency:
Century 21 High Desert
Listed By:
Kerry Howell · License #23797
(208) 524-2121
Source:
Noplacelikeidaho
Added: Aug 22
Changed: Oct 2
Last Checked: Oct 7 at 1:01PM
Displayed information is deemed reliable but is not guaranteed and should be independently verified. All listing content including descriptions, pricing, images are the copyrighted material of Century 21 High Desert
Investment Insights
Based on property information with market context.
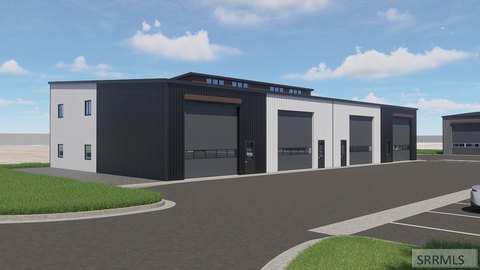
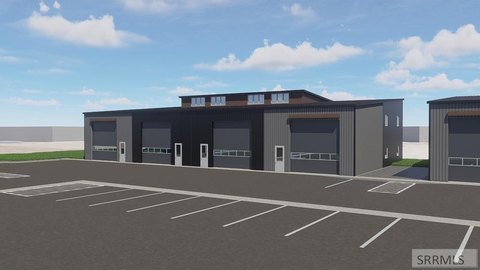
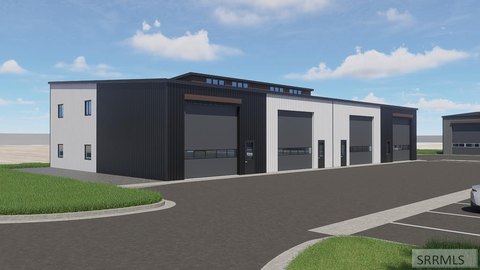
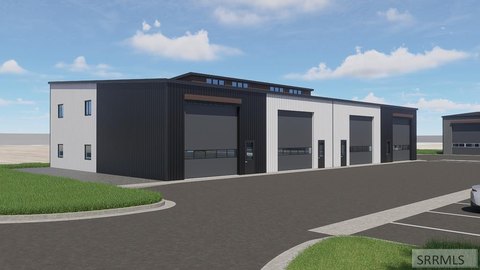
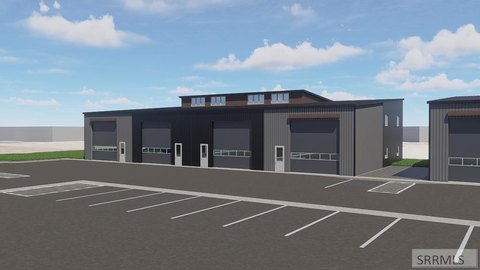
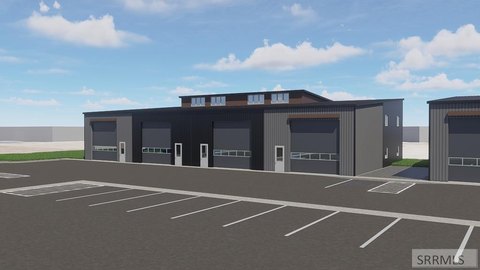
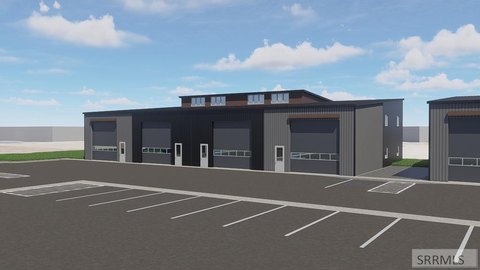
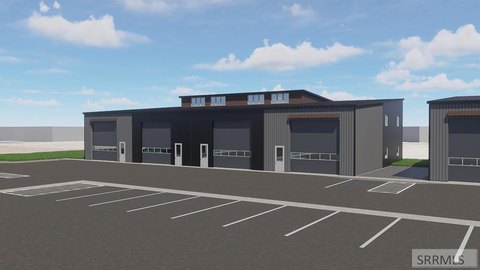
Built in 1984, this 5,000-square-foot commercial building offers an open configuration suited to flex-space use. The property is being offered as-is, with improvements started by the seller. Two overhead-door openings have been created, and handicap bathrooms have been roughed in. The layout may support division into two separate units, subject to applicable requirements.
The property occupies just under 3/4 of an acre on the west side of Idaho Falls at 284 S Colorado Ave. Highway Commercial zoning provides the stated land-use designation for the site.
The property occupies just under 3/4 of an acre on the west side of Idaho Falls at 284 S Colorado Ave. Highway Commercial zoning provides the stated land-use designation for the site.
Key Highlights
- 5,000‑square‑foot commercial building constructed in 1984
- Just under 3/4 of an acre
- Highway Commercial zoning
Financial Insights
Estimated NOI and Cap Rate
NOI / Yr
$30,830
Cap Rate
6.23%
Suggested Prices Based on Cap Rates
Cap Rate 5%
$616,600
$616.6K
Cap Rate 7%
$440,429
$440.4K
Cap Rate 9%
$342,556
$342.6K
Market Conditions
NOI Build-Up for 5,000 SF
Gross rent
$51.0K $10.20/SF
− Vacancy
−$3.6K −$0.71/SF
EGI
$47.4K $9.49/SF
− OpEx
−$16.6K −$3.32/SF
NOI
$30.8K $6.17/SF
Area
Bonneville County, ID
Vacancy
7.00%
Lease Rate
$10.20 /SF/Yr
Expense Ratio
35.00%
Simulate Cap Rate and NOI
Suggested Prices Based on Cap Rates
Cap Rate 5%
$616,600
Cap Rate 7%
$440,429
Cap Rate 9%
$342,556
Alternative Uses
Best Use
Flex RnD
$440.4K
$385.4K – $513.8K
NOI $30,830 @ 7.0% cap · market cap 6.23%
Second Best
Industrial
$294.0K
$257.3K – $343.0K
NOI $20,580 @ 7.0% cap · market cap 4.16%
Theoretical Best
Office A
$1.10M
$966.6K – $1.29M
NOI $77,328 @ 7.0% cap · market cap 15.62%
Zoning and permitted uses should be independently verified with authorities.
How Realmo checks its estimates
Property Analytics
Unlock full access to Insights
Subscribe to Realmo Intelligence
Open Analytics
Current Use
Location Intelligence
Trade Area within ½ mile
708
Businesses Nearby
Balanced
Demand for This Use
Explore this area
Business Placement
Demographics for 83402, ID
28,452
Population
11,983
Households
2.4
Avg Household Size
34
Median Age
31%
College-Educated
92%
High-School Grad
171.0 sq mi
ZIP Area
166
Density / Sq Mi
$72,064
Median Household Income
$35,593
Median Earnings
$904
Median Rent
$301,400
Median Home Value
Check the figures for this property
Cap Rate, Value Estimation, Potential NOI and more
View Realmo Analytics
Market
Vacancy Rate% for Industrial in West region

Questions? Ask Rey
Realmo’s AI knows this listing — price, zoning, demand, history. Ask anything.

Similar Off Market Nearby
- Firehouse Subs Utah Avenue — 435 S Utah Ave, Idaho Falls, ID 83402
- Mama Fla The Authentic Italian Cuisine — back of the building, 385 River Pkwy, Idaho Falls, ID 83402
Frequently Asked Questions
What type of property is this?
Flex space - Adaptable commercial building with roughed-in accessible bathrooms and Highway Commercial zoning.
Where is this flex space located?
The property is located at 284 S Colorado Ave Idaho Falls, ID.
What is the asking price?
The asking price for this property is $495,000.
What are key features of this property?
This property features: 5,000‑square‑foot commercial building constructed in 1984; Just under 3/4 of an acre; Highway Commercial zoning