High-Visibility Office
For Sale
$1,240,000
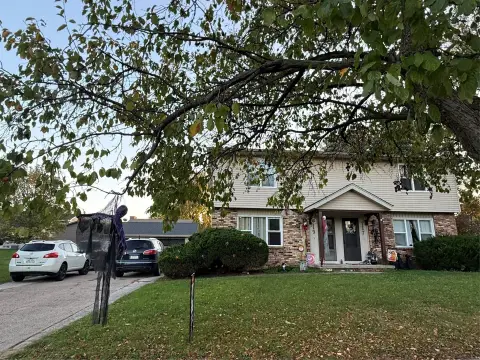
2805 South Ankeny Boulevard, Ankeny, IA 50023
Turnkey office property with access to South Ankeny Boulevard, Oralabor Road, and Interstate 35.
Property Size4,106 SF
Price / SF$301
Days on Market48
Property Features for 2805 South Ankeny Boulevard
General Information
Standard status
Active
Size
4,106 SF
Property subtype
Retail
Site & Location
Highway Access
Yes
Road Access
Yes
Listing Agency:
CBRE - Des Moines
Listed By:
Ajdin Nadarevic · License #F03815000
(515) 415-6114
Source:
Cbre
Added: Sep 6
Changed: Oct 21
Last Checked: Oct 20 at 7:17PM
Displayed information is deemed reliable but is not guaranteed and should be independently verified. All listing content including descriptions, pricing, images are the copyrighted material of CBRE - Des Moines

Ask AI about this property
Review the available facts, identify missing information and prepare questions for the agent.
Investment Insights
Based on property information with market context.
This office building is positioned for office, financial, and professional service uses. The property is described as turnkey and offers a prominent presence along South Ankeny Boulevard, a commercial corridor serving retail, dining, medical, and professional service destinations.
Access is available from South Ankeny Boulevard and Oralabor Road, with Interstate 35 nearby. The location provides exposure along a heavily traveled commercial route in Ankeny, supporting convenient connections to surrounding commercial activity and regional transportation.
Access is available from South Ankeny Boulevard and Oralabor Road, with Interstate 35 nearby. The location provides exposure along a heavily traveled commercial route in Ankeny, supporting convenient connections to surrounding commercial activity and regional transportation.
Key Highlights
- Office building suited to office, financial, and professional service uses
- Prominent position along South Ankeny Boulevard
- Access to South Ankeny Boulevard, Oralabor Road, and Interstate 35
Financial Insights
Estimated NOI and Cap Rate
NOI / Yr
$54,101
Cap Rate
4.36%
Suggested Prices Based on Cap Rates
Cap Rate 5%
$1,082,020
$1.1M
Cap Rate 7%
$772,871
$772.9K
Cap Rate 9%
$601,122
$601.1K
Market Conditions
NOI Build-Up for 4,106 SF
Gross rent
$90.2K $21.96/SF
− Vacancy
−$18.0K −$4.39/SF
EGI
$72.1K $17.57/SF
− OpEx
−$18.0K −$4.39/SF
NOI
$54.1K $13.18/SF
Area
Polk County, IA
Vacancy
20.00%
Lease Rate
$21.96 /SF/Yr
Expense Ratio
25.00%
Simulate Cap Rate and NOI
Suggested Prices Based on Cap Rates
Cap Rate 5%
$1,082,020
Cap Rate 7%
$772,871
Cap Rate 9%
$601,122
Alternative Uses
Best Use
Office B
$772.9K
$676.3K – $901.7K
NOI $54,101 @ 7.0% cap · market cap 4.36%
Second Best
Specialty Retail
$748.3K
$654.8K – $873.0K
NOI $52,382 @ 7.0% cap · market cap 4.22%
Theoretical Best
Flex RnD
$3.95M
$3.46M – $4.61M
NOI $276,679 @ 7.0% cap · market cap 22.31%
Zoning and permitted uses should be independently verified with authorities.
How Realmo checks its estimates
Property Analytics
Who owns this building?
See the owner, sales and loan history
Open Analytics
Current Use
Lease Details
Yes
Highway access
Yes
Paved road access
Location Intelligence
Trade Area within ½ mile
252
Businesses Nearby
Explore this area
Business Placement
Demographics for 50023, IA
43,603
Population
17,822
Households
2.4
Avg Household Size
34
Median Age
55%
College-Educated
99%
High-School Grad
21.0 sq mi
ZIP Area
2,076
Density / Sq Mi
$113,914
Median Household Income
$59,891
Median Earnings
$1,191
Median Rent
$327,200
Median Home Value
Check the figures for this property
Cap Rate, Value Estimation, Potential NOI and more
View Realmo Analytics
Market
Vacancy Rate% for Office in Midwest region






Frequently Asked Questions
What type of property is this?
Office building - Turnkey office property with access to South Ankeny Boulevard, Oralabor Road, and Interstate 35.
Where is this office building located?
The property is located at 2805 South Ankeny Boulevard Ankeny, IA.
What is the asking price?
The asking price for this property is $1,240,000.
What are key features of this property?
This property features: Office building suited to office, financial, and professional service uses; Prominent position along South Ankeny Boulevard; Access to South Ankeny Boulevard, Oralabor Road, and Interstate 35


