Six-Unit Mixed-Use
For Sale
$1,050,000
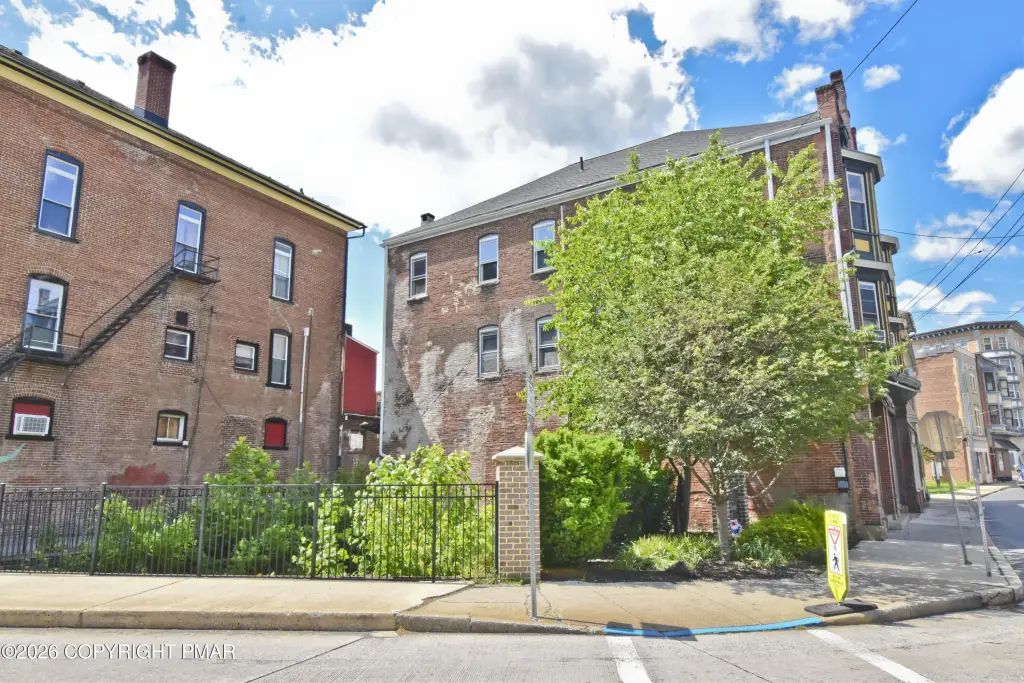
28 S Main Street, Bangor, PA 18013
Residential Income, Bangor, PA
Property Size9,221 SF
Lot Size0.06 Acres
Price / SF$113.87
Days on Market138
Property Features for 28 S Main Street
General Information
Property type
Residential Multi Family
Property subtype
Other
Zoning
GB
Zoning description
Commercial
Bedrooms
15
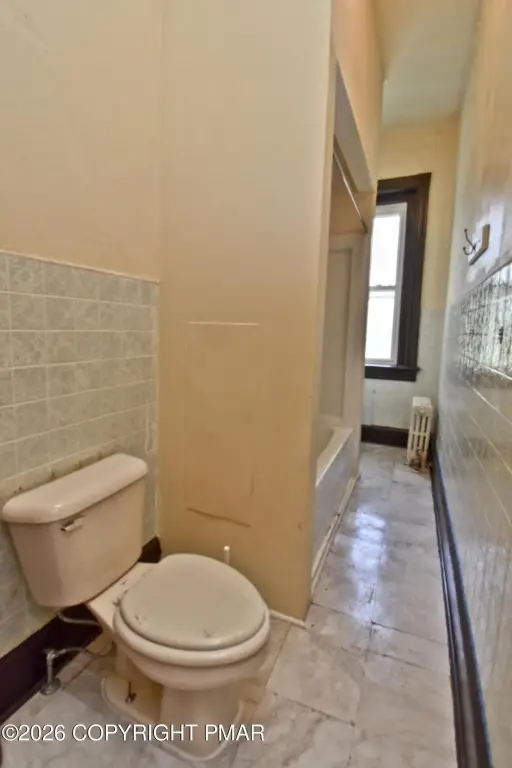
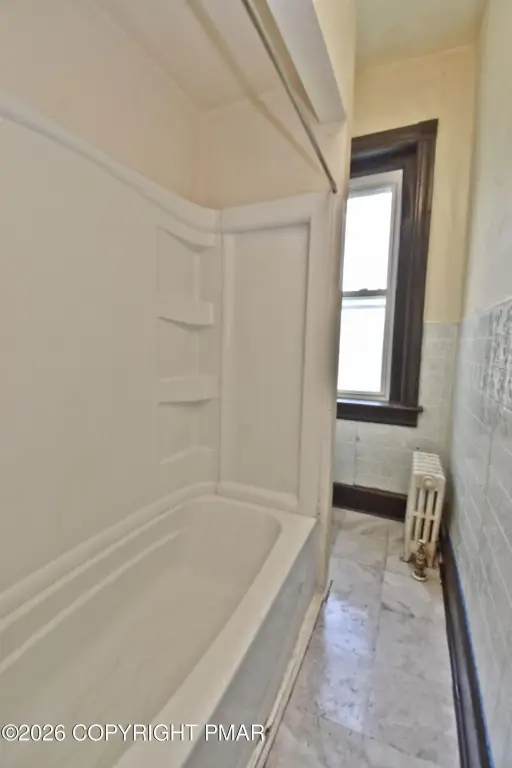
Bathrooms
5
Full bathrooms
6
Half bathrooms
2
Rooms
Bedroom 12, Bathroom 3, Bathroom 5, Bedroom 10, Bedroom 14, Bathroom 4, Bathroom 6, Bedroom 1, Bedroom 15, Bathroom 1, Bathroom 2, Bedroom 8, Bedroom 13, Basement, Bedroom 7, Bedroom 6, Bedroom 9, Bedroom 2, Bedroom 3, Bedroom 5, Bedroom 4, Bedroom 11
Window features
Insulated Windows
Interior features
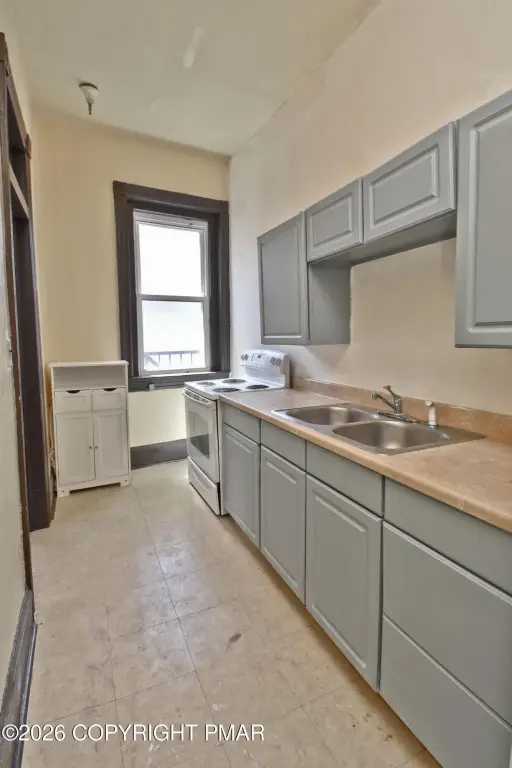
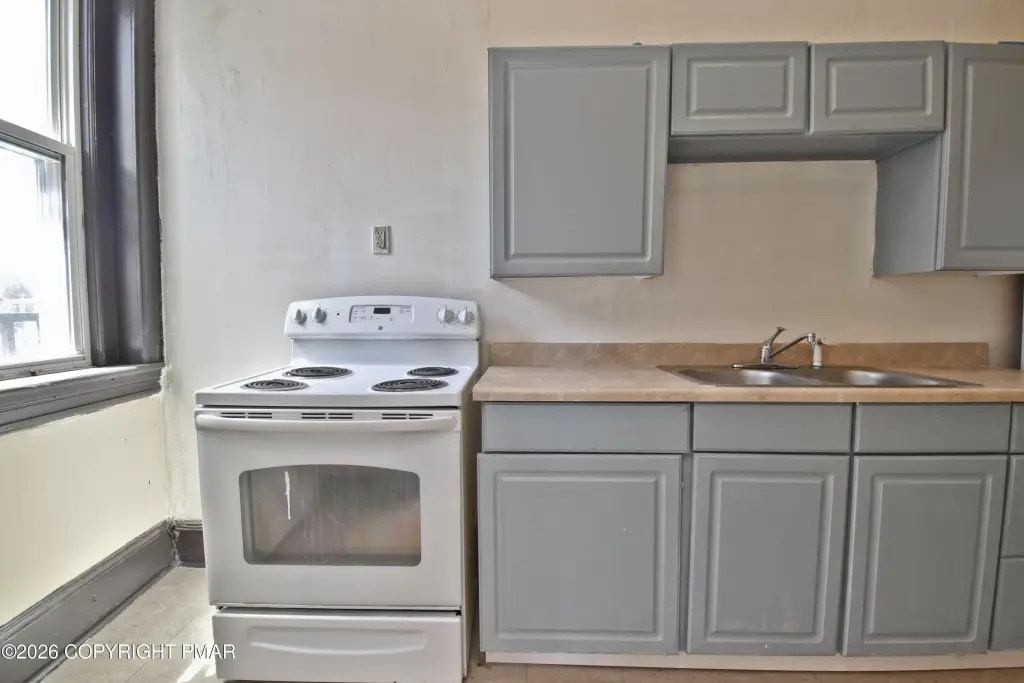
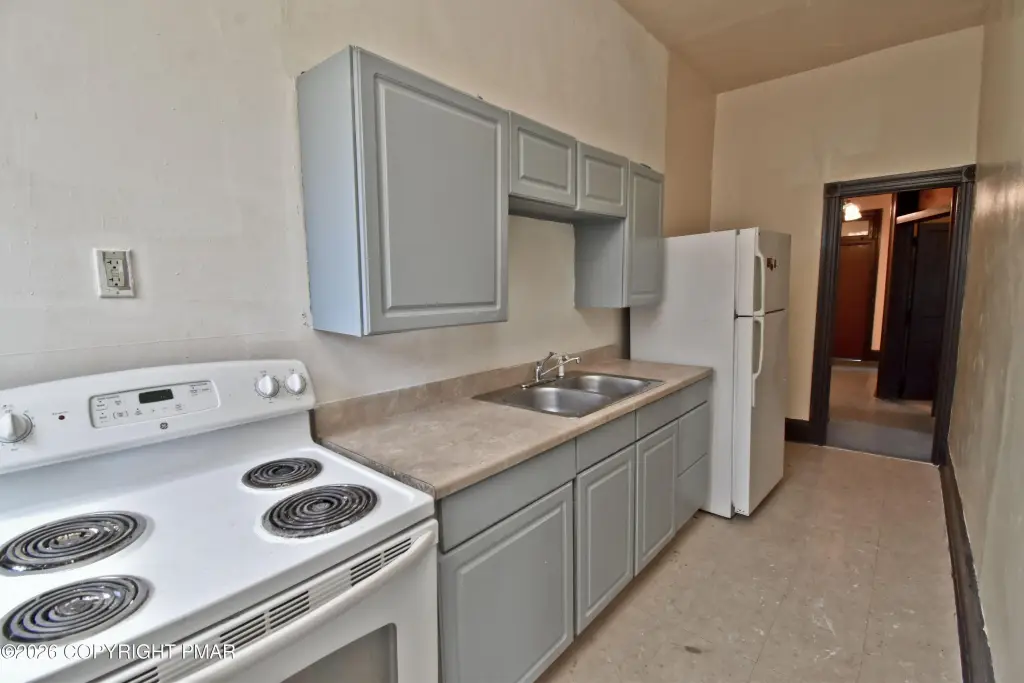
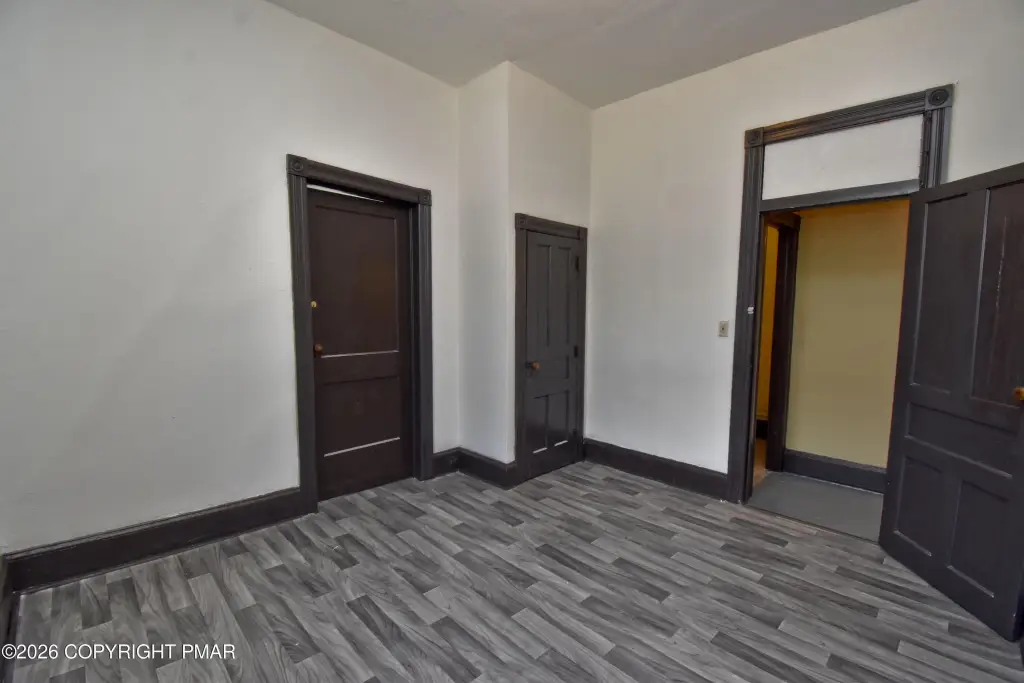
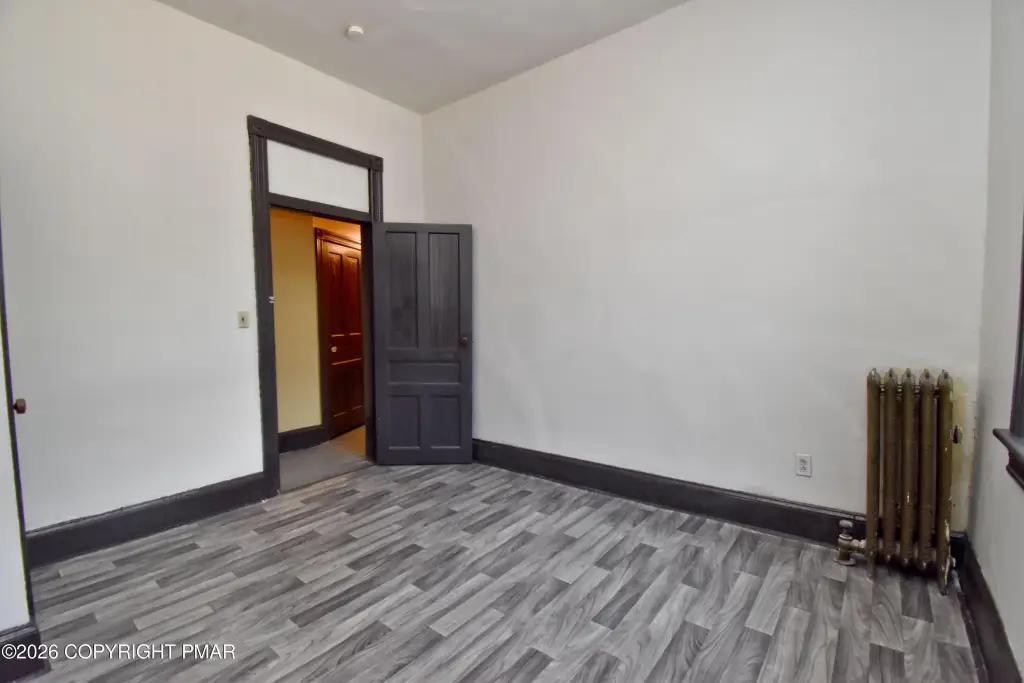
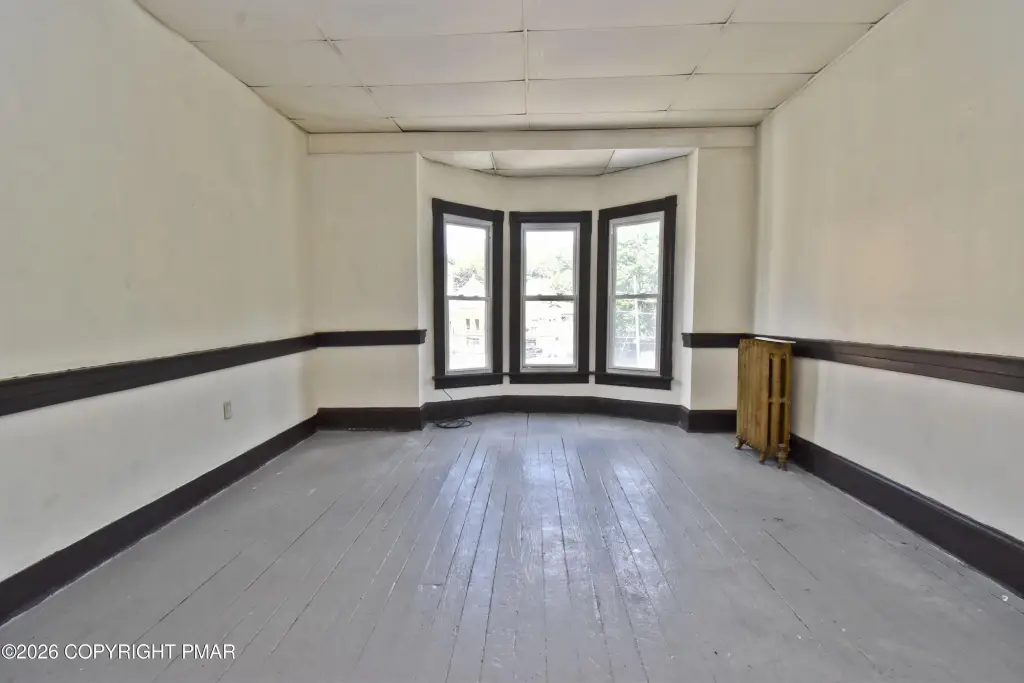
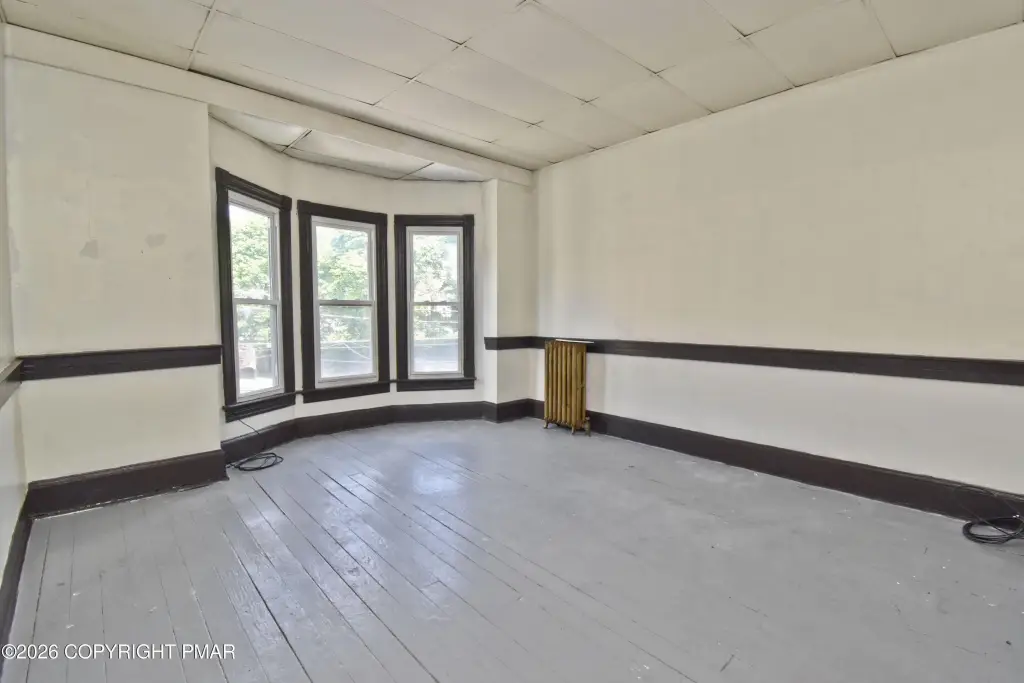
Eat-in Kitchen, Laminate Counters, High Ceilings, Ceiling Fan(s)
Basement
Concrete, Unfinished, Full
Appliances
Electric Range, Refrigerator
Elementary school district
Bangor Area
Middle school district
Bangor Area
High school district
Bangor Area
Subdivision
Bangor Borough
Standard status
Active
APN
E9NE2D 7 12 0102
Size
9,221 SF
Lot size
0.06 Acres
Taxes and HOA fees
Tax Year
2026
Tax Annual Amount
5818
Utilities
Utilities
Cable Available
Sewer type
Public Sewer
Heating system
Steam, Natural Gas
Cooling system
Ceiling Fan(s)
Water source
Public
Building Details
Year built
1907
Floors in Building
3
Number of units
6
Flooring type
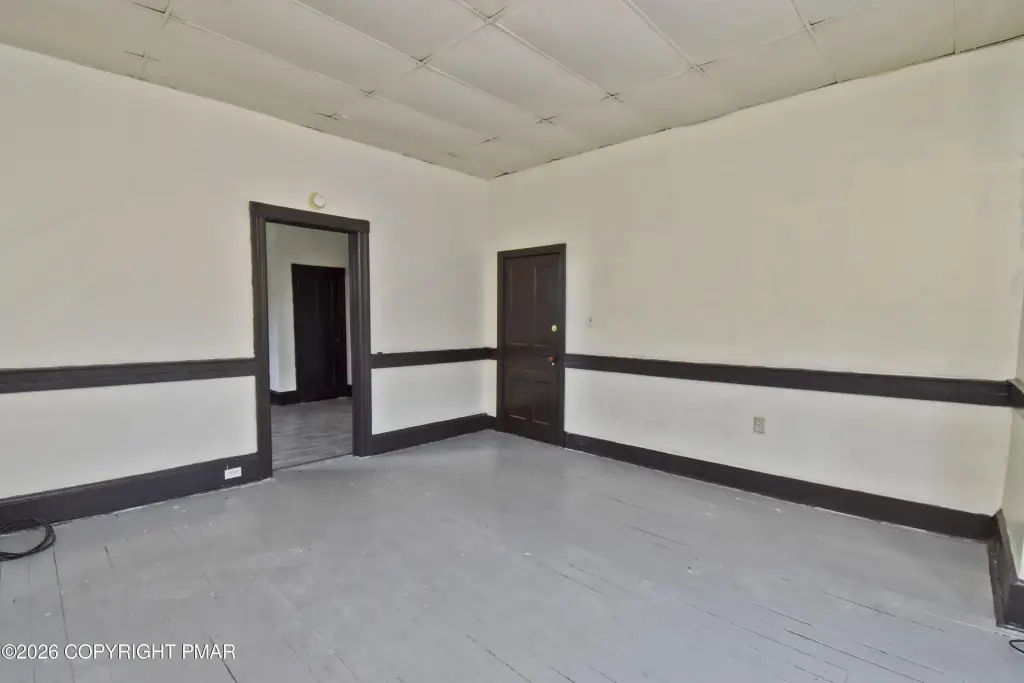
Hardwood, Laminate, Vinyl
Building materials
Brick, Frame, Steel Frame
Roof type
Shingle
Listing Agency:
Keller Williams Real Estate - Stroudsburg 803 Main · Keller Williams Realty
(570) 213-4888
Listed By:
James Galligan
(570) 421-2890
Added: Jun 5
Changed: Oct 16
Last Checked: Oct 20 at 6:06PM
MLS# PM-141940
Copyright © 2026 Pocono Mountains Association of Realtors. All rights reserved. All information provided by the listing agent/broker is deemed reliable but is not guaranteed and should be independently verified.

Ask AI about this property
Review the available facts, identify missing information and prepare questions for the agent.
Investment Insights
Based on property information with market context.
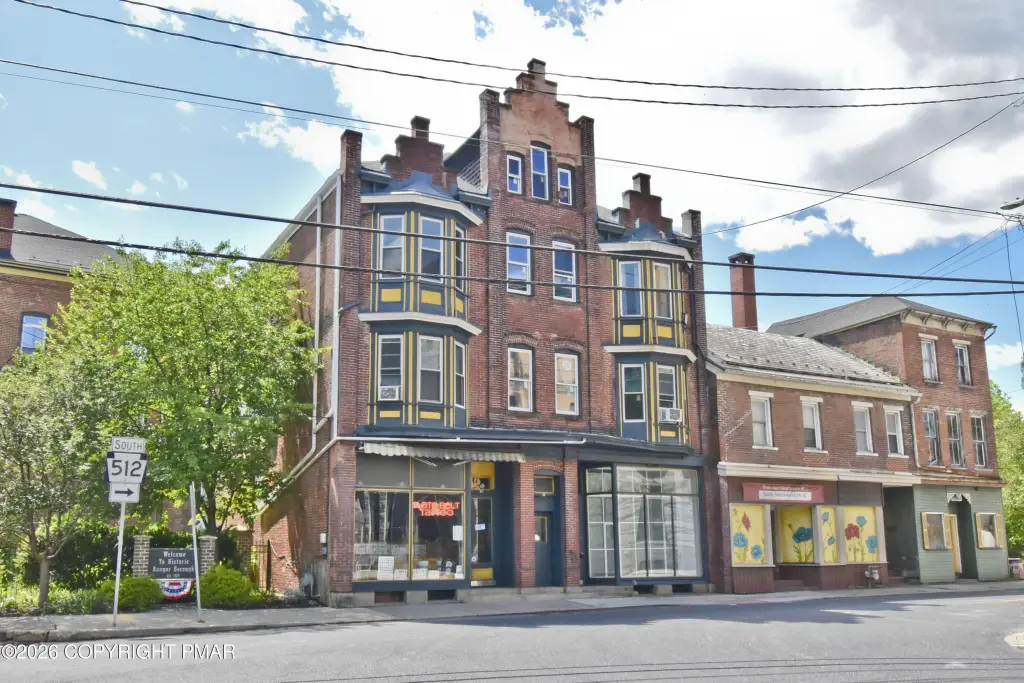
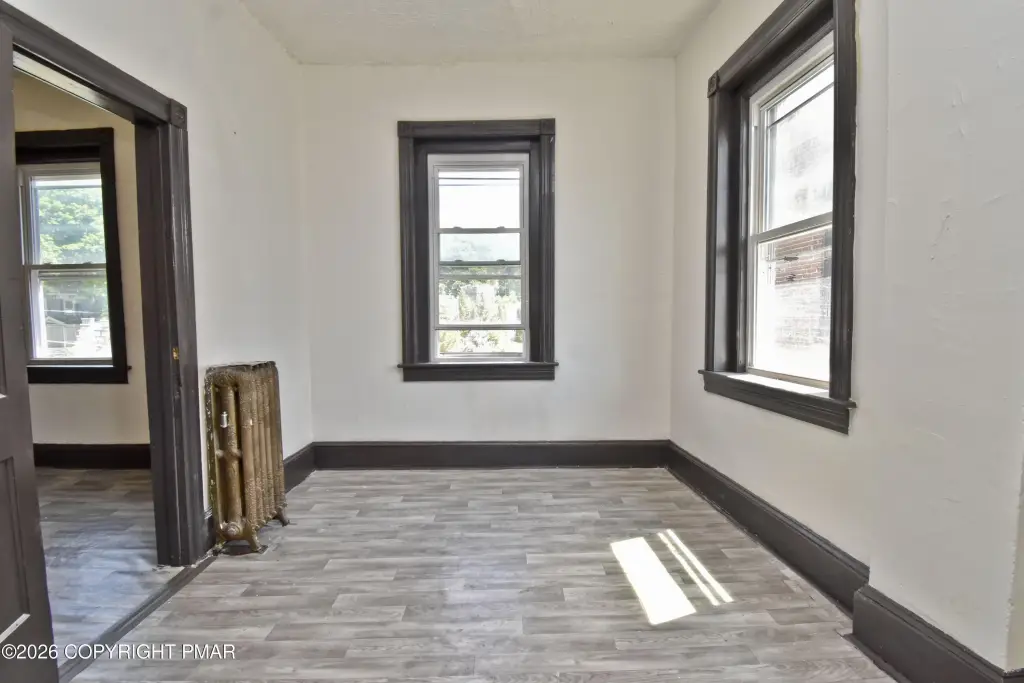
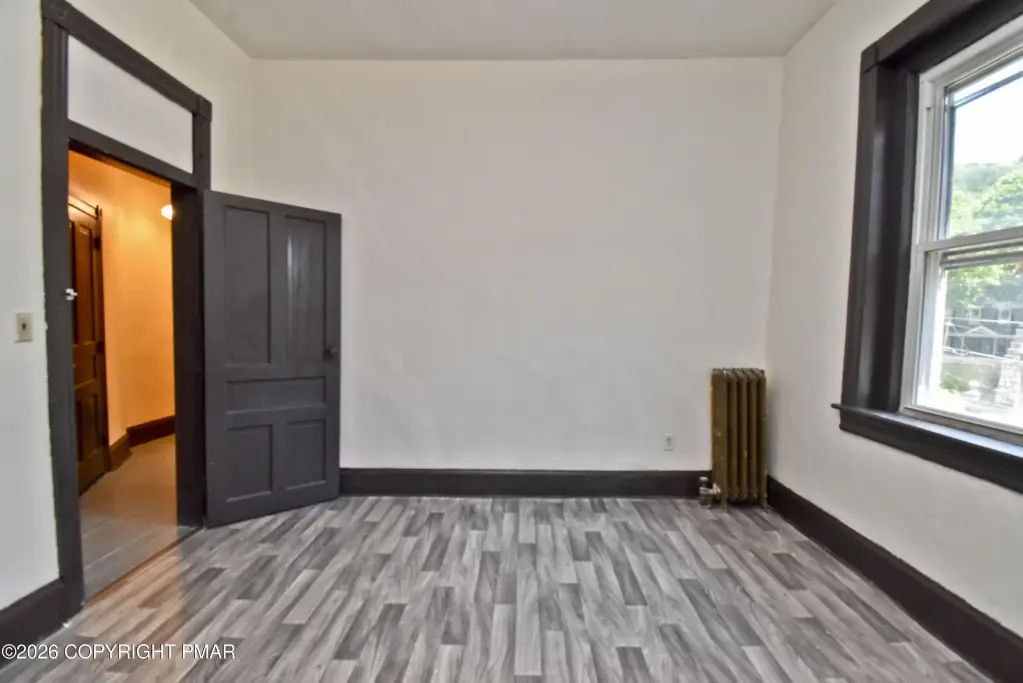
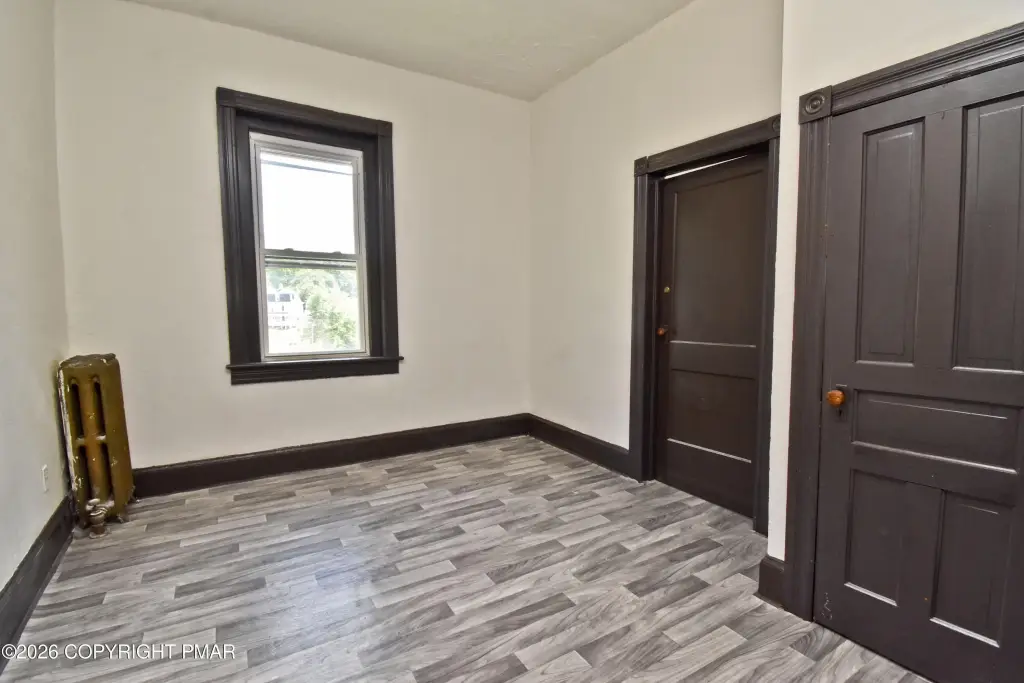
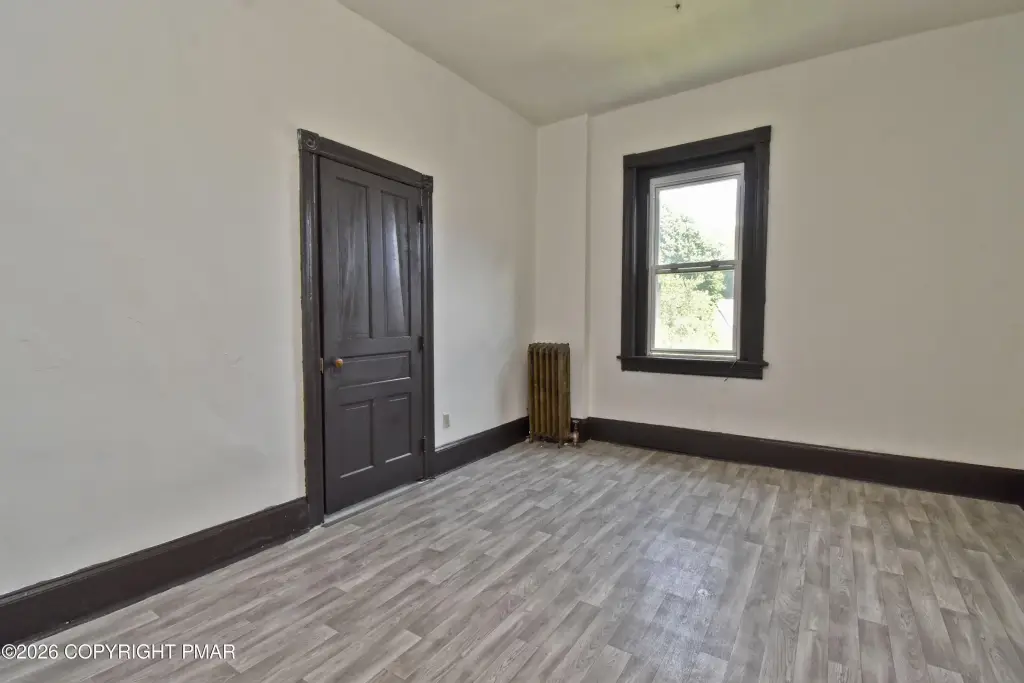
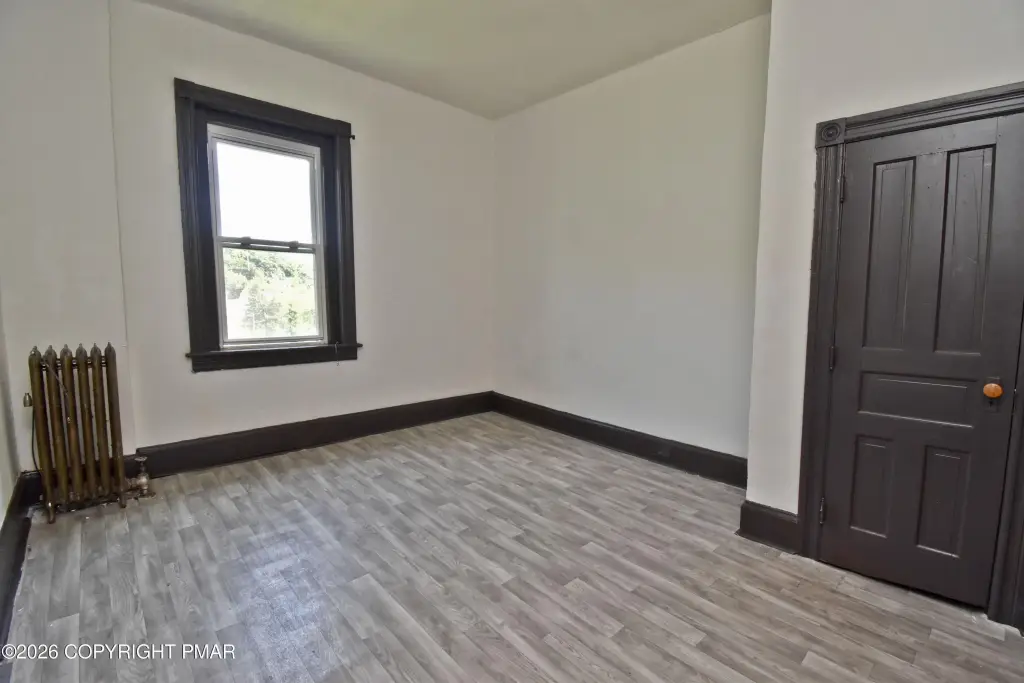
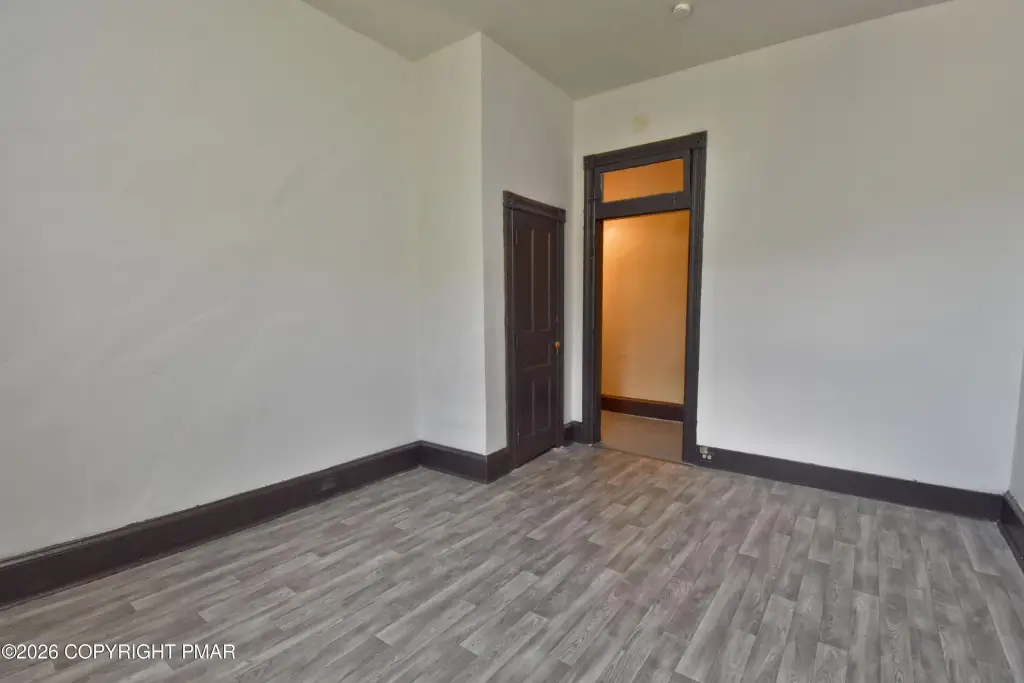
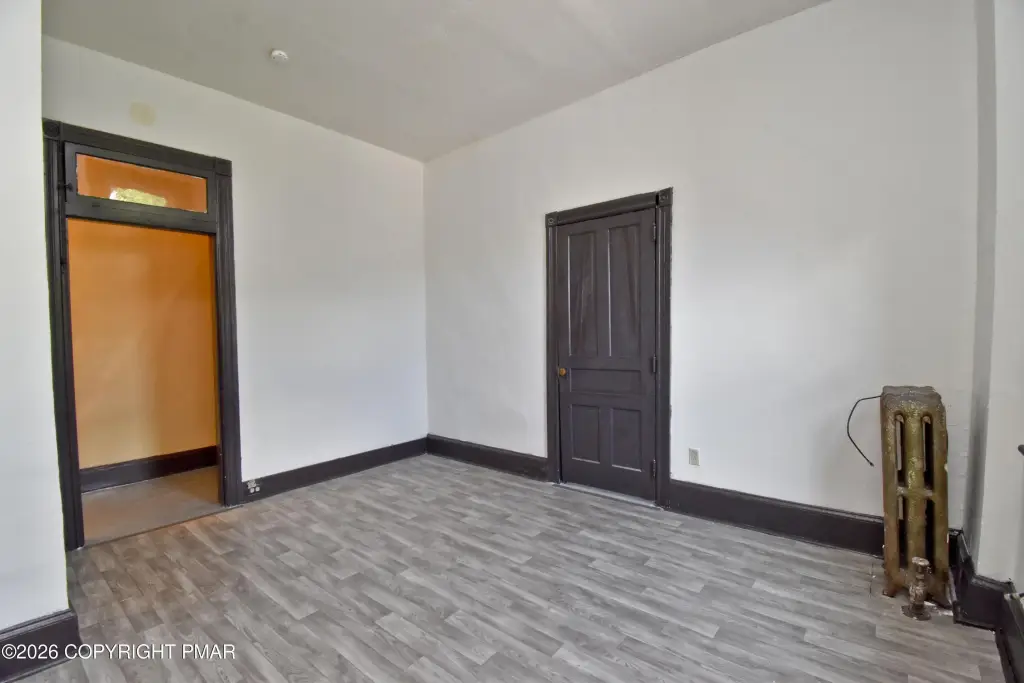
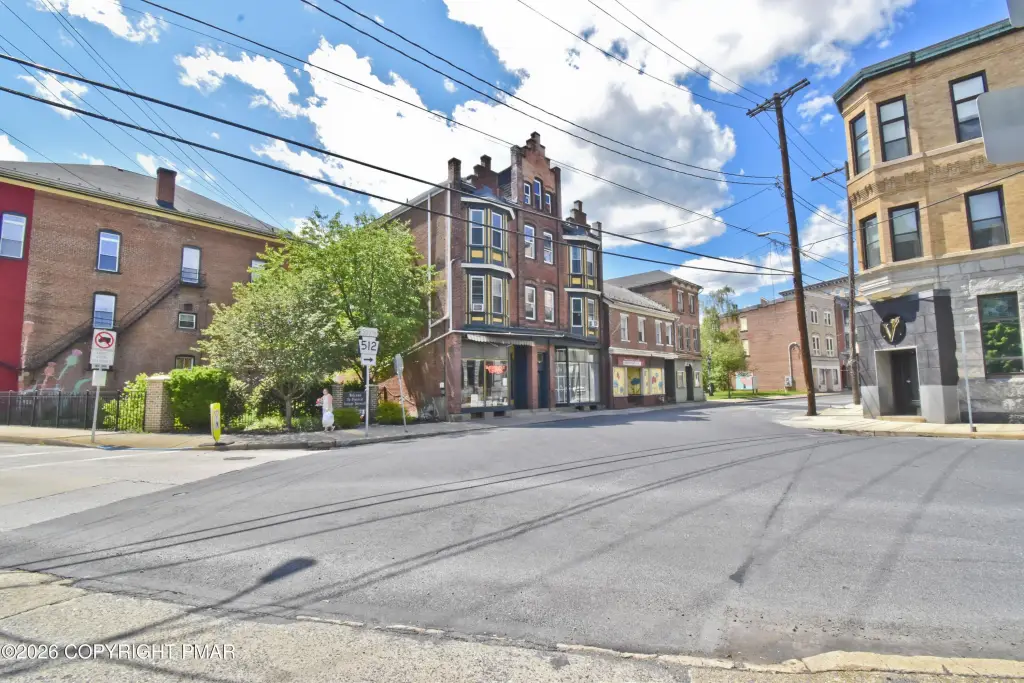
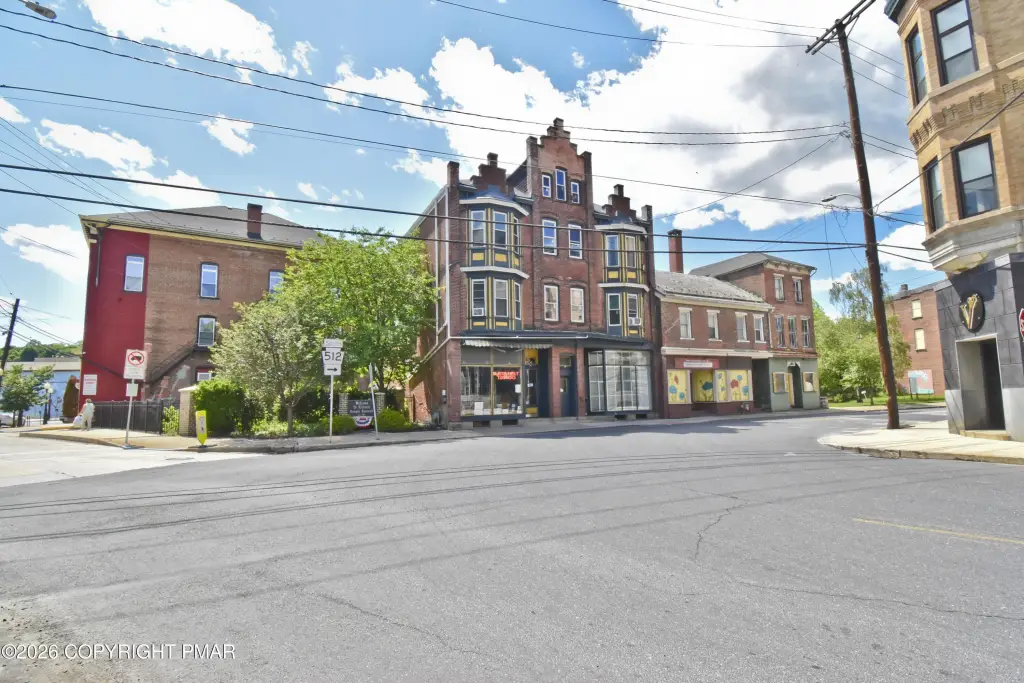
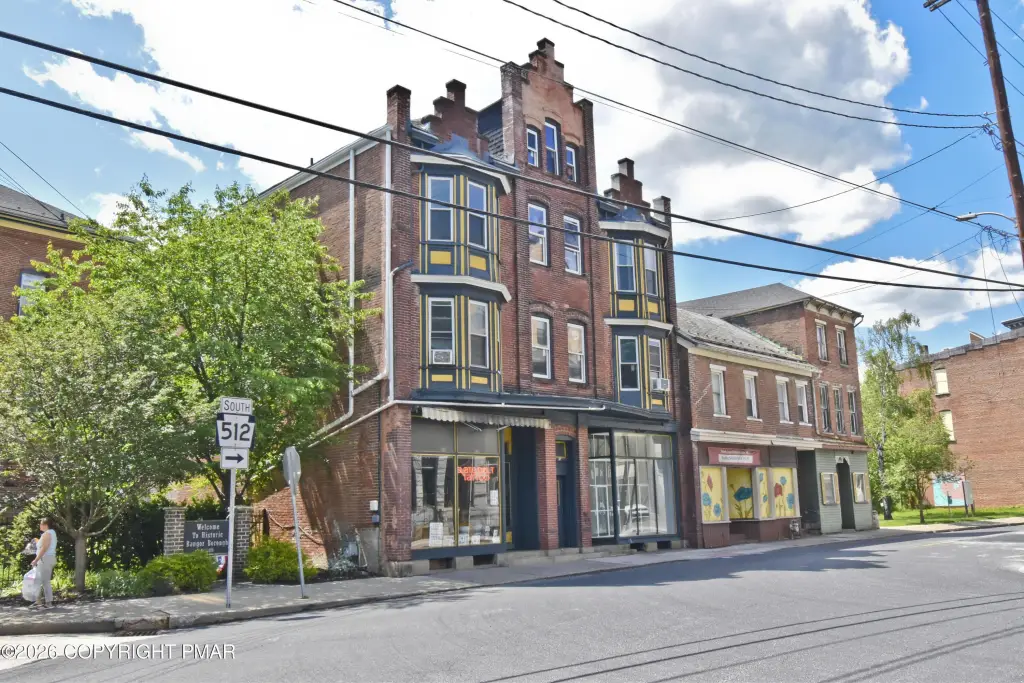
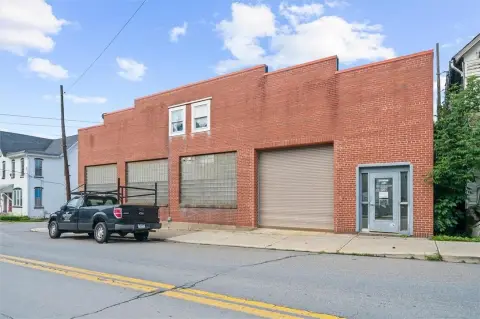
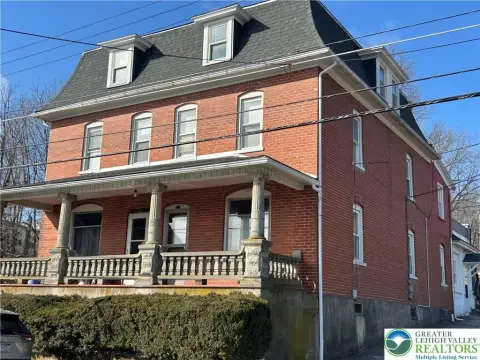
Built in 1907, this 9,221-square-foot mixed-use property contains six income-producing units: two commercial spaces at street level and four three-bedroom apartments on the upper floors. The building includes brick, frame, and steel-frame construction, along with high ceilings, hardwood, laminate and vinyl flooring, public water and sewer, and natural gas steam heat. A walk-up fourth floor provides additional building area for future planning.
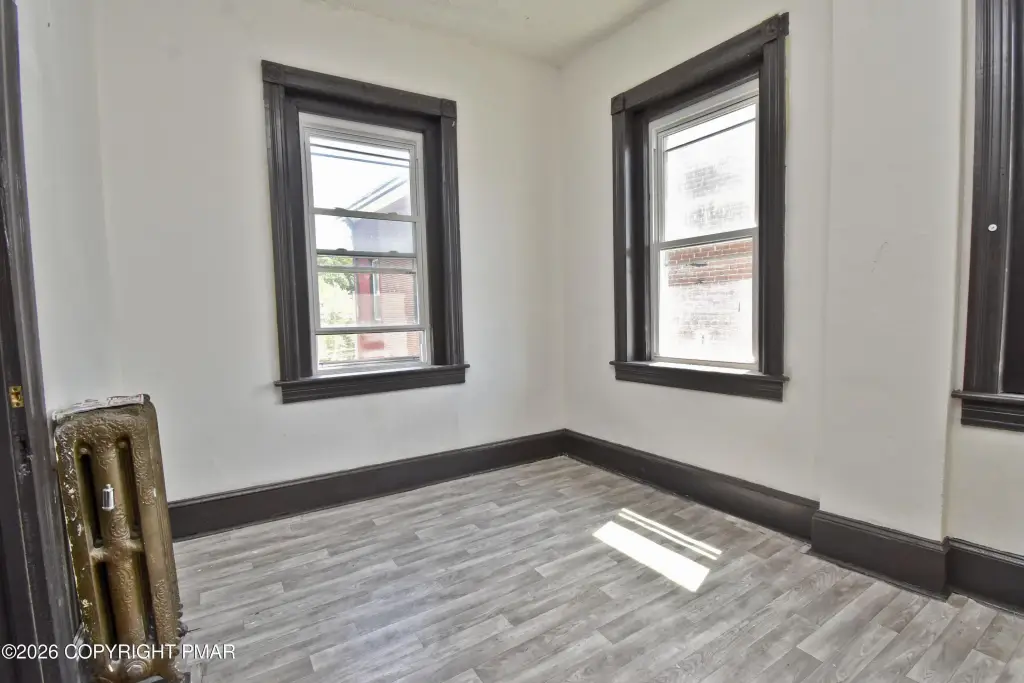
Located at 28 S Main Street in downtown Bangor, the property is surrounded by local businesses, restaurants, and community events. Commercial zoning is designated GB. Recent capital work includes a shingle roof installed in 2022, a natural gas boiler added in 2025, electrical updates, and newer windows throughout. Interior features include eat-in kitchens, laminate counters, ceiling fans, electric ranges, and refrigerators.
Located at 28 S Main Street in downtown Bangor, the property is surrounded by local businesses, restaurants, and community events. Commercial zoning is designated GB. Recent capital work includes a shingle roof installed in 2022, a natural gas boiler added in 2025, electrical updates, and newer windows throughout. Interior features include eat-in kitchens, laminate counters, ceiling fans, electric ranges, and refrigerators.
Key Highlights
- 9,221‑square‑foot mixed‑use building on 0.06 acres
- Six income‑producing units: 2 commercial spaces and 4 three‑bedroom apartments
- GB zoning at 28 S Main Street in downtown Bangor
Financial Insights
Estimated NOI and Cap Rate
NOI / Yr
$93,363
Cap Rate
8.89%
Suggested Prices Based on Cap Rates
Cap Rate 5%
$1,867,260
$1.9M
Cap Rate 7%
$1,333,757
$1.3M
Cap Rate 9%
$1,037,367
$1.0M
Market Conditions
NOI Build-Up for 9,221 SF
Gross rent
$166.0K $18.00/SF
− Vacancy
−$16.6K −$1.80/SF
EGI
$149.4K $16.20/SF
− OpEx
−$56.0K −$6.07/SF
NOI
$93.4K $10.13/SF
Area
Northampton County, PA
Vacancy
10.00%
Lease Rate
$18.00 /SF/Yr
Expense Ratio
37.50%
Simulate Cap Rate and NOI
Suggested Prices Based on Cap Rates
Cap Rate 5%
$1,867,260
Cap Rate 7%
$1,333,757
Cap Rate 9%
$1,037,367
Alternative Uses
Best Use
Mixed Use
$1.33M
$1.17M – $1.56M
NOI $93,363 @ 7.0% cap · market cap 8.89%
Second Best
Retail
$1.02M
$892.7K – $1.19M
NOI $71,415 @ 7.0% cap · market cap 6.80%
Theoretical Best
Office A
$1.75M
$1.53M – $2.04M
NOI $122,425 @ 7.0% cap · market cap 11.66%
Zoning and permitted uses should be independently verified with authorities.
How Realmo checks its estimates
Property Analytics
Unlock full access to Insights
Subscribe to Realmo Intelligence
Open Analytics
Current Use
Lease Details
4
Residential units
Multi-tenant
Tenancy
Yes
Utilities to site
Location Intelligence
Trade Area within ½ mile
327
Businesses Nearby
Explore this area
Business Placement
Demographics for 18013, PA
17,436
Population
7,401
Households
2.4
Avg Household Size
44
Median Age
24%
College-Educated
89%
High-School Grad
63.0 sq mi
ZIP Area
277
Density / Sq Mi
$76,116
Median Household Income
$37,107
Median Earnings
$1,088
Median Rent
$245,700
Median Home Value
Check the figures for this property
Cap Rate, Value Estimation, Potential NOI and more
View Realmo Analytics
Market
Vacancy Rate% for Multifamily in Northeast region




Frequently Asked Questions
What type of property is this?
Mixed-use property - Downtown Bangor property combines street-level commercial space with apartments above.
Where is this mixed-use property located?
The property is located at 28 S Main Street Bangor, PA.
What is the asking price?
The asking price for this property is $1,050,000.
What are key features of this property?
This property features: 9,221‑square‑foot mixed‑use building on 0.06 acres; Six income‑producing units: 2 commercial spaces and 4 three‑bedroom apartments; GB zoning at 28 S Main Street in downtown Bangor


