Triplex with Three-Car
For Sale
$1,219,000
Pending
28 Haslet St, Boston, MA 02131
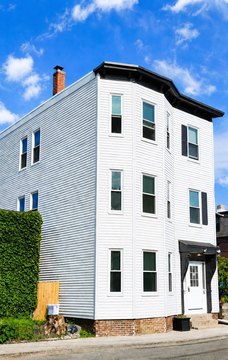
R3-zoned multifamily property near Roslindale Village, neighborhood amenities, and MBTA transit connections.
Property Size2,986 SF
Days on Market137
Property Features for 28 Haslet St
General Information
Standard status
Pending
Size
2,986 SF
Total Parking Spaces
9
Property subtype
Contingent
Zoning
R3
Net Operating Income
$70,200
Taxes and HOA fees
Annual Taxes
$11,479
Building Details
Building Size
2,986 SF
Year Built
1920
Stories
3
Listing Agency:
Real Broker Ma, LLC
(855) 450-0442
Listed By:
JEP Realty Team
(781) 258-7513
Source:
Churchillprop
Added: Jun 4
Changed: Oct 15
Last Checked: Oct 16 at 7:13AM
Displayed information is deemed reliable but is not guaranteed and should be independently verified. All listing content including descriptions, pricing, images are the copyrighted material of Real Broker Ma, LLC

Ask AI about this property
Review the available facts, identify missing information and prepare questions for the agent.
Investment Insights
Based on property information with market context.
This 2,986-square-foot triplex, built in 1920, contains three residential units, each with three bedrooms and one full bathroom. Hardwood flooring extends throughout the units, while completed work includes exterior updates and renovated bathrooms. A three-car garage provides on-site parking and is also identified as suitable for ADU use.
Located at 28 Haslet St in Boston, the property is near Roslindale Village, with restaurants, shops, a public library, and parks within walking distance. Transit access includes MBTA bus routes, commuter rail service, and Forest Hills Station, with major roadways connecting to Boston and surrounding communities. The R3 zoning designation supports its multifamily classification.
Located at 28 Haslet St in Boston, the property is near Roslindale Village, with restaurants, shops, a public library, and parks within walking distance. Transit access includes MBTA bus routes, commuter rail service, and Forest Hills Station, with major roadways connecting to Boston and surrounding communities. The R3 zoning designation supports its multifamily classification.
Key Highlights
- Three‑unit multifamily property with 2,986 SF
- Each unit includes 3 bedrooms and 1 full bathroom
- Three‑car garage offers parking or ADU use
Financial Insights
Estimated NOI and Cap Rate
NOI / Yr
$75,454
Cap Rate
6.19%
Suggested Prices Based on Cap Rates
Cap Rate 5%
$1,509,080
$1.5M
Cap Rate 7%
$1,077,914
$1.1M
Cap Rate 9%
$838,378
$838.4K
Market Conditions
NOI Build-Up for 2,986 SF
Gross rent
$112.9K $37.80/SF
− Vacancy
−$5.1K −$1.70/SF
EGI
$107.8K $36.10/SF
− OpEx
−$32.3K −$10.83/SF
NOI
$75.5K $25.27/SF
Area
Boston, MA
Vacancy
4.50%
Lease Rate
$37.80 /SF/Yr
Expense Ratio
30.00%
Simulate Cap Rate and NOI
Suggested Prices Based on Cap Rates
Cap Rate 5%
$1,509,080
Cap Rate 7%
$1,077,914
Cap Rate 9%
$838,378
Alternative Uses
Best Use
Multifamily LT 5
$1.08M
$943.2K – $1.26M
NOI $75,454 @ 7.0% cap · market cap 6.19%
Second Best
Apartment 5plus
$1.00M
$876.8K – $1.17M
NOI $70,147 @ 7.0% cap · market cap 5.75%
Theoretical Best
Office A
$2.24M
$1.96M – $2.61M
NOI $156,514 @ 7.0% cap · market cap 12.84%
Zoning and permitted uses should be independently verified with authorities.
How Realmo checks its estimates
Property Analytics
Unlock full access to Insights
Subscribe to Realmo Intelligence
Open Analytics
Current Use
Location Intelligence
Trade Area within ½ mile
1,119
Businesses Nearby
Explore this area
Business Placement
Demographics for 02131, MA
30,544
Population
13,264
Households
2.3
Avg Household Size
39
Median Age
52%
College-Educated
89%
High-School Grad
2.8 sq mi
ZIP Area
10,909
Density / Sq Mi
$109,237
Median Household Income
$65,268
Median Earnings
$1,999
Median Rent
$634,200
Median Home Value
Check the figures for this property
Cap Rate, Value Estimation, Potential NOI and more
View Realmo Analytics
Market
Vacancy Rate% for Multifamily in Northeast region



Frequently Asked Questions
What type of property is this?
Triplex - R3-zoned multifamily property near Roslindale Village, neighborhood amenities, and MBTA transit connections.
Where is this triplex located?
The property is located at 28 Haslet St Boston, MA.
What is the asking price?
The asking price for this property is $1,219,000.
What are key features of this property?
This property features: Three‑unit multifamily property with 2,986 SF; Each unit includes 3 bedrooms and 1 full bathroom; Three‑car garage offers parking or ADU use


