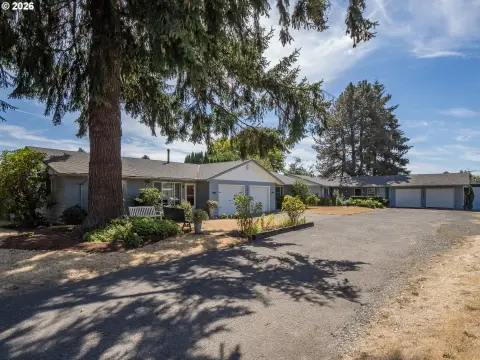
Updated Duplex with Flexible
For Sale
$799,000
2706 SE SPRUCE St, Hillsboro, OR 97123
MultiFamily, Hillsboro, OR
Property Size2,798 SF
Lot Size0.21 Acres
Price / SF$285.56
Days on Market100
Property Features for 2706 SE SPRUCE St
General Information
Property type
Residential Multi Family
Property subtype
Other
Zoning
SFR-7
Bedrooms
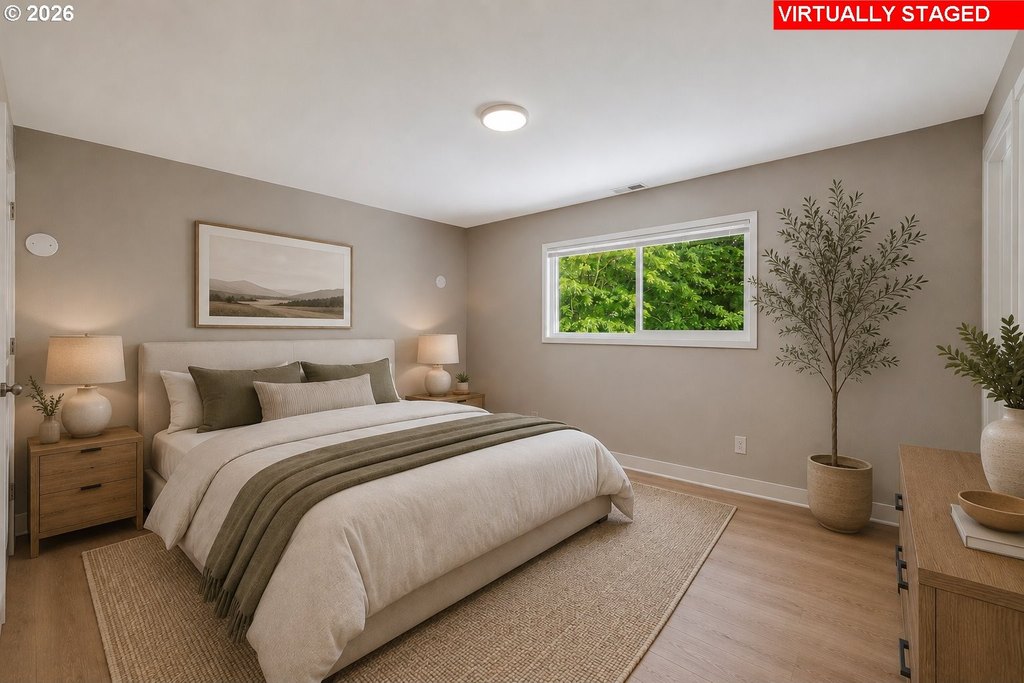
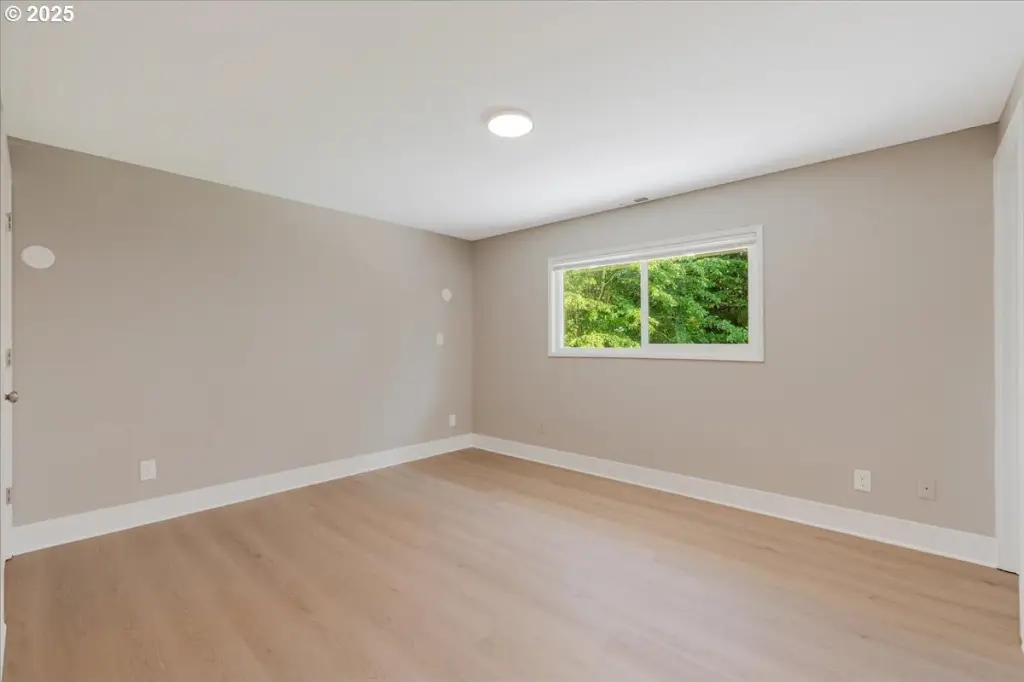
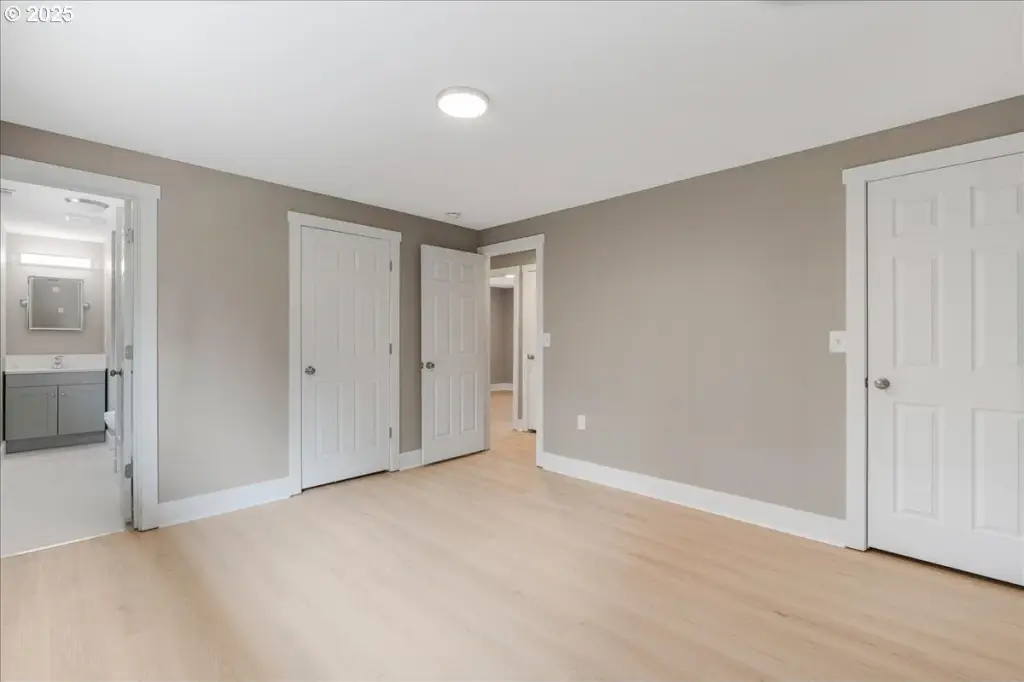
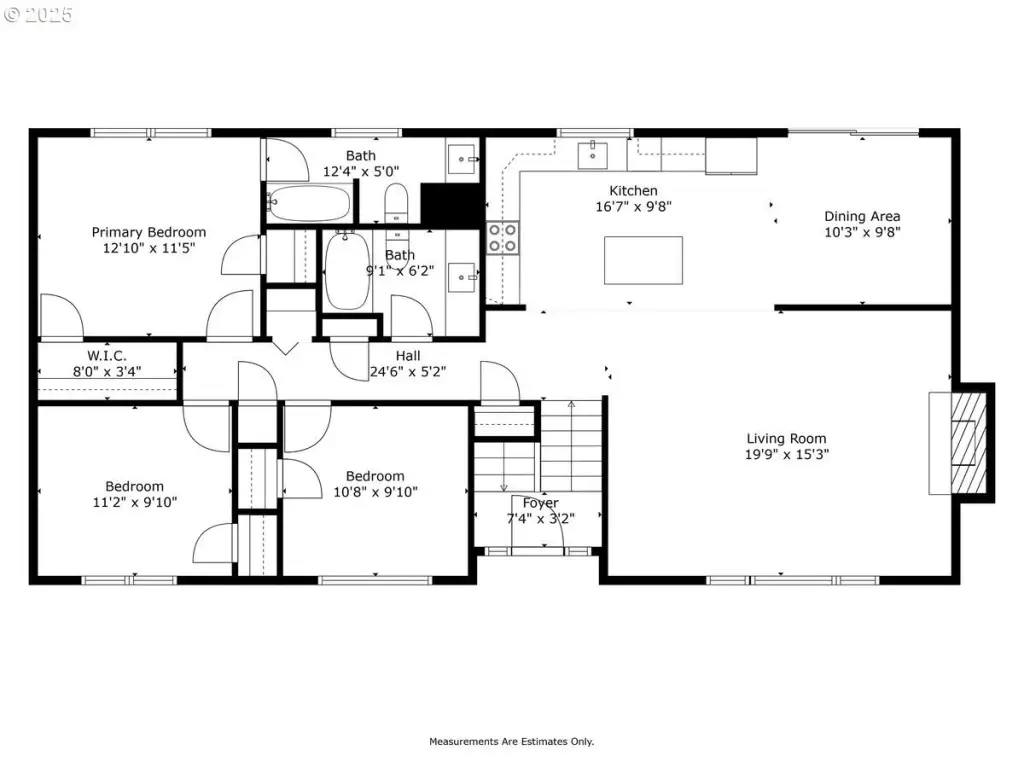
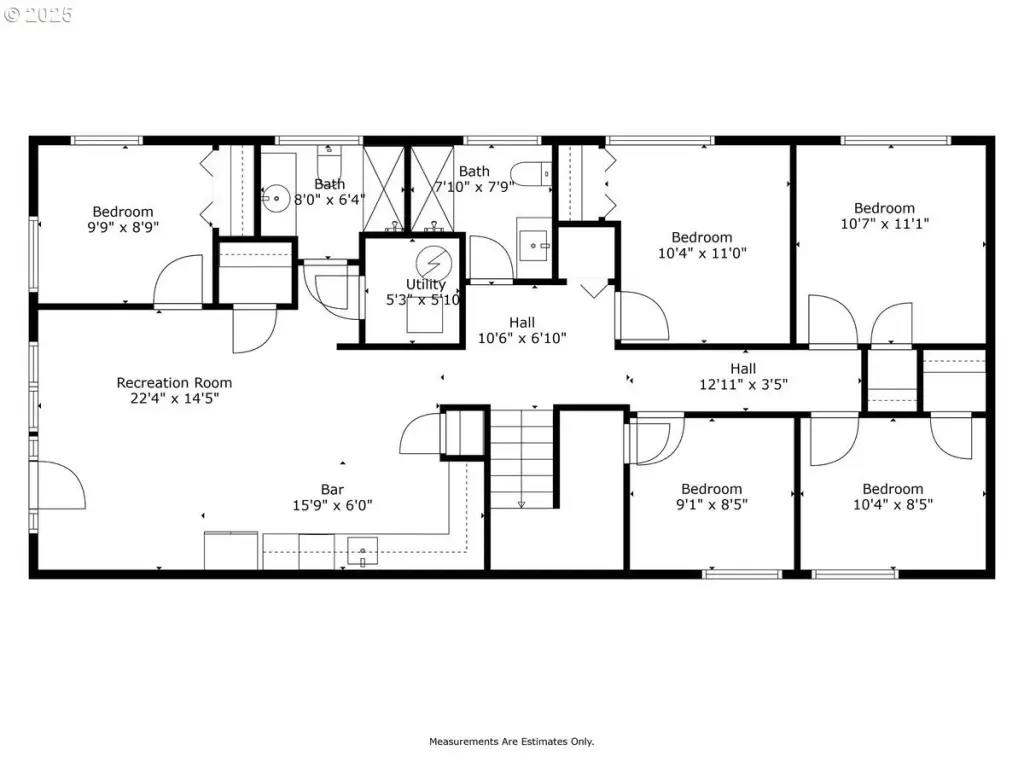
8
Bathrooms
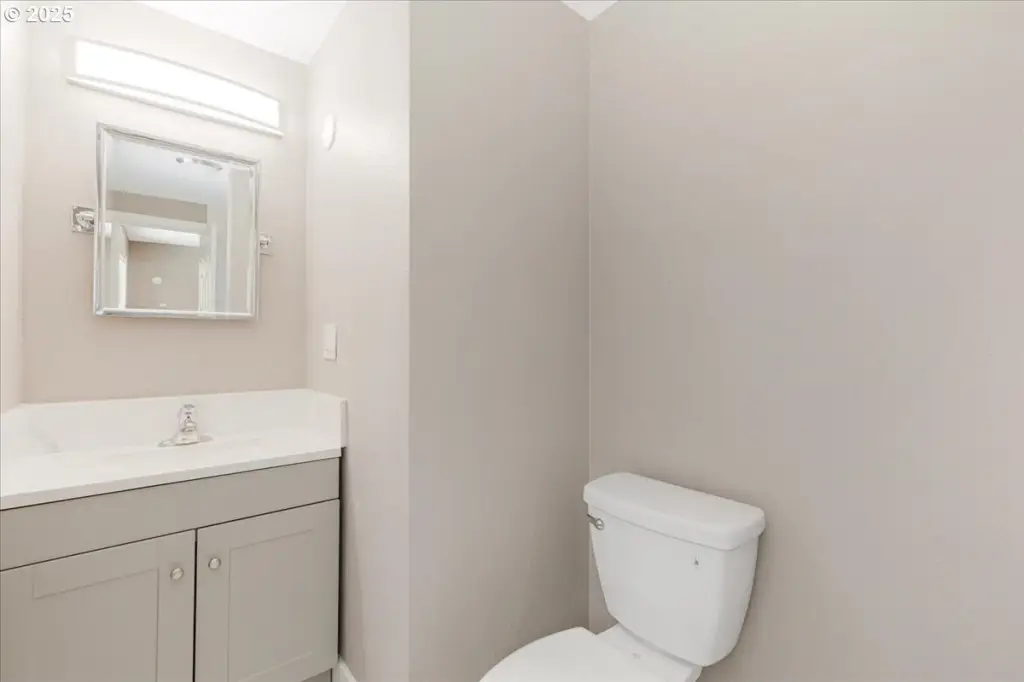
4
Full bathrooms
4
Rooms
Bathroom 3, Bathroom 4, Bedroom 3, Bedroom 7, Bedroom 8, Bathroom 1, Bedroom 2, Bedroom 6, Bedroom 5, Bedroom 1, Bathroom 2, Bedroom 4
View
Territorial
Elementary school
W.L. Henry
Middle school
South Meadows
High school
Hillsboro
Directions
SE 32nd Ave (SE Cypress), SE 28th, Left on SE Spruce
Subdivision
_152
Standard status
Active
APN
R320398
Size
2,798 SF
Lot size
0.21 Acres
Taxes and HOA fees
Tax Description
CEDAR PARK NO.3, BLOCK 9, LOT 11
Tax Annual Amount
6212
Legal Description
CEDAR PARK NO.3, BLOCK 9, LOT 11
Utilities
Heating system
Forced Air
Cooling system
Central Air
Amenities
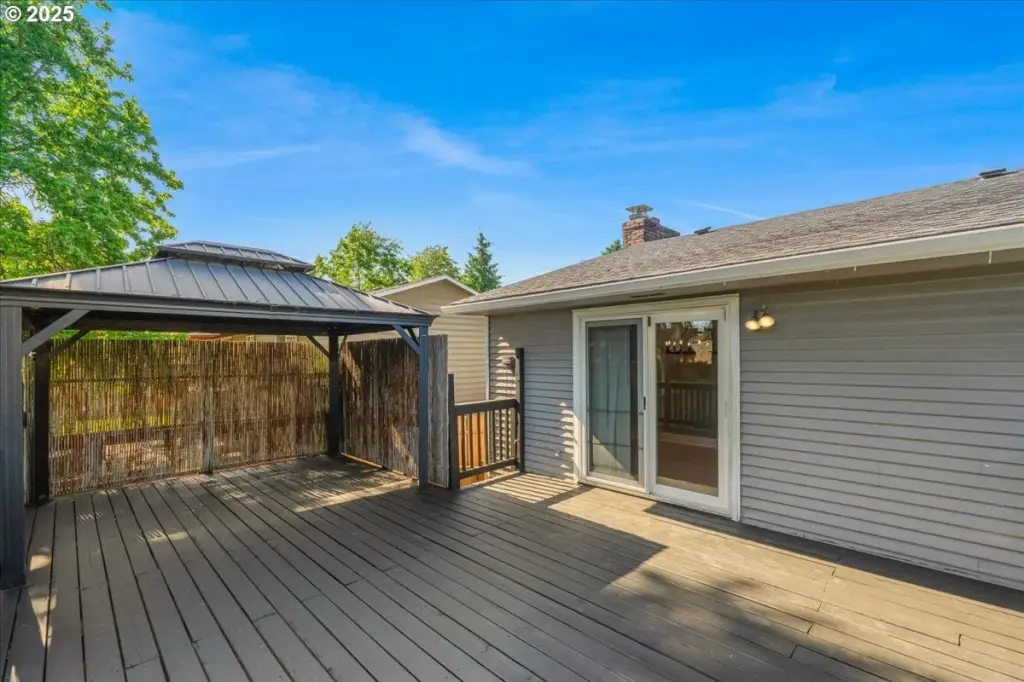
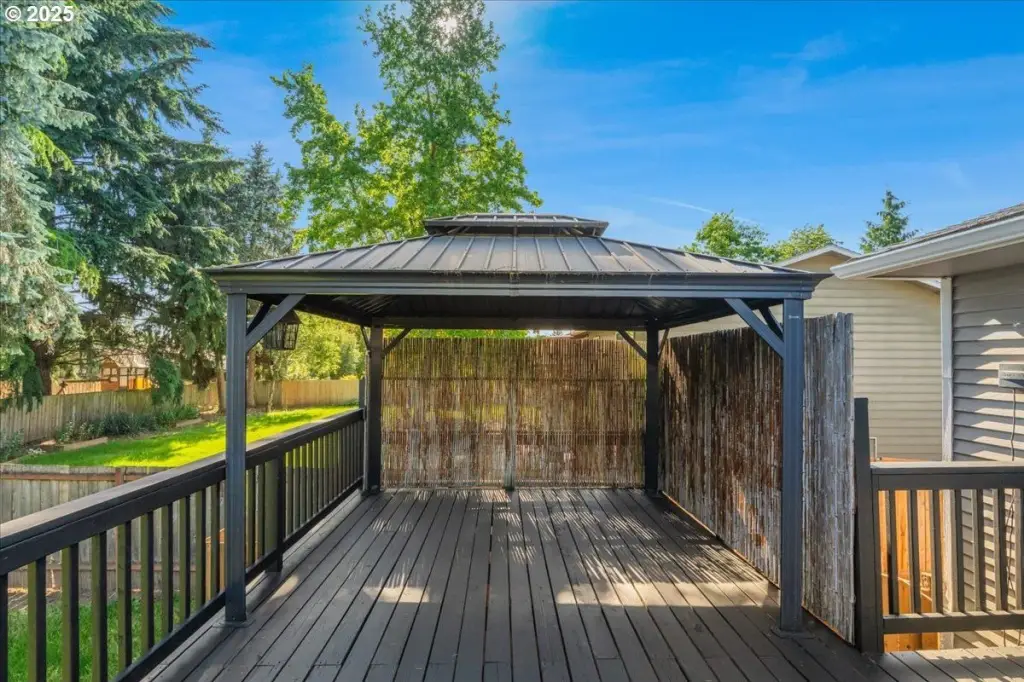
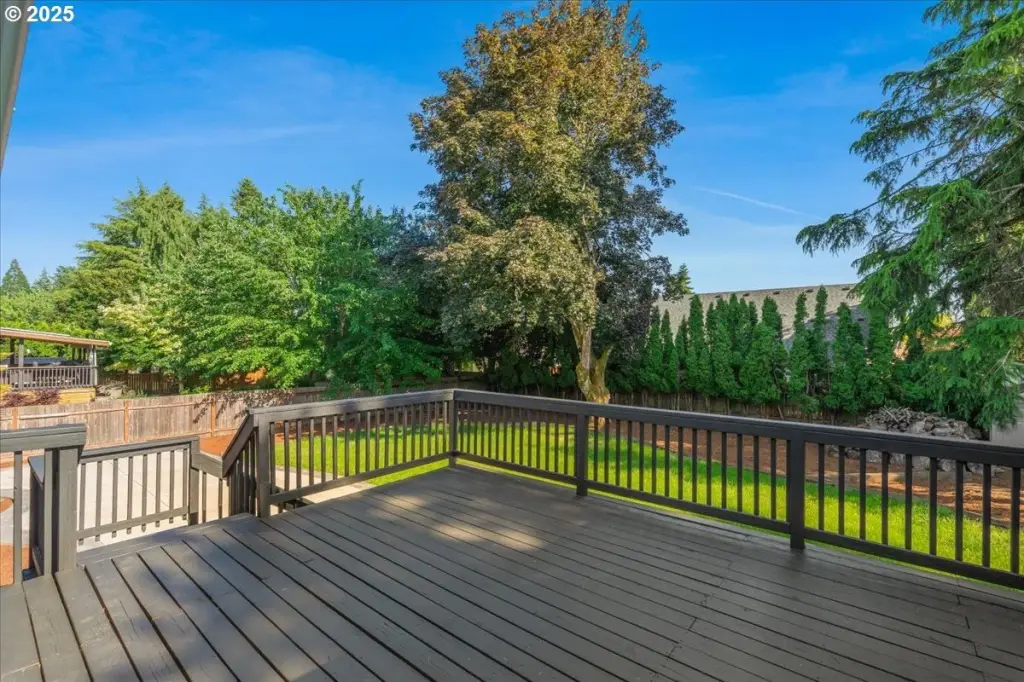
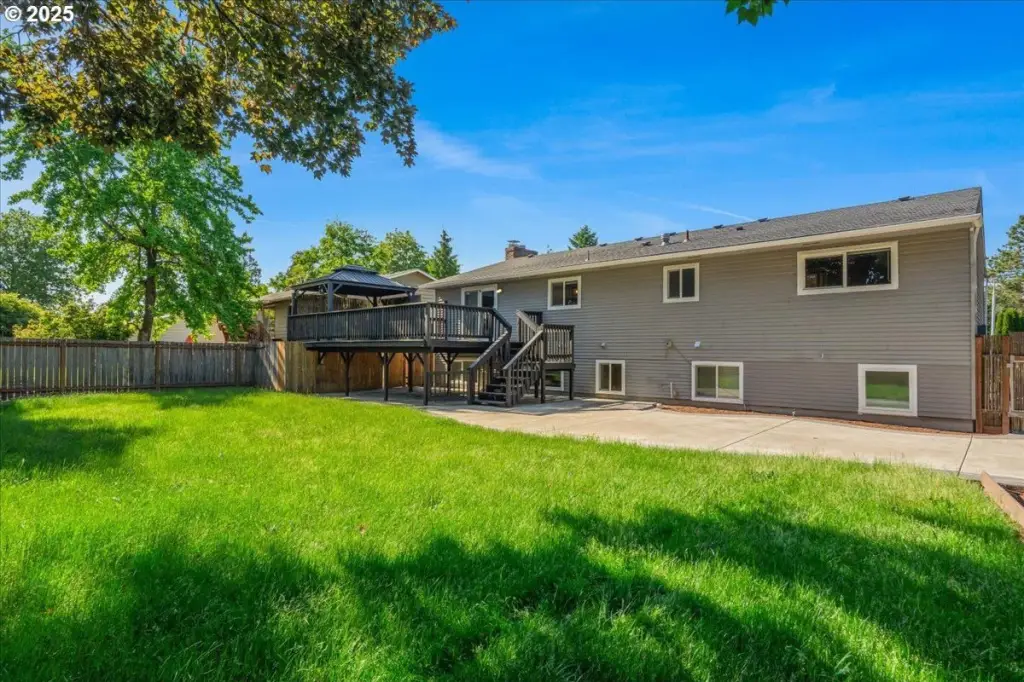
deck
covered gazebo
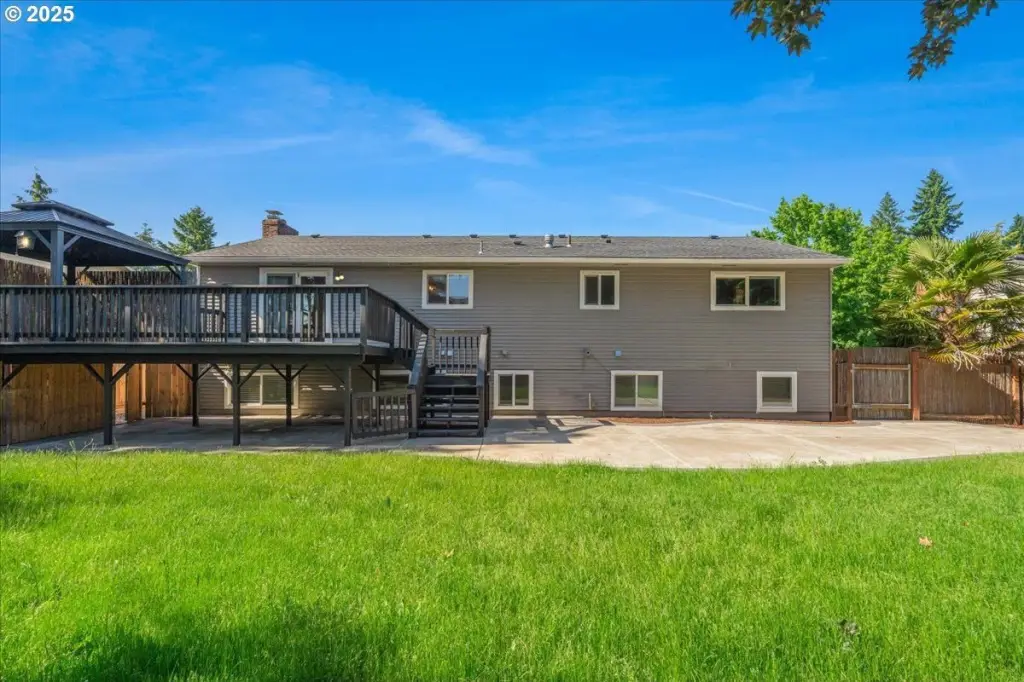
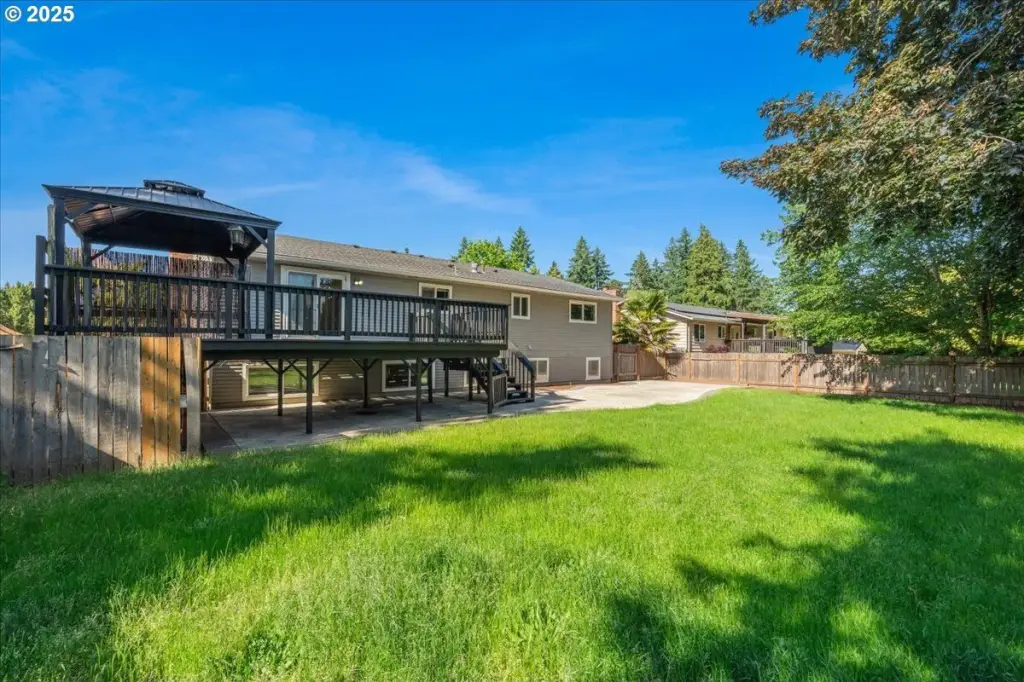
fenced backyard
patio
garden shed
Building Details
Year built
1970
Floors in Building
2
Number of units
2
Roof type
Composition
Listing Agency:
Premiere Property Group, LLC
(503) 670-9000
Listed By:
Kristina Horning · License #201208749
(503) 523-8556
Added: Jul 7
Changed: Oct 13
Last Checked: Oct 14 at 1:06PM
MLS# 302256276
Copyright © 2026 Regional Multiple Listing Services. All rights reserved. All information provided by the listing agent/broker is deemed reliable but is not guaranteed and should be independently verified.
Investment Insights
Based on property information with market context.
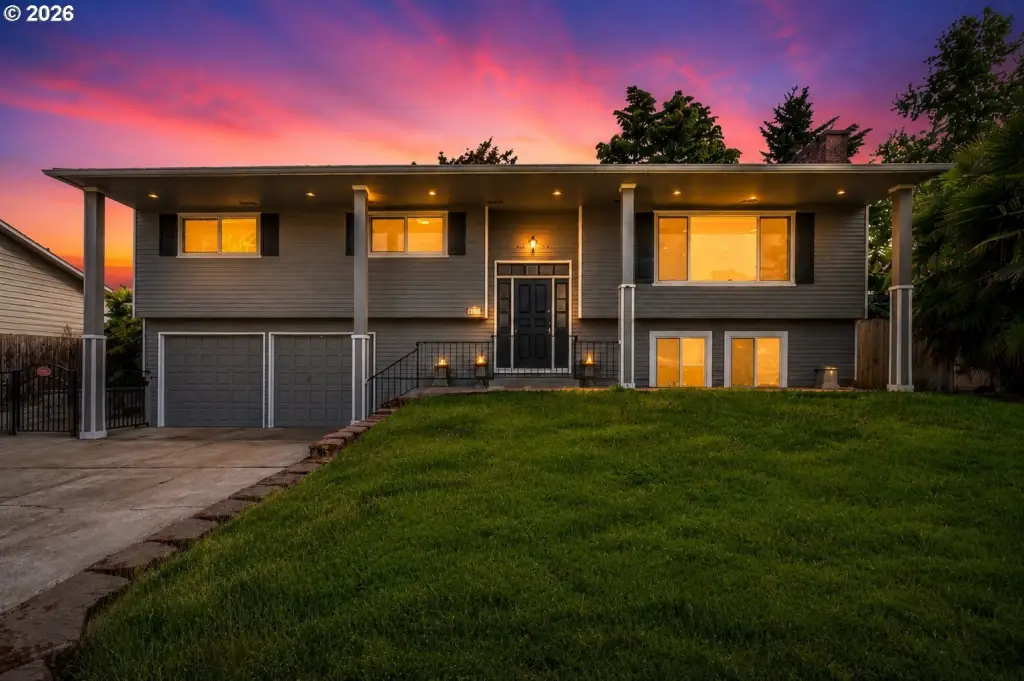
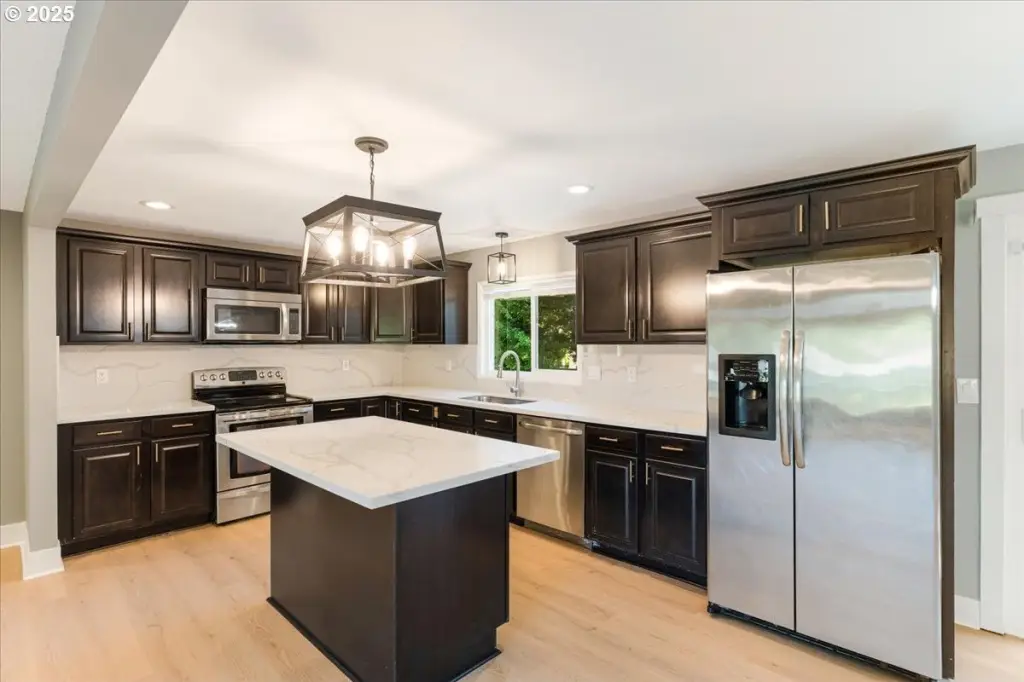
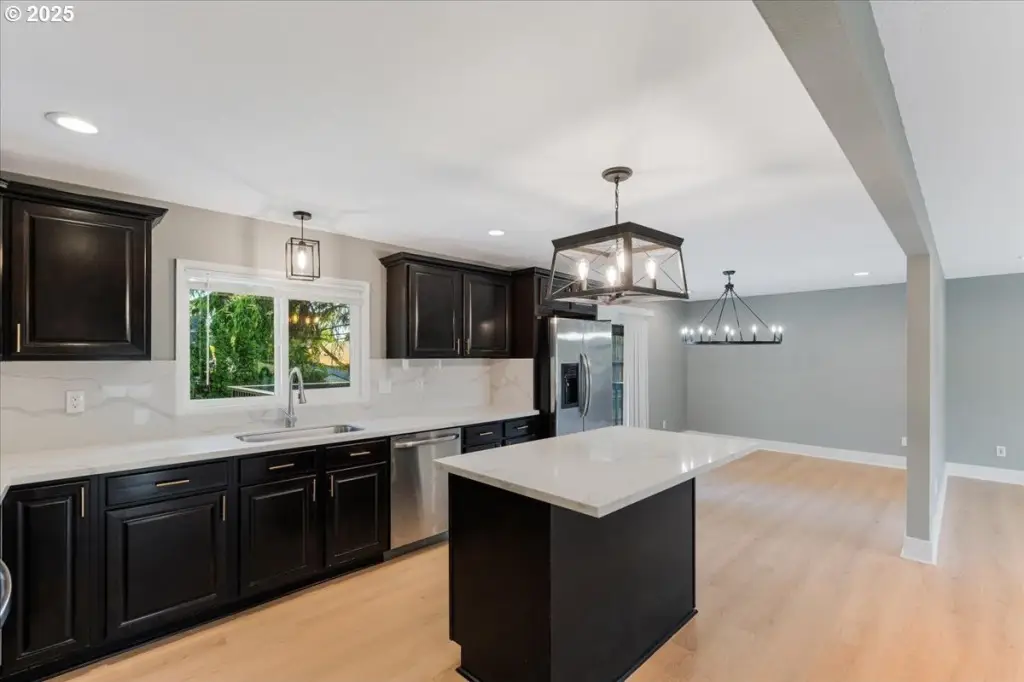
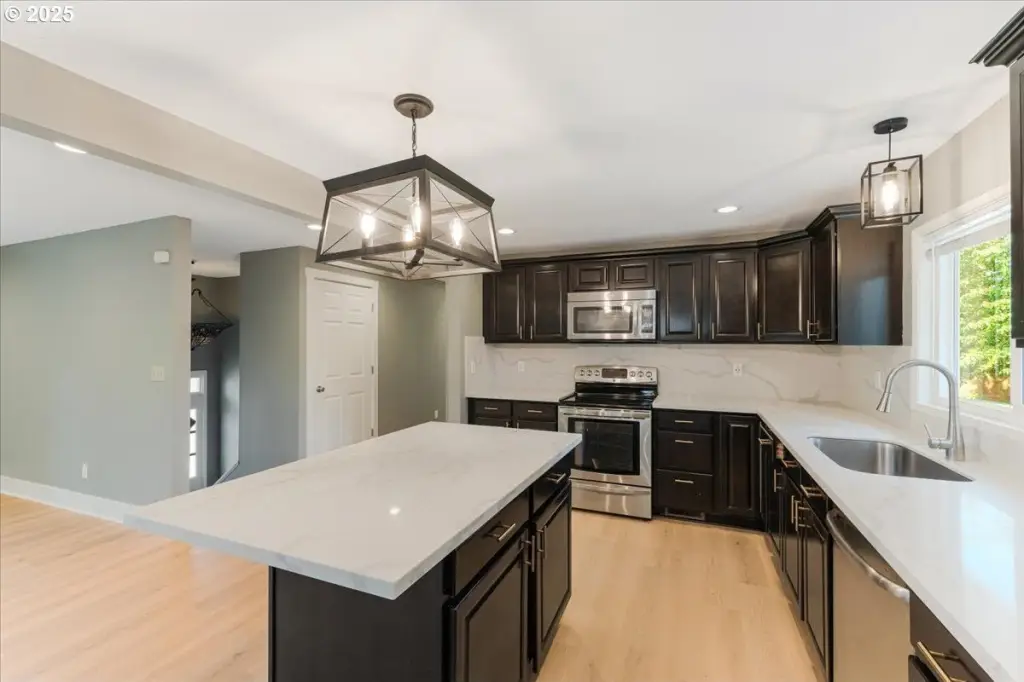
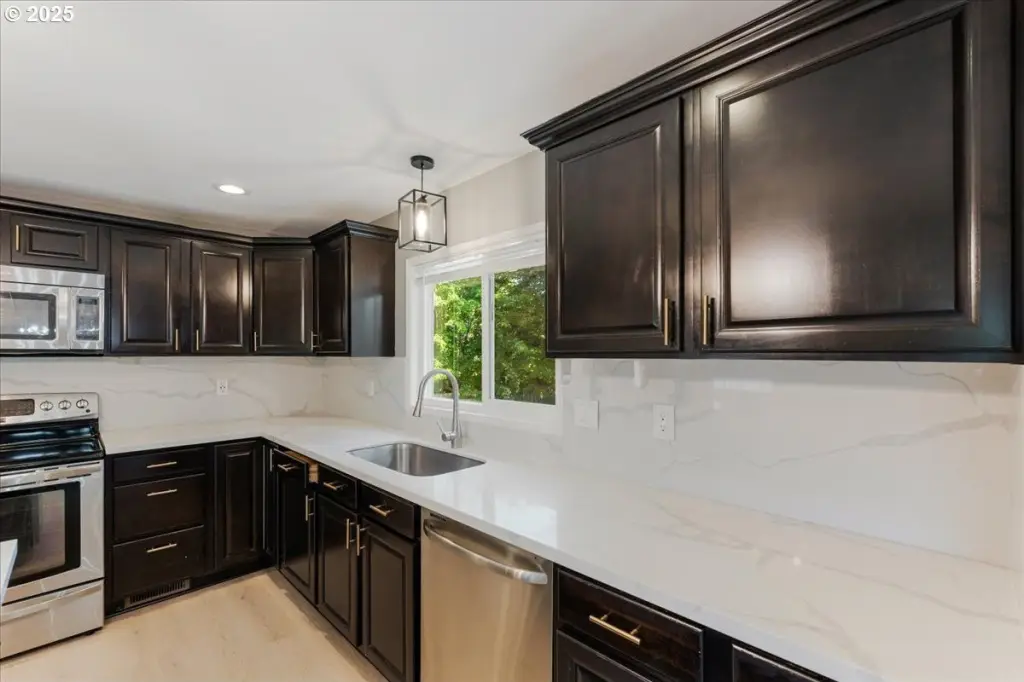
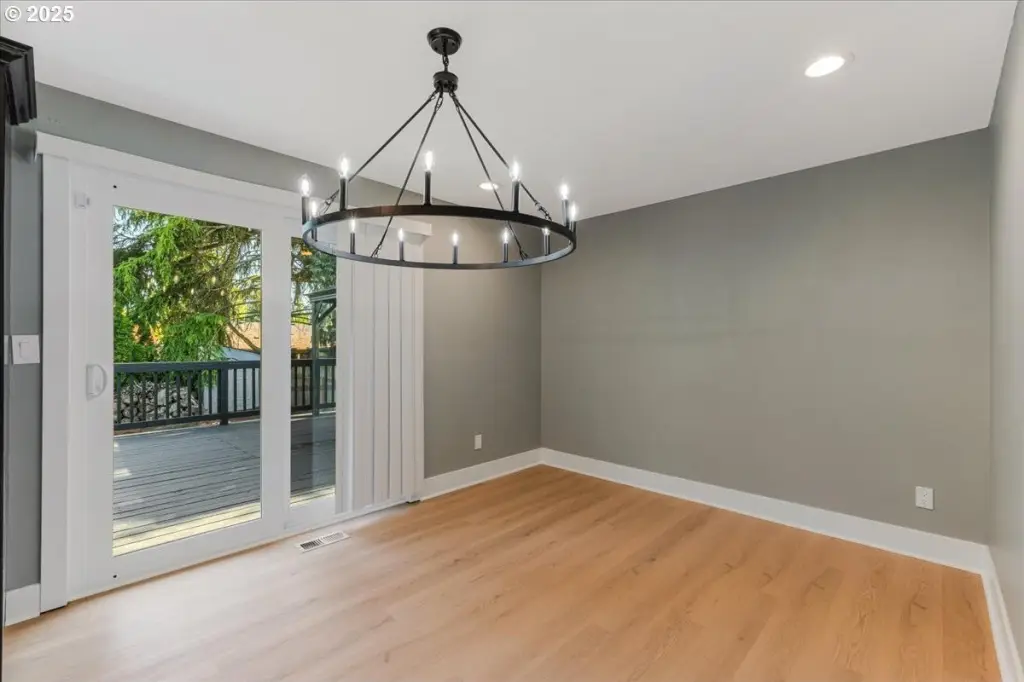
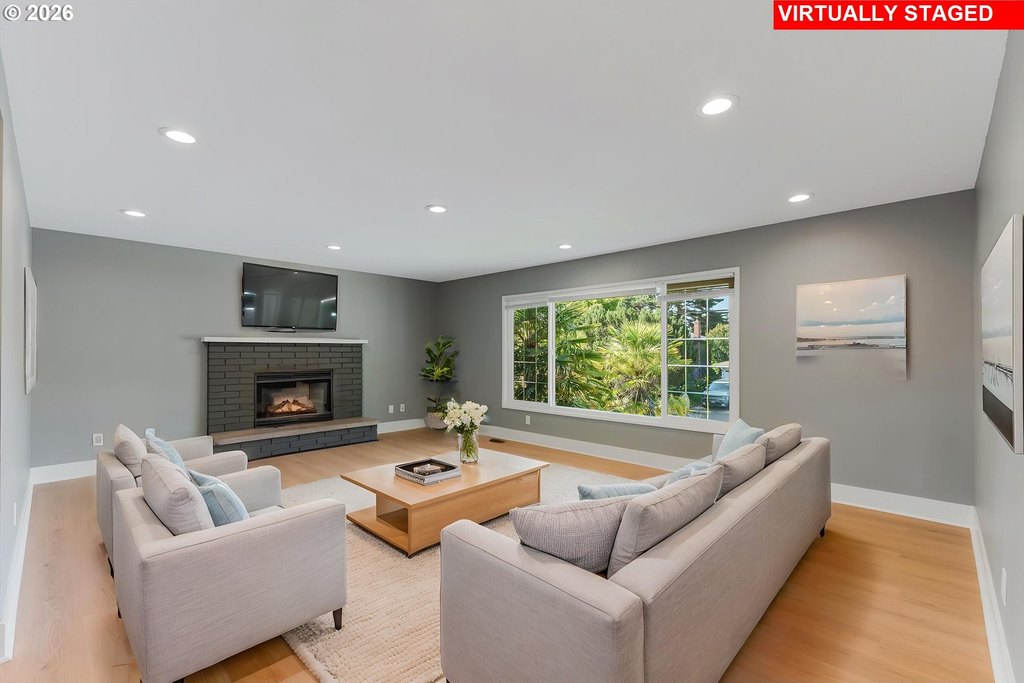
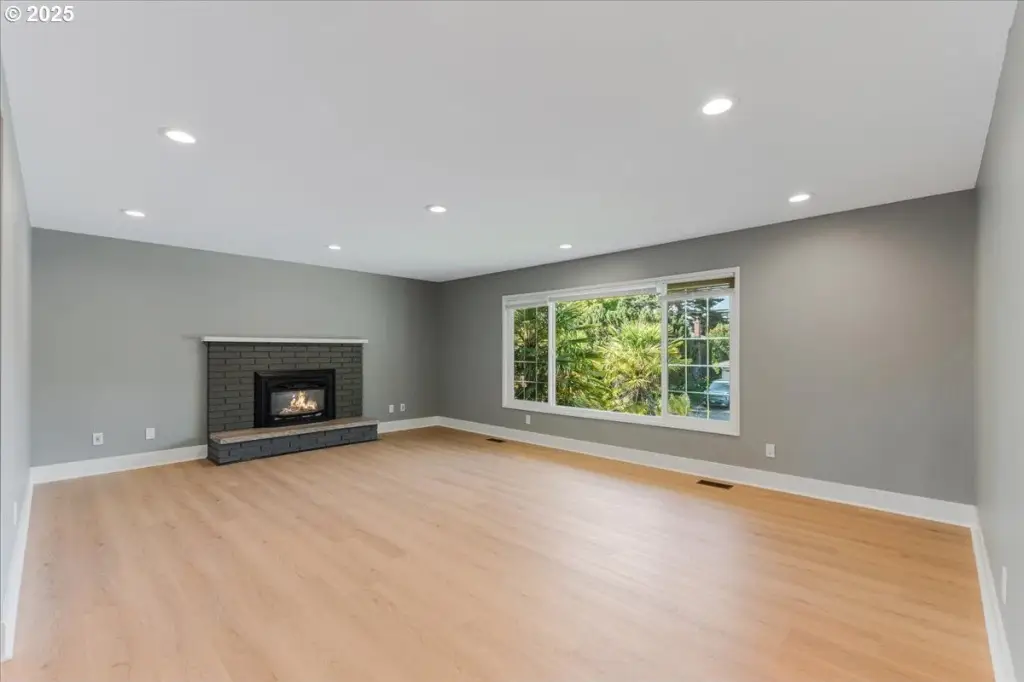
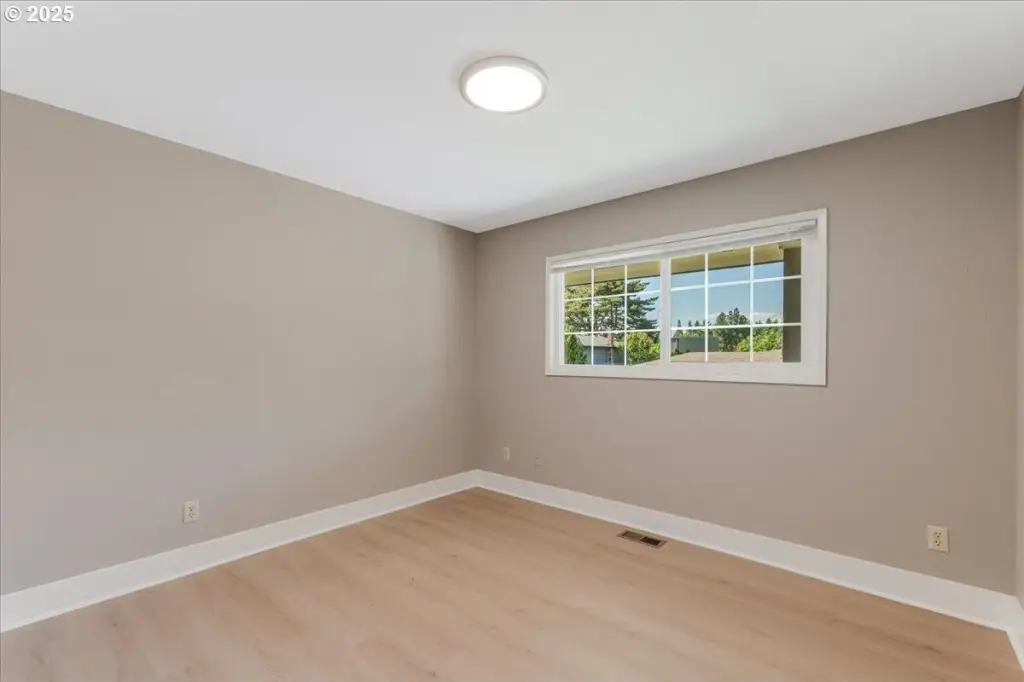
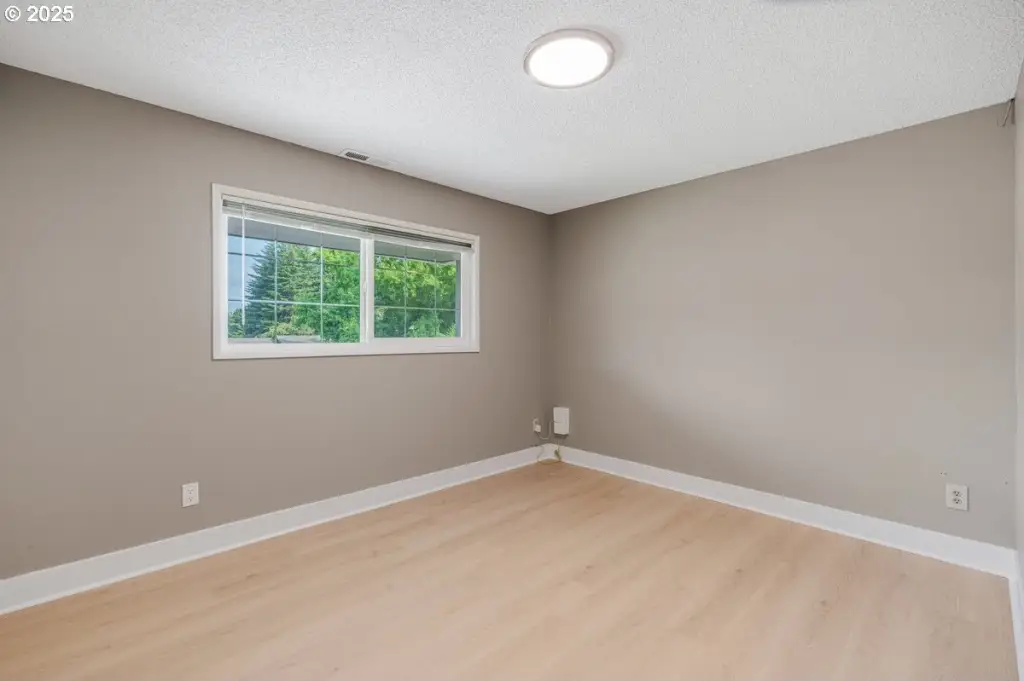
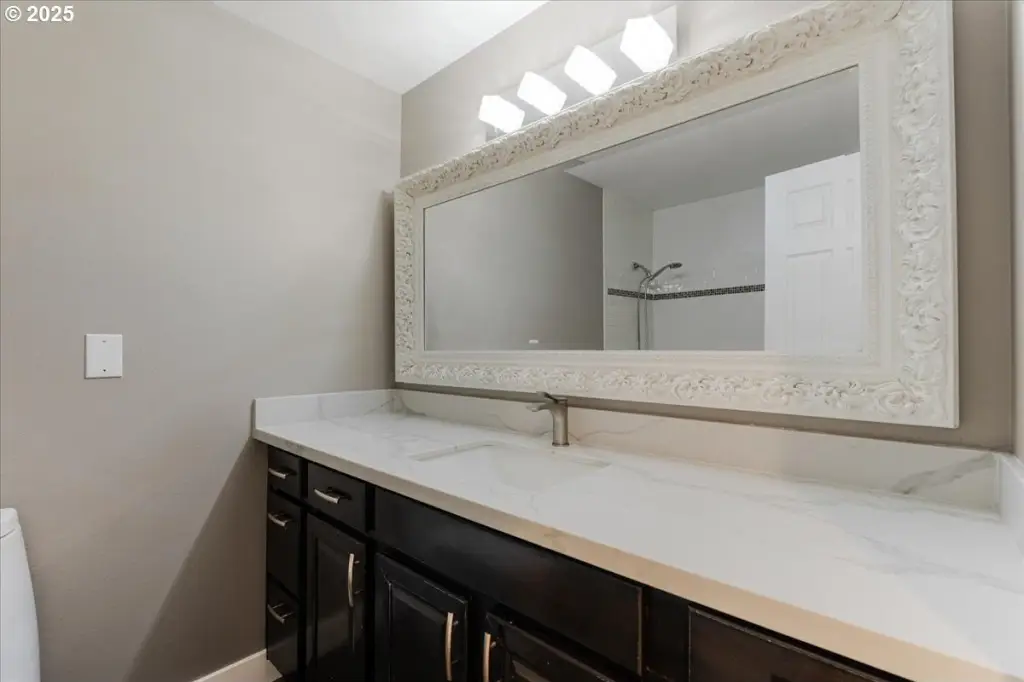
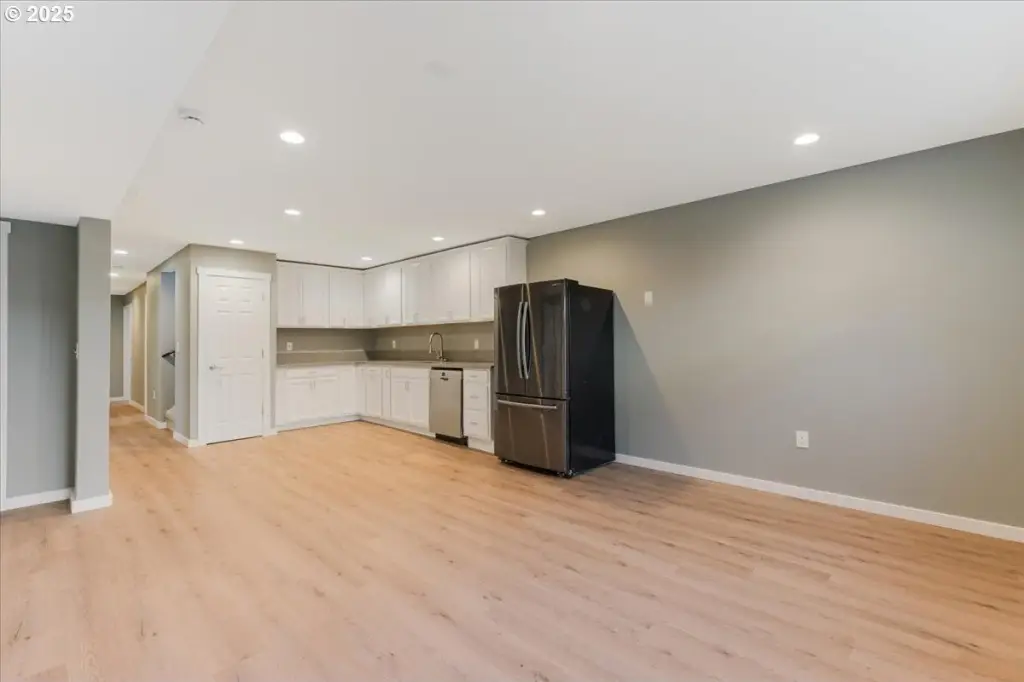
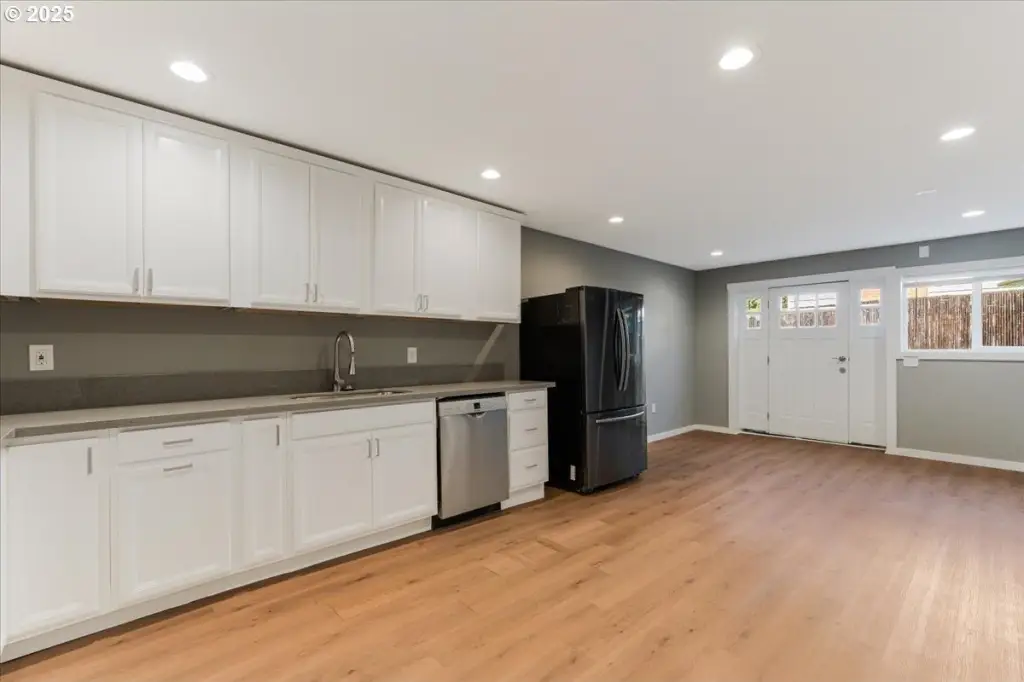
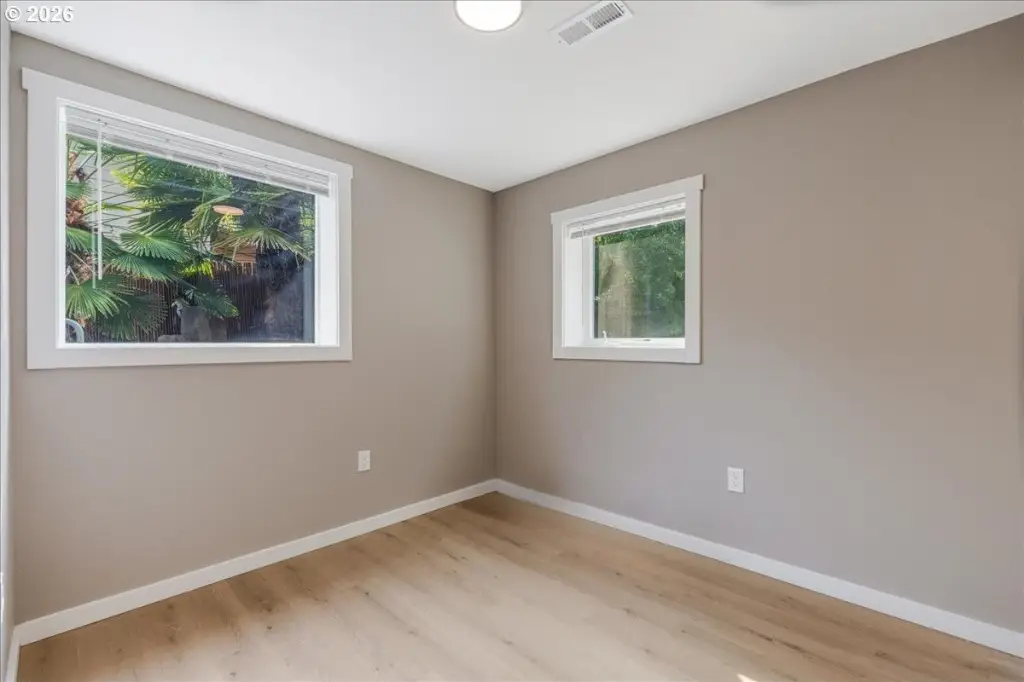
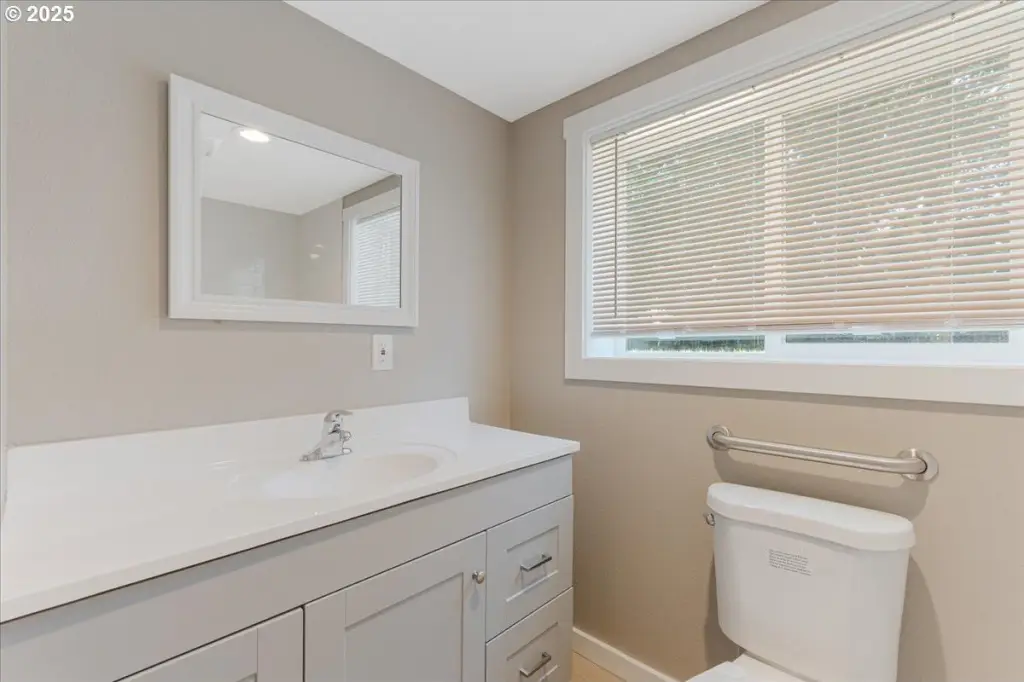
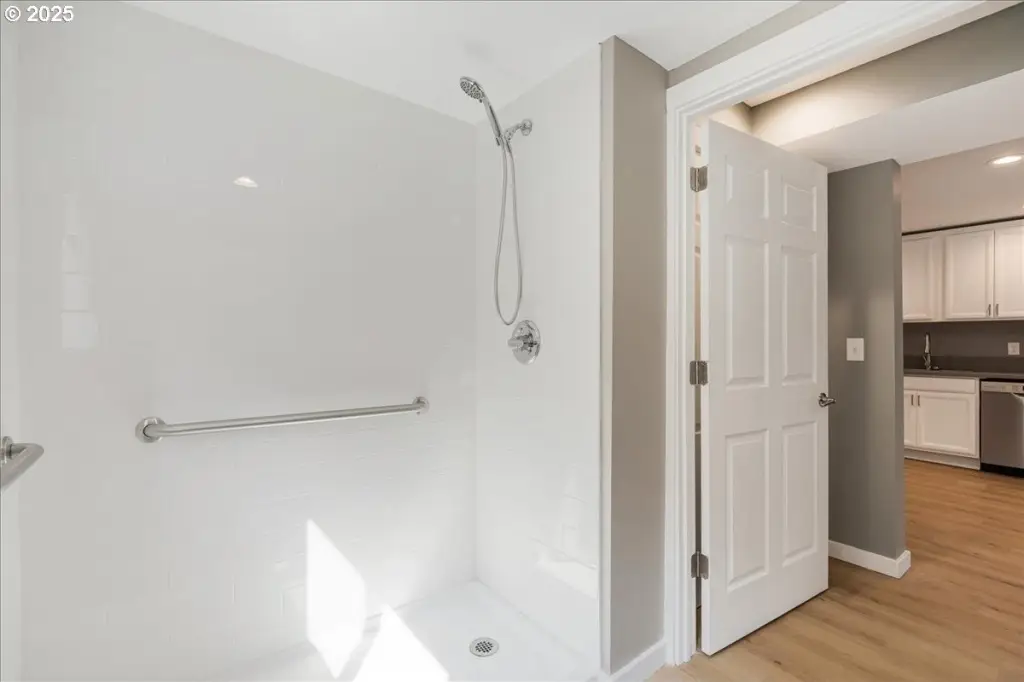
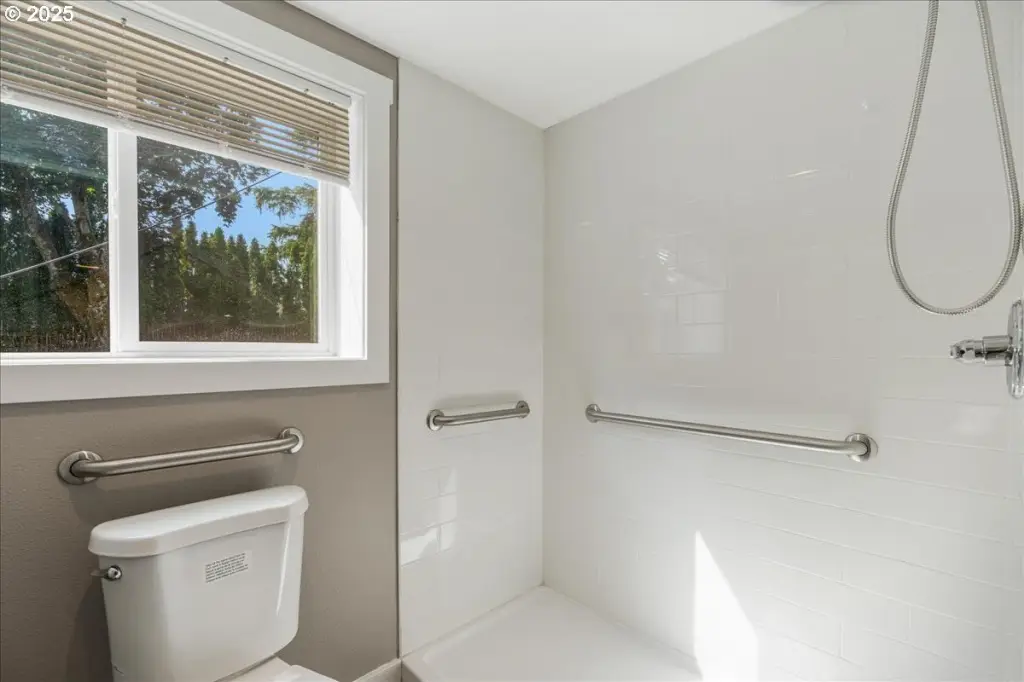
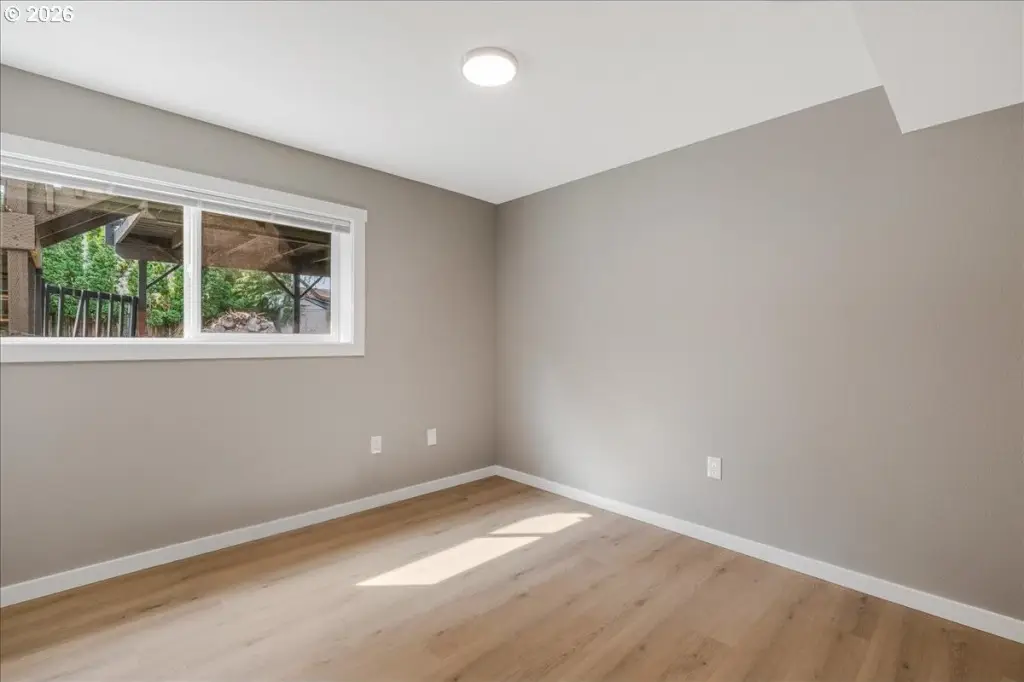
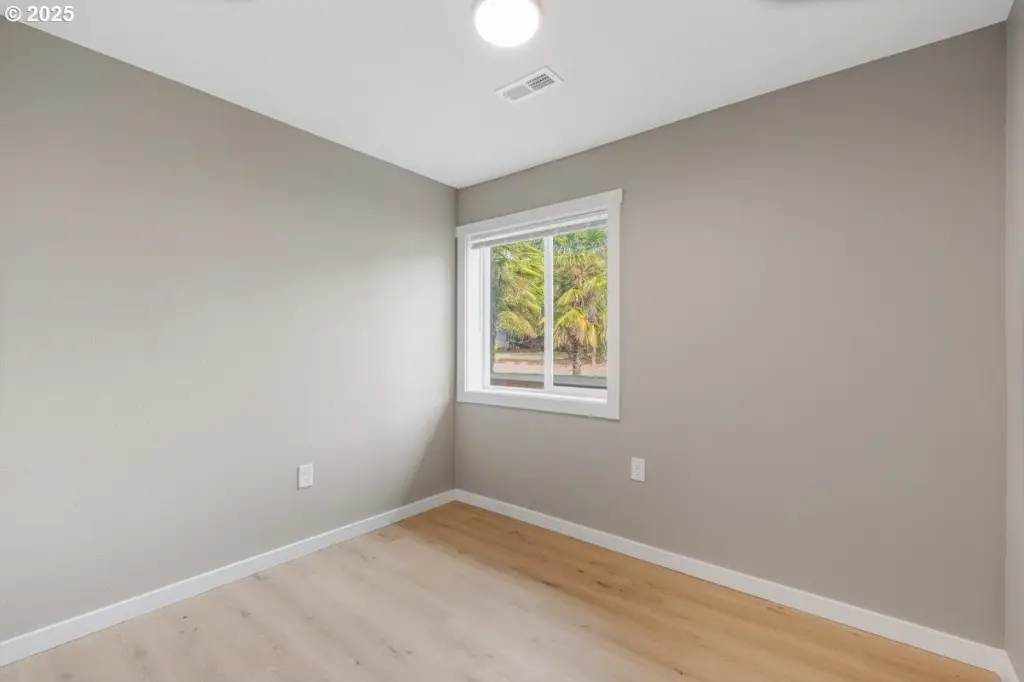
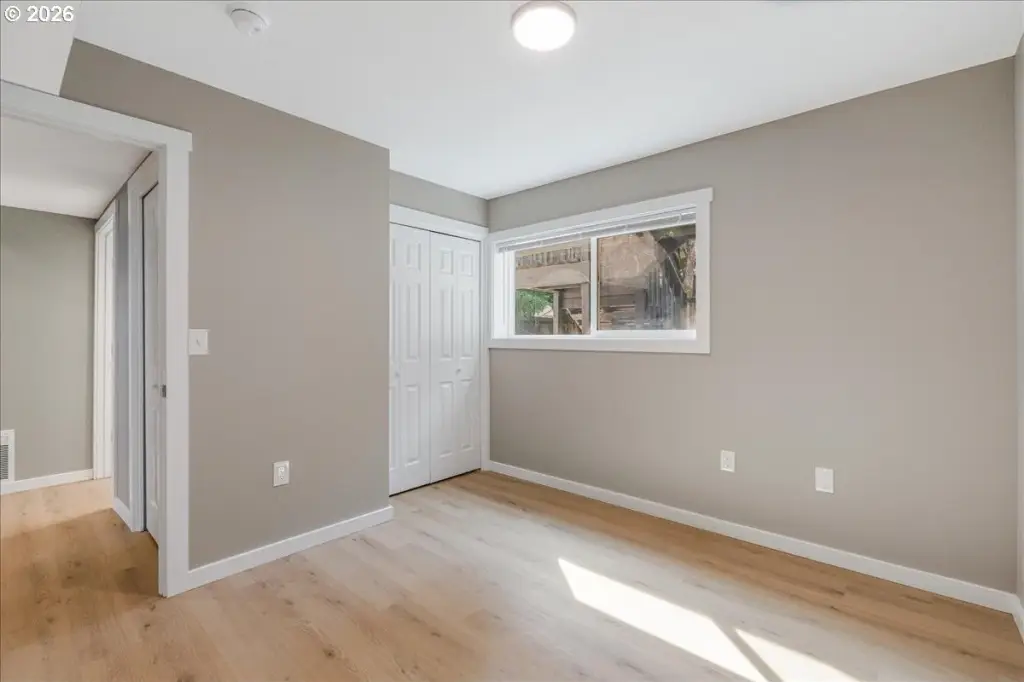
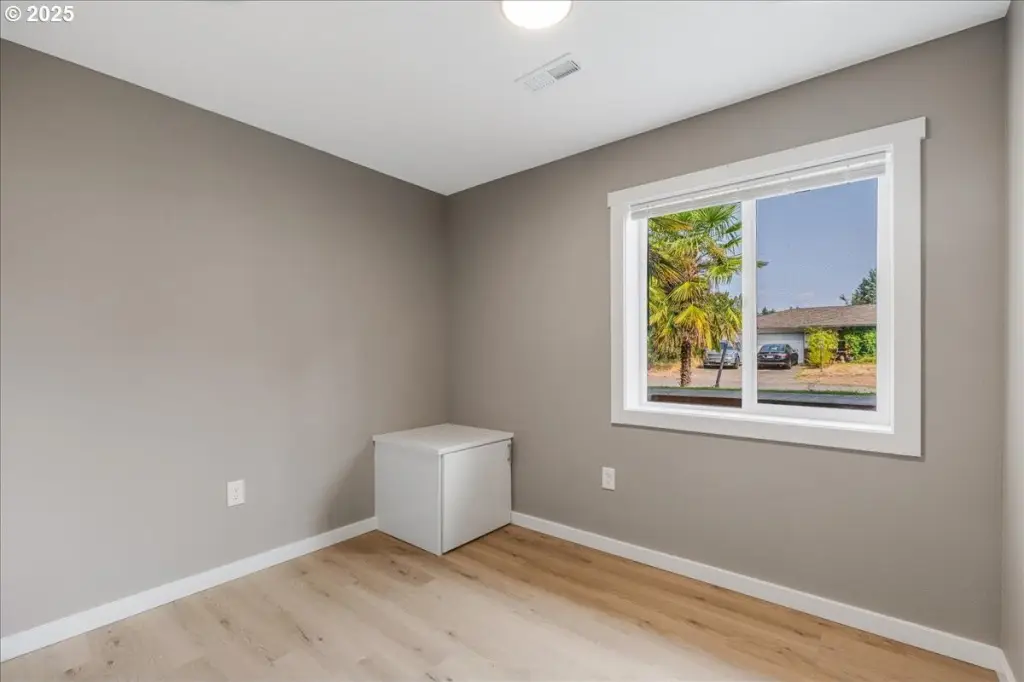
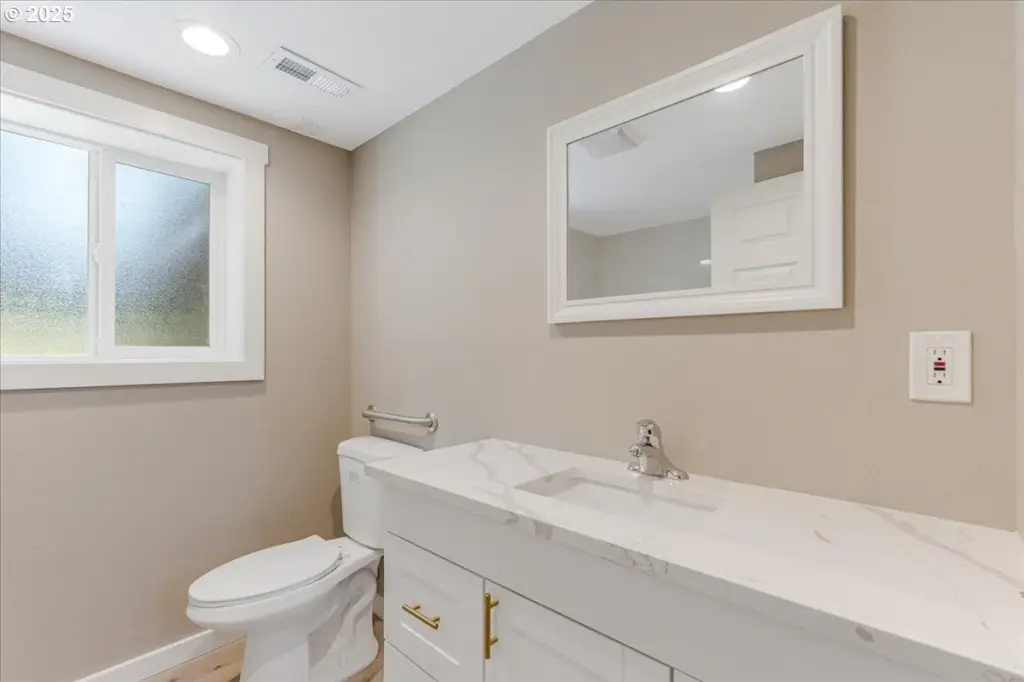
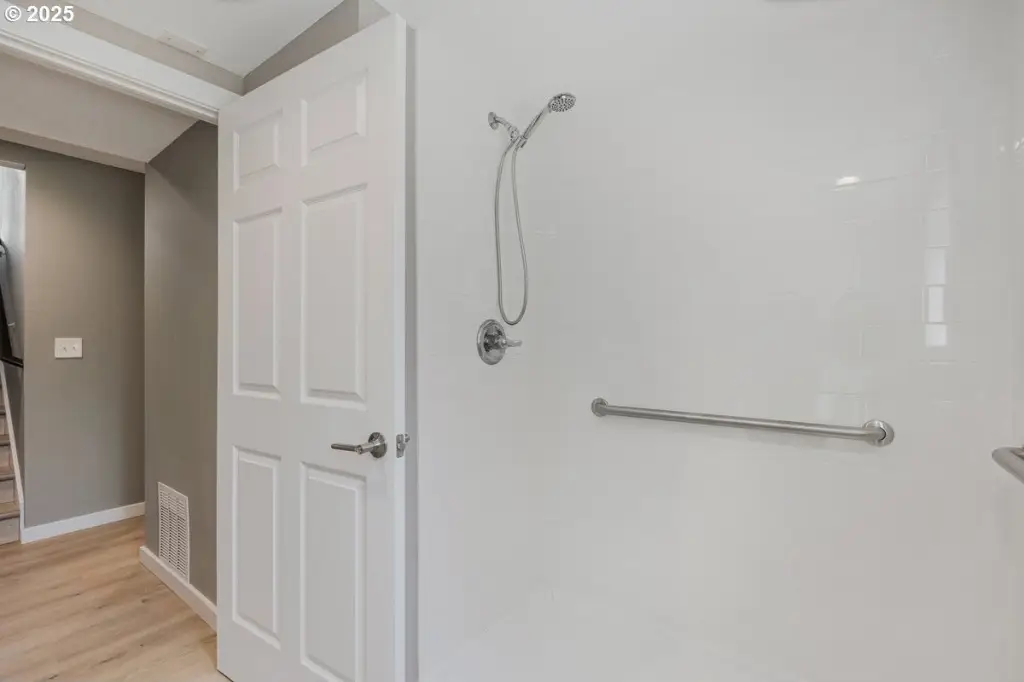
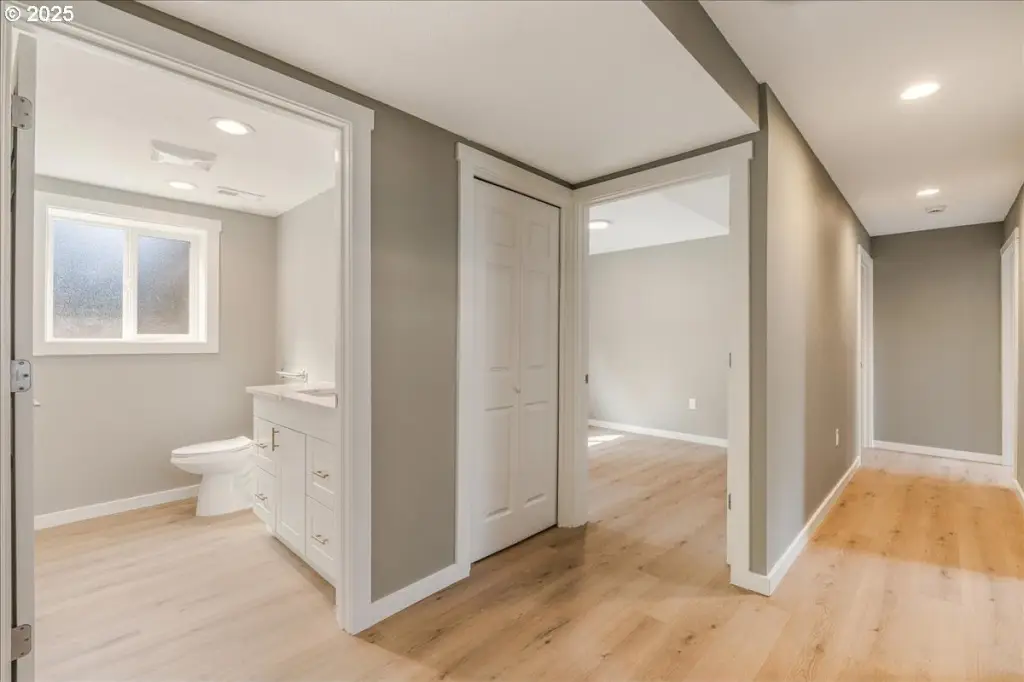
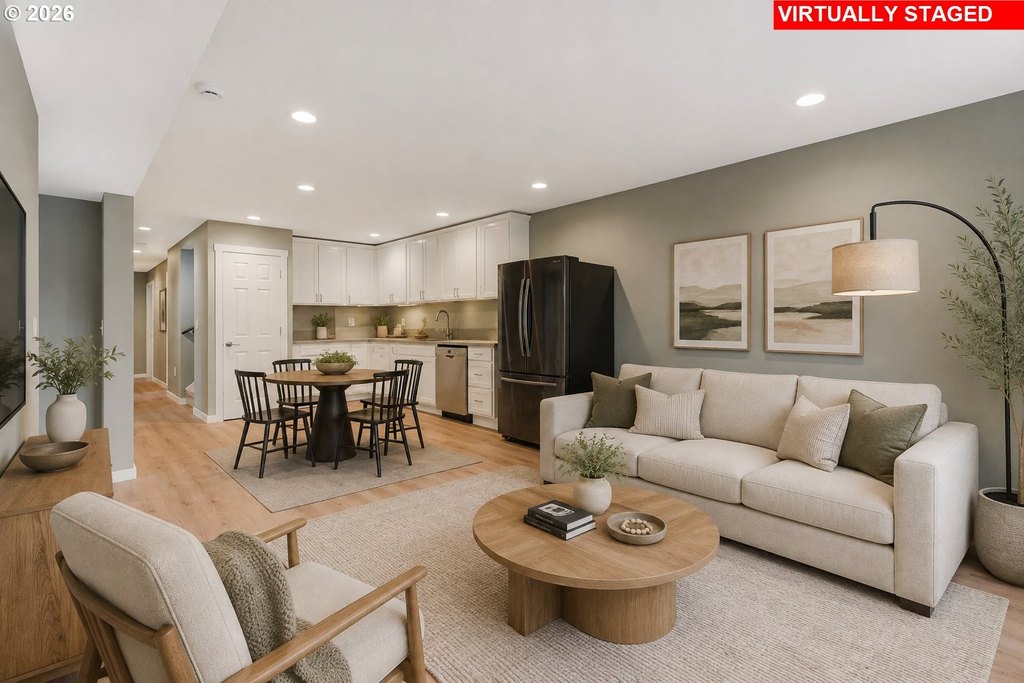
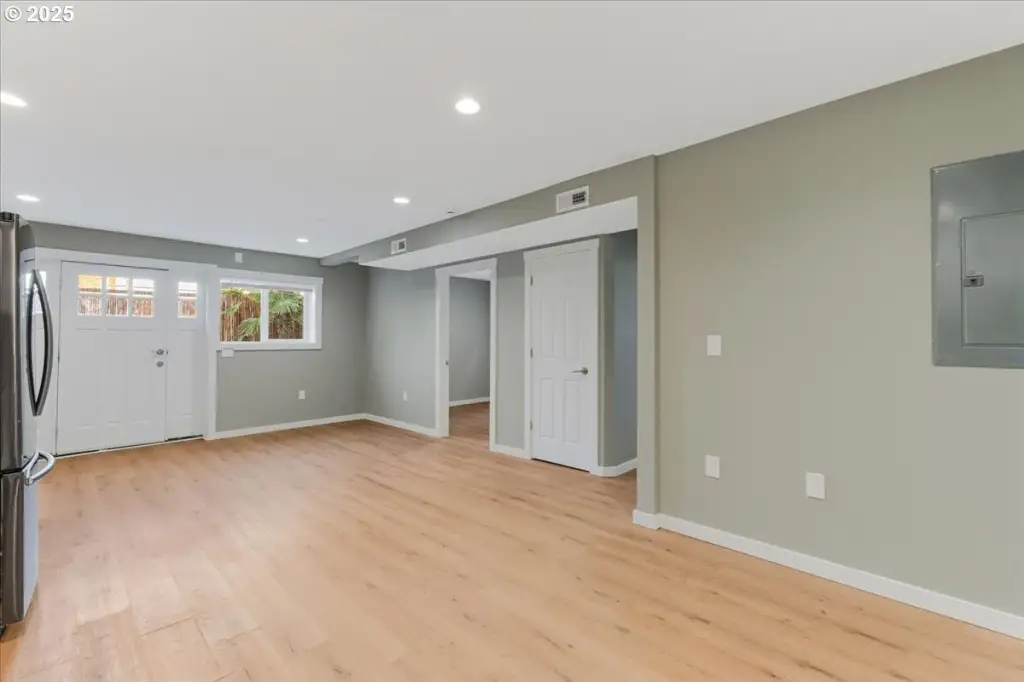
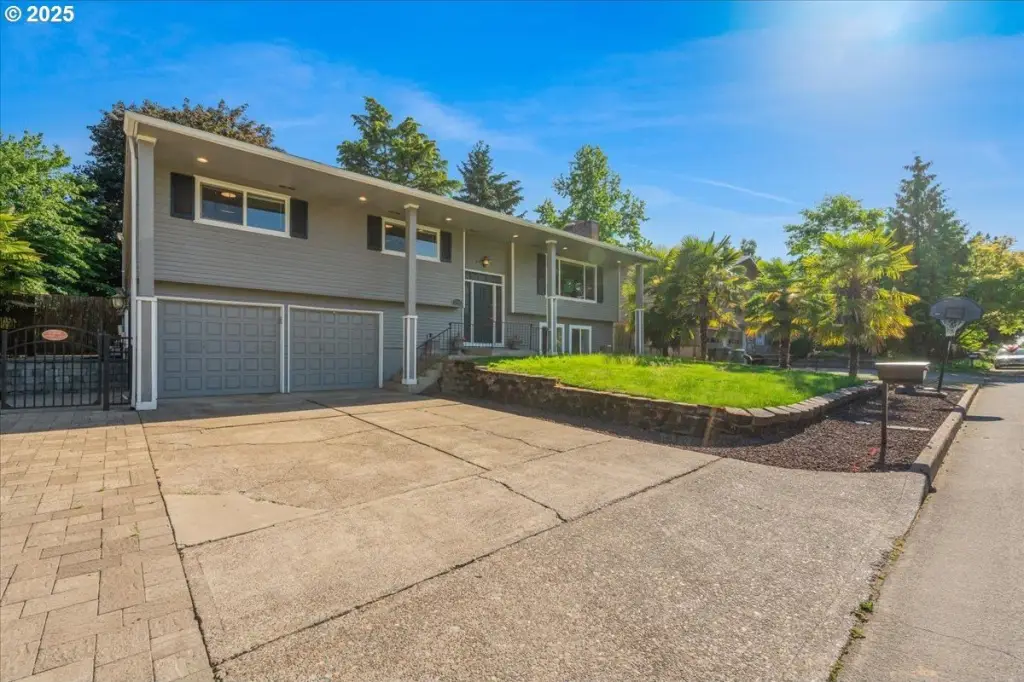
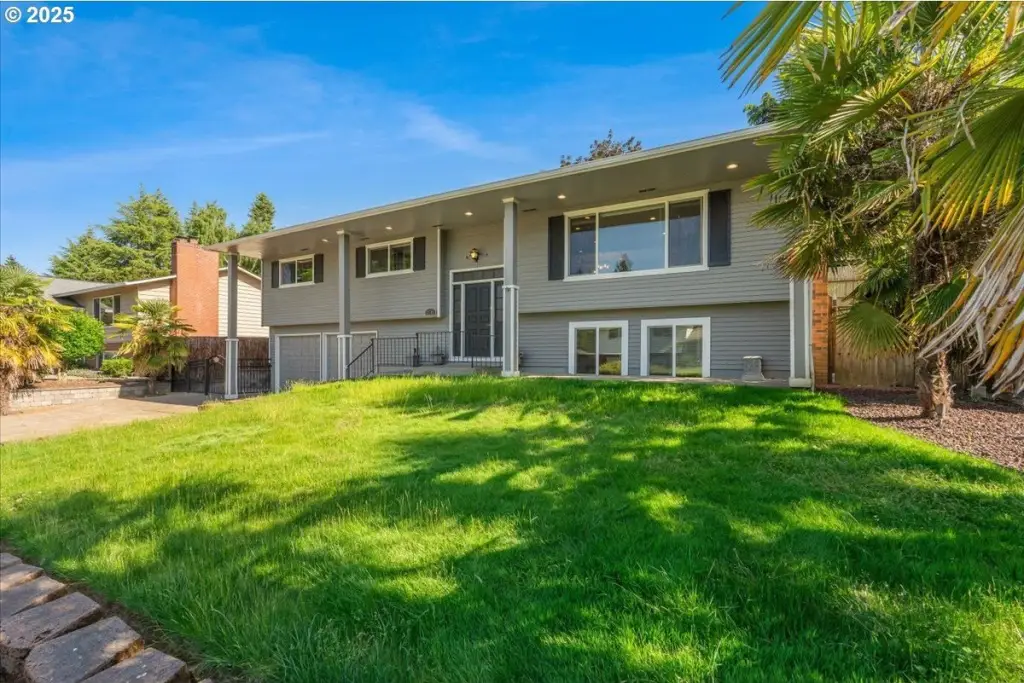
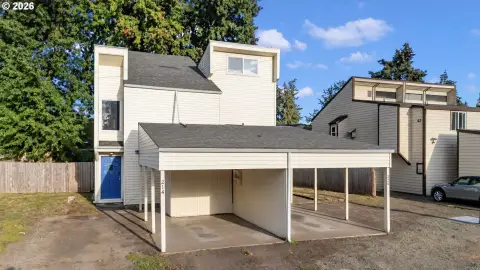
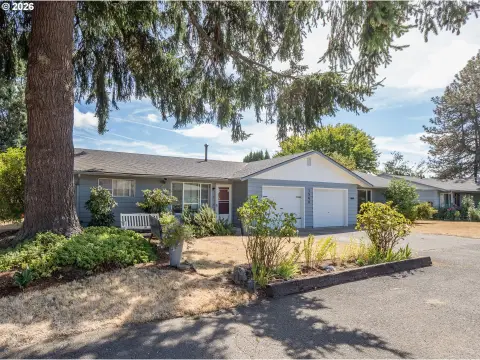
This 2,798-square-foot duplex, built in 1970, combines an updated interior with adaptable upper- and lower-level living areas. The main level includes an open kitchen with quartz counters, a large island, extensive cabinetry, formal dining, newer flooring, and a primary suite. The lower level has its own exterior entry, a remodeled kitchenette, five bedrooms, and two bathrooms. Widened doorways, broad hallways, and accessible bathrooms add practical functionality. Forced-air heating, central air, and a composition roof complete the core improvements.
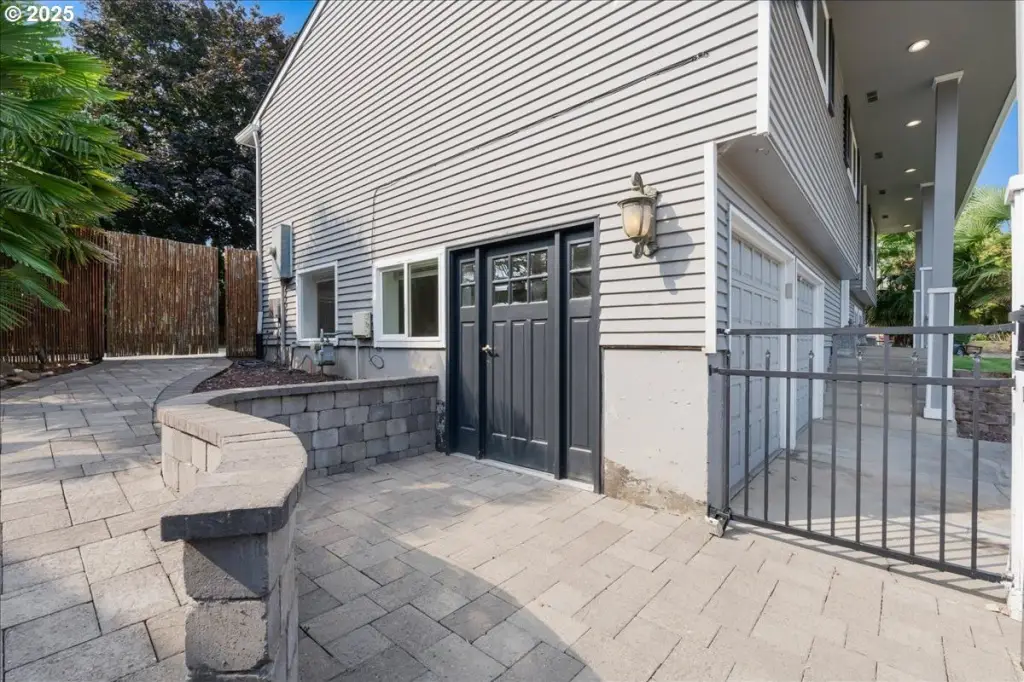
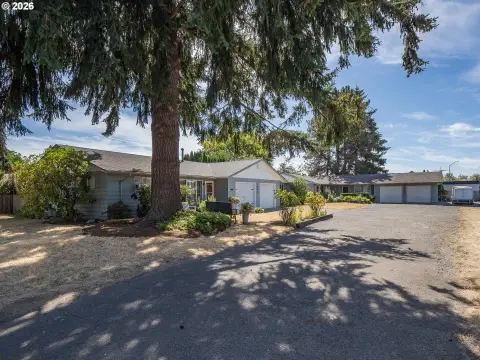
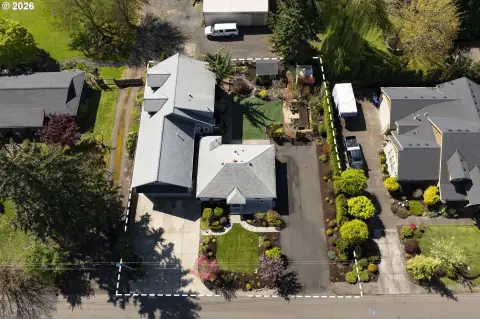
Outdoor features include a refinished deck, covered gazebo, finished lower patio, garden shed, and a fenced, landscaped 0.21-acre lot. The property is near parks, walking trails, retail, restaurants, schools, and hospitals, with access to Highway 26, Tualatin Valley Highway, and public transportation. Potential care or group-home applications are subject to buyer verification and applicable licensing requirements.
Outdoor features include a refinished deck, covered gazebo, finished lower patio, garden shed, and a fenced, landscaped 0.21-acre lot. The property is near parks, walking trails, retail, restaurants, schools, and hospitals, with access to Highway 26, Tualatin Valley Highway, and public transportation. Potential care or group-home applications are subject to buyer verification and applicable licensing requirements.
Key Highlights
- 2,798 SF duplex on a 0.21‑acre lot
- Eight bedrooms and four bathrooms
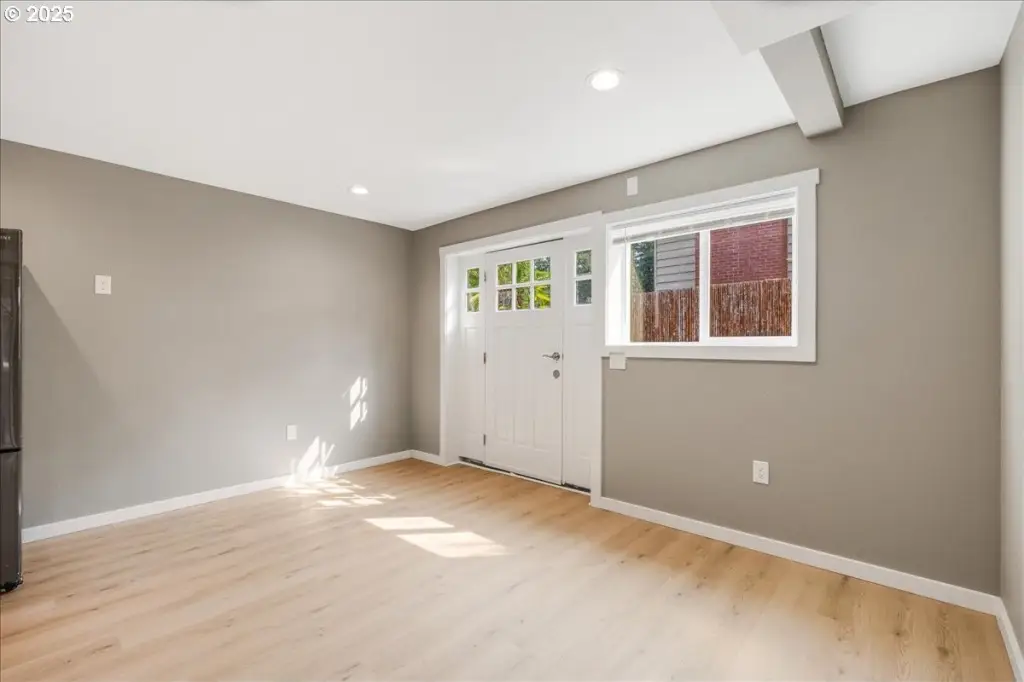
- Lower level includes separate exterior entrance and remodeled kitchenette
Financial Insights
Estimated NOI and Cap Rate
NOI / Yr
$42,022
Cap Rate
5.26%
Suggested Prices Based on Cap Rates
Cap Rate 5%
$840,440
$840.4K
Cap Rate 7%
$600,314
$600.3K
Cap Rate 9%
$466,911
$466.9K
Market Conditions
NOI Build-Up for 2,798 SF
Gross rent
$63.5K $22.68/SF
− Vacancy
−$3.4K −$1.22/SF
EGI
$60.0K $21.46/SF
− OpEx
−$18.0K −$6.44/SF
NOI
$42.0K $15.02/SF
Area
Hillsboro, OR
Vacancy
5.40%
Lease Rate
$22.68 /SF/Yr
Expense Ratio
30.00%
Simulate Cap Rate and NOI
Suggested Prices Based on Cap Rates
Cap Rate 5%
$840,440
Cap Rate 7%
$600,314
Cap Rate 9%
$466,911
Alternative Uses
Best Use
Multifamily LT 5
$600.3K
$525.3K – $700.4K
NOI $42,022 @ 7.0% cap · market cap 5.26%
Second Best
Apartment 5plus
$529.0K
$462.9K – $617.2K
NOI $37,029 @ 7.0% cap · market cap 4.63%
Theoretical Best
Office A
$751.4K
$657.5K – $876.6K
NOI $52,596 @ 7.0% cap · market cap 6.58%
Zoning and permitted uses should be independently verified with authorities.
How Realmo checks its estimates
Property Analytics
Unlock full access to Insights
Subscribe to Realmo Intelligence
Open Analytics
Current Use
Lease Details
Yes
Highway access
Location Intelligence
Trade Area within ½ mile
386
Businesses Nearby
Explore this area
Business Placement
Demographics for 97123, OR
48,369
Population
17,685
Households
2.7
Avg Household Size
37
Median Age
36%
College-Educated
87%
High-School Grad
55.7 sq mi
ZIP Area
868
Density / Sq Mi
$105,999
Median Household Income
$50,578
Median Earnings
$1,814
Median Rent
$489,100
Median Home Value
Check the figures for this property
Cap Rate, Value Estimation, Potential NOI and more
View Realmo Analytics
Market
Vacancy Rate% for Multifamily in West region

Questions? Ask Rey
Realmo’s AI knows this listing — price, zoning, demand, history. Ask anything.





Frequently Asked Questions
What type of property is this?
Duplex - Separate lower-level access, dual laundry areas, and accessibility features support varied living arrangements.
Where is this duplex located?
The property is located at 2706 SE SPRUCE St Hillsboro, OR.
What is the asking price?
The asking price for this property is $799,000.
What are key features of this property?
This property features: 2,798 SF duplex on a 0.21‑acre lot; Eight bedrooms and four bathrooms; Lower level includes separate exterior entrance and remodeled kitchenette


