Flexible Industrial Property with Two
For Sale
$1,115,000
2676 Van Giesen St, Richland, WA 99354
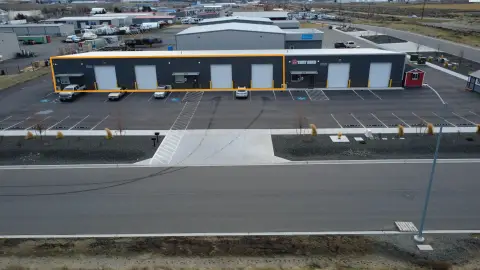
Two industrial buildings on five parcels include fenced yard access with multiple security gates.
Property Size13,044 SF
Price / SF$85.48
Days on Market146
Property Features for 2676 Van Giesen St
General Information
Standard status
Active
Size
13,044 SF
Zoning
C3
Site & Location
Traffic Count
18,000 vehicles/day
Fenced Yard
Yes
Additional Details
Service Bays
5
Taxes and HOA fees
Annual Taxes
$8,088
Listing Agency:
Berkshire Hathaway Hm Serv Central WA Real Estate
(509) 563-5117
Listed By:
Shannon Jones · License #25020870
(509) 254-3447
Source:
Exprealty
Added: May 30
Changed: Oct 8
Last Checked: Oct 20 at 10:03PM
Displayed information is deemed reliable but is not guaranteed and should be independently verified. All listing content including descriptions, pricing, images are the copyrighted material of Berkshire Hathaway Hm Serv Central WA Real Estate

Ask AI about this property
Review the available facts, identify missing information and prepare questions for the agent.
Investment Insights
Based on property information with market context.
This for-sale industrial property includes two buildings separated by parcels and set on five parcels. The site is zoned C3 general business use and is currently in Zone B, with no flood prevention measures required per the provided remarks. Over three-quarters of the property is fenced and secured with three large security gates. The property is being sold in as-is condition.
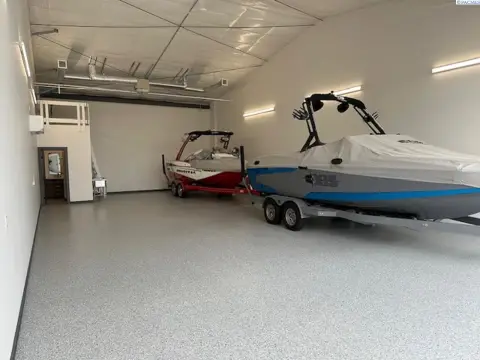
Building 1, closest to Van Giesen St, totals 8,360 SF and is constructed primarily with CMU walls and a metal screw-down roof on a concrete slab. The layout includes a full glass-front service desk area, an office, a five-bay service area, and an additional 2,400 SF of open floor space at the rear, along with a separate employee break room and mechanical room. There are two bathrooms (no shower), plus two separate second-floor areas consisting of a 400 SF loft and a 270 SF mezzanine. Building 2 totals 4,684 SF and is similar in construction, with small office, bathroom, and mechanical/storage rooms that remain unfinished, plus a 272 SF upstairs mezzanine.
Site utilities include a private well, septic system, and drain field. The north perimeter is adjacent to an 18-hole golf course (Buckskin Golf Course), and the property is located less than one-quarter mile west of Bypass Highway 240 and less than two miles east of the City of West Richland, based on the remarks provided.
Building 1, closest to Van Giesen St, totals 8,360 SF and is constructed primarily with CMU walls and a metal screw-down roof on a concrete slab. The layout includes a full glass-front service desk area, an office, a five-bay service area, and an additional 2,400 SF of open floor space at the rear, along with a separate employee break room and mechanical room. There are two bathrooms (no shower), plus two separate second-floor areas consisting of a 400 SF loft and a 270 SF mezzanine. Building 2 totals 4,684 SF and is similar in construction, with small office, bathroom, and mechanical/storage rooms that remain unfinished, plus a 272 SF upstairs mezzanine.
Site utilities include a private well, septic system, and drain field. The north perimeter is adjacent to an 18-hole golf course (Buckskin Golf Course), and the property is located less than one-quarter mile west of Bypass Highway 240 and less than two miles east of the City of West Richland, based on the remarks provided.
Key Highlights
- Commercial property on five parcels zoned C3 (general business use), currently in Zone B, with flexible development potential
- Two buildings totaling 13,044 SF: 8,360 SF and 4,684 SF, sold in as‑is condition
- Fenced site with 3 large security gates and yard access across the property
Financial Insights
Estimated NOI and Cap Rate
NOI / Yr
$81,566
Cap Rate
7.32%
Suggested Prices Based on Cap Rates
Cap Rate 5%
$1,631,320
$1.6M
Cap Rate 7%
$1,165,229
$1.2M
Cap Rate 9%
$906,289
$906.3K
Market Conditions
NOI Build-Up for 13,044 SF
Gross rent
$104.9K $8.04/SF
− Vacancy
−$8.9K −$0.68/SF
EGI
$96.0K $7.36/SF
− OpEx
−$14.4K −$1.10/SF
NOI
$81.6K $6.25/SF
Area
Benton County, WA
Vacancy
8.50%
Lease Rate
$8.04 /SF/Yr
Expense Ratio
15.00%
Simulate Cap Rate and NOI
Suggested Prices Based on Cap Rates
Cap Rate 5%
$1,631,320
Cap Rate 7%
$1,165,229
Cap Rate 9%
$906,289
Alternative Uses
Best Use
Flex RnD
$1.48M
$1.29M – $1.72M
NOI $103,412 @ 7.0% cap · market cap 9.27%
Second Best
Warehouse
$1.17M
$1.02M – $1.36M
NOI $81,566 @ 7.0% cap · market cap 7.32%
Theoretical Best
Office A
$3.62M
$3.17M – $4.22M
NOI $253,255 @ 7.0% cap · market cap 22.71%
Zoning and permitted uses should be independently verified with authorities.
How Realmo checks its estimates
Property Analytics
Unlock full access to Insights
Subscribe to Realmo Intelligence
Open Analytics
Current Use
Lease Details
5
Service bays
18,000 VPD
Traffic count
Yes
Fenced yard
Location Intelligence
Trade Area within ½ mile
153
Businesses Nearby
Balanced
Demand for This Use
Explore this area
Business Placement
Demographics for 99354, WA
24,839
Population
10,807
Households
2.3
Avg Household Size
37
Median Age
42%
College-Educated
97%
High-School Grad
23.9 sq mi
ZIP Area
1,039
Density / Sq Mi
$88,601
Median Household Income
$50,192
Median Earnings
$1,299
Median Rent
$355,400
Median Home Value
Check the figures for this property
Cap Rate, Value Estimation, Potential NOI and more
View Realmo Analytics
Market
Vacancy Rate% for Industrial in West region


Frequently Asked Questions
What type of property is this?
Flex space - Two industrial buildings on five parcels include fenced yard access with multiple security gates.
Where is this flex space located?
The property is located at 2676 Van Giesen St Richland, WA.
What is the asking price?
The asking price for this property is $1,115,000.
What are key features of this property?
This property features: Commercial property on five parcels zoned C3 (general business use), currently in Zone B, with flexible development potential; Two buildings totaling 13,044 SF: 8,360 SF and 4,684 SF, sold in as‑is condition; Fenced site with 3 large security gates and yard access across the property