Victorian Duplex with Private
For Sale
$634,900
2616 SE Pine St, Portland, OR 97214
Two separately entered apartments combine period character with updated finishes and shared basement amenities.
Property Size1,393 SF
Price / SF$455.78
Days on Market51
Property Features for 2616 SE Pine St
General Information
Standard status
Active
Size
1,393 SF
Property subtype
Multi-Family
Building Details
Year Built
1898
Listing Agency:
Constant Commercial Real Estate Inc
Listed By:
Cory Carlson · License #201226331
(503) 222-0282
Source:
Wisser
Added: Aug 26
Changed: Oct 2
Last Checked: Oct 5 at 10:28PM
Displayed information is deemed reliable but is not guaranteed and should be independently verified. All listing content including descriptions, pricing, images are the copyrighted material of Constant Commercial Real Estate Inc
Investment Insights
Based on property information with market context.
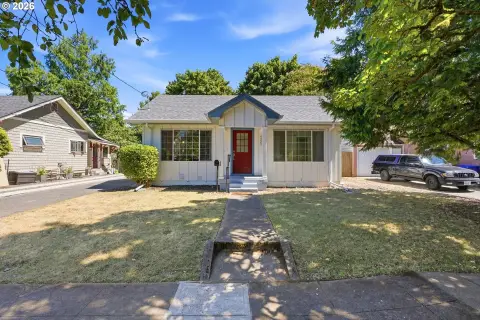
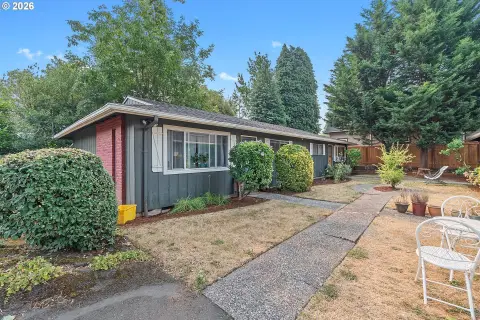
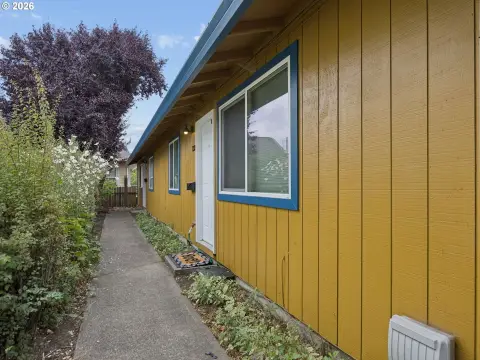
Built in 1898, this two-unit Victorian property contains a 1 bed / 1 bath apartment on each level. The lower residence measures 740 sq ft and has been refreshed with new paint, wood-look flooring, a white shaker kitchen, pantry storage, an updated full bath, and a screened porch entry. The 650 sq ft upper unit retains period detailing that includes arched openings, picture rails, deep window casings, and bay windows in both the living room and kitchen. Each apartment has its own entrance.
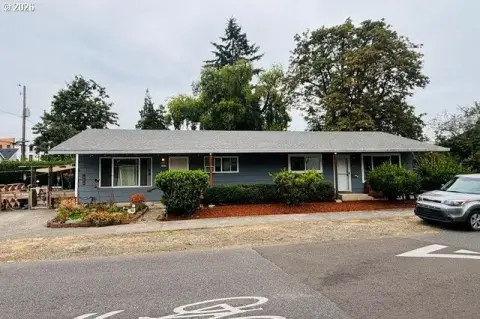
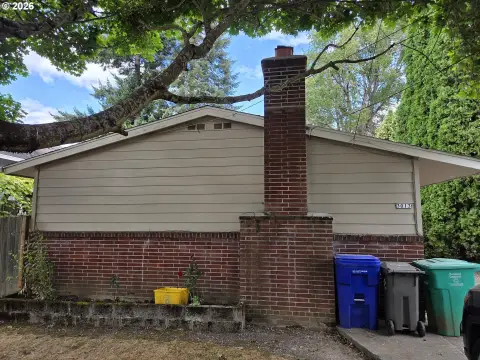
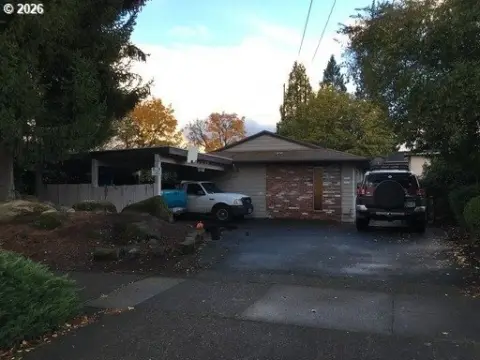
The property includes a private driveway, detached garage, fenced yard, and mature trees. A full basement provides shared laundry along with workshop and storage areas. The lower unit is vacant, while the upper unit is occupied. The address is on SE Pine St in Portland’s Kerns area, near the SE 28th Avenue restaurant and coffee corridor and minutes from the Central Eastside.
The property includes a private driveway, detached garage, fenced yard, and mature trees. A full basement provides shared laundry along with workshop and storage areas. The lower unit is vacant, while the upper unit is occupied. The address is on SE Pine St in Portland’s Kerns area, near the SE 28th Avenue restaurant and coffee corridor and minutes from the Central Eastside.
Key Highlights
- Two‑unit Victorian property built in 1898
- Two 1 bed / 1 bath units measuring 740 sq ft and 650 sq ft
- Private entrances serve both apartments
Financial Insights
Estimated NOI and Cap Rate
NOI / Yr
$19,412
Cap Rate
3.06%
Suggested Prices Based on Cap Rates
Cap Rate 5%
$388,240
$388.2K
Cap Rate 7%
$277,314
$277.3K
Cap Rate 9%
$215,689
$215.7K
Market Conditions
NOI Build-Up for 1,393 SF
Gross rent
$29.3K $21.00/SF
− Vacancy
−$1.5K −$1.09/SF
EGI
$27.7K $19.91/SF
− OpEx
−$8.3K −$5.97/SF
NOI
$19.4K $13.94/SF
Area
Portland, OR
Vacancy
5.20%
Lease Rate
$21.00 /SF/Yr
Expense Ratio
30.00%
Simulate Cap Rate and NOI
Suggested Prices Based on Cap Rates
Cap Rate 5%
$388,240
Cap Rate 7%
$277,314
Cap Rate 9%
$215,689
Alternative Uses
Best Use
Multifamily LT 5
$277.3K
$242.7K – $323.5K
NOI $19,412 @ 7.0% cap · market cap 3.06%
Second Best
Apartment 5plus
$255.5K
$223.6K – $298.1K
NOI $17,886 @ 7.0% cap · market cap 2.82%
Theoretical Best
Office A
$391.2K
$342.3K – $456.4K
NOI $27,383 @ 7.0% cap · market cap 4.31%
Zoning and permitted uses should be independently verified with authorities.
How Realmo checks its estimates
Property Analytics
Unlock full access to Insights
Subscribe to Realmo Intelligence
Open Analytics
Current Use
Location Intelligence
Trade Area within ½ mile
2,927
Businesses Nearby
Explore this area
Business Placement
Demographics for 97214, OR
28,403
Population
15,948
Households
1.8
Avg Household Size
36
Median Age
67%
College-Educated
98%
High-School Grad
2.9 sq mi
ZIP Area
9,794
Density / Sq Mi
$86,879
Median Household Income
$55,643
Median Earnings
$1,628
Median Rent
$733,200
Median Home Value
Check the figures for this property
Cap Rate, Value Estimation, Potential NOI and more
View Realmo Analytics
Market
Vacancy Rate% for Multifamily in West region

Questions? Ask Rey
Realmo’s AI knows this listing — price, zoning, demand, history. Ask anything.






Frequently Asked Questions
What type of property is this?
Duplex - Two separately entered apartments combine period character with updated finishes and shared basement amenities.
Where is this duplex located?
The property is located at 2616 SE Pine St Portland, OR.
What is the asking price?
The asking price for this property is $634,900.
What are key features of this property?
This property features: Two‑unit Victorian property built in 1898; Two 1 bed / 1 bath units measuring 740 sq ft and 650 sq ft; Private entrances serve both apartments


