Fully Renovated Triplex with Bonus
For Sale
$350,000
2600 Zinow Street, Hamtramck, MI 48212
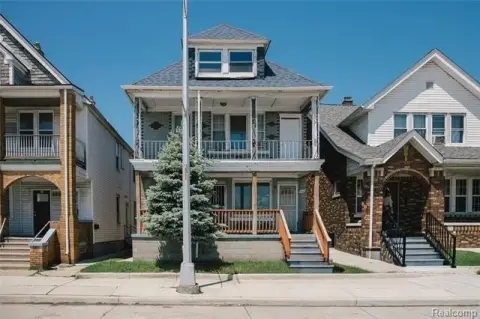
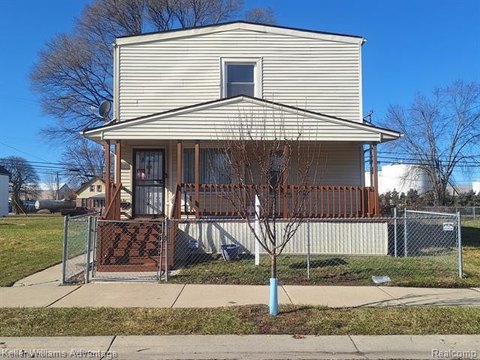
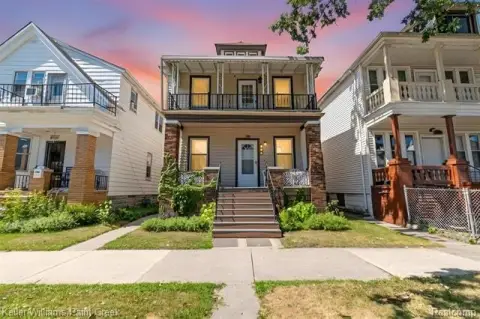
Three income-producing units with 2024 renovations, including two separate 2-bedroom apartments and a rear 1-bedroom rental.
Property SizeContact for details
Days on Market100
Property Features for 2600 Zinow Street
General Information
Standard status
Active
Property subtype
Multi Family
Listing Agency:
Real Estate One-Southgate
(734) 284-5400
Listed By:
Joanne Taylor
Source:
Corneliusteam
Added: Jun 17
Changed: Sep 12
Last Checked: Sep 22 at 4:10PM
Displayed information is deemed reliable but is not guaranteed and should be independently verified. All listing content including descriptions, pricing, images are the copyrighted material of Real Estate One-Southgate
Investment Insights
Based on property information with market context.
This fully renovated triplex-style property includes a restored 2-bedroom apartment on the upper level, a light-filled 2-bedroom apartment on the lower level, and a standalone 1-bedroom bonus rental home located at the rear of the property. Improvements completed in 2024 include new kitchens and baths, drywall, hardwood flooring, plumbing, electrical, and HVAC, along with interior and exterior painting. The roof and windows were previously updated in 2016. Laundry hookups are provided in the basement, and the rear building has its own private laundry hookups.
Located in Hamtramck, the property is described as very walkable to neighborhood destinations, with some transit availability and bikeability. It is also noted to be about a 10-minute ride from downtown Detroit, making it practical for residents who want convenient access to both local amenities and the city.
All units are currently leased on yearly terms, with tenants in good standing who want to remain. The layout supports a variety of ownership approaches, including an investor purchase focused on collecting rental income or an owner-occupant option where you can live in one unit while renting the others. Current tenancy and recent capital improvements help reduce near-term maintenance concerns for day-to-day operations.
Located in Hamtramck, the property is described as very walkable to neighborhood destinations, with some transit availability and bikeability. It is also noted to be about a 10-minute ride from downtown Detroit, making it practical for residents who want convenient access to both local amenities and the city.
All units are currently leased on yearly terms, with tenants in good standing who want to remain. The layout supports a variety of ownership approaches, including an investor purchase focused on collecting rental income or an owner-occupant option where you can live in one unit while renting the others. Current tenancy and recent capital improvements help reduce near-term maintenance concerns for day-to-day operations.
Key Highlights
- Three income‑producing units: two 2‑bedroom apartments plus a standalone rear 1‑bedroom rental.
- Fully renovated in 2024 with new kitchens, baths, drywall, hardwood flooring, plumbing, electrical, and HVAC.
- Roof replaced in 2016; windows updated in 2016; exterior and interior paint completed.
Property Analytics
Unlock full access to Insights
Subscribe to Realmo Intelligence
Open Analytics
Current Use
Location Intelligence
Trade Area within ½ mile
1,243
Businesses Nearby
Explore this area
Business Placement
Demographics for 48212, MI
43,192
Population
14,739
Households
2.9
Avg Household Size
29
Median Age
16%
College-Educated
68%
High-School Grad
5.3 sq mi
ZIP Area
8,149
Density / Sq Mi
$37,293
Median Household Income
$28,894
Median Earnings
$935
Median Rent
$98,200
Median Home Value
Check the figures for this property
Cap Rate, Value Estimation, Potential NOI and more
View Realmo Analytics
Market
Vacancy Rate% for Multifamily in Midwest region

Questions? Ask Rey
Realmo’s AI knows this listing — price, zoning, demand, history. Ask anything.




Frequently Asked Questions
What type of property is this?
Triplex - Three income-producing units with 2024 renovations, including two separate 2-bedroom apartments and a rear 1-bedroom rental.
Where is this triplex located?
The property is located at 2600 Zinow Street Hamtramck, MI.
What is the asking price?
The asking price for this property is $350,000.
What are key features of this property?
This property features: Three income‑producing units: two 2‑bedroom apartments plus a standalone rear 1‑bedroom rental.; Fully renovated in 2024 with new kitchens, baths, drywall, hardwood flooring, plumbing, electrical, and HVAC.; Roof replaced in 2016; windows updated in 2016; exterior and interior paint completed.


