Storefront Property with Retail
For Sale
$200,000
2600 Reading Rd, Cincinnati, OH 45206
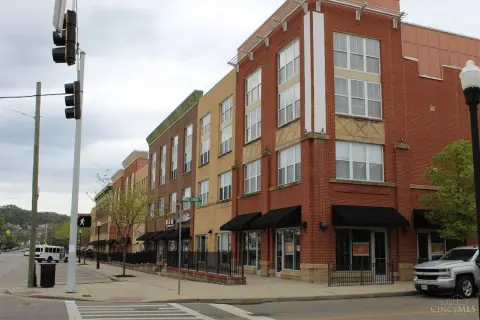
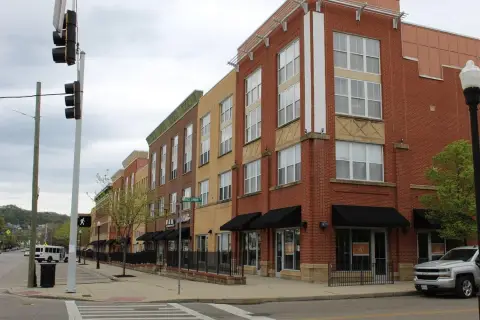
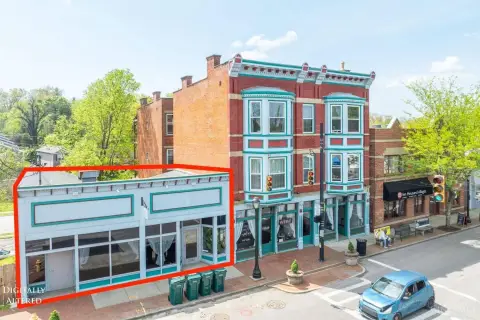
Compact commercial space offers visibility from Reading Rd for retail-oriented operations.
Property Size954 SF
Price / SF$209.64
Days on Market79
Property Features for 2600 Reading Rd
General Information
Standard status
Active
Size
954 SF
Listing Agency:
Epique Inc.
Listed By:
Christopher Swain
3820794
Source:
Lovdalgroup
Added: Jul 29
Changed: Oct 9
Last Checked: Oct 15 at 1:05AM
Displayed information is deemed reliable but is not guaranteed and should be independently verified. All listing content including descriptions, pricing, images are the copyrighted material of Epique Inc.
Investment Insights
Based on property information with market context.
Located at 2600 Reading Rd in Cincinnati, this storefront property provides 954 square feet in a compact commercial format. The space is positioned for small-scale retail, service boutique, coffee, and quick-serve concepts, with the property’s commercial designation and zoning supporting flexible retail use.
Visibility from Reading Rd traffic connects the property with nearby local commercial nodes. The storefront may also support prominent unit signage, subject to municipal sign code requirements. Its limited footprint provides a focused setting for operators seeking a smaller retail or service location.
Visibility from Reading Rd traffic connects the property with nearby local commercial nodes. The storefront may also support prominent unit signage, subject to municipal sign code requirements. Its limited footprint provides a focused setting for operators seeking a smaller retail or service location.
Key Highlights
- 954 sq ft compact storefront property
- Commercial designation and zoning support flexible retail use
- Visibility from Reading Rd traffic
Financial Insights
Estimated NOI and Cap Rate
NOI / Yr
$10,999
Cap Rate
5.50%
Suggested Prices Based on Cap Rates
Cap Rate 5%
$219,980
$220.0K
Cap Rate 7%
$157,129
$157.1K
Cap Rate 9%
$122,211
$122.2K
Market Conditions
NOI Build-Up for 954 SF
Gross rent
$17.2K $18.00/SF
− Vacancy
−$1.5K −$1.53/SF
EGI
$15.7K $16.47/SF
− OpEx
−$4.7K −$4.94/SF
NOI
$11.0K $11.53/SF
Area
Cincinnati, OH
Vacancy
8.50%
Lease Rate
$18.00 /SF/Yr
Expense Ratio
30.00%
Simulate Cap Rate and NOI
Suggested Prices Based on Cap Rates
Cap Rate 5%
$219,980
Cap Rate 7%
$157,129
Cap Rate 9%
$122,211
Alternative Uses
Best Use
Retail
$157.1K
$137.5K – $183.3K
NOI $10,999 @ 7.0% cap · market cap 5.50%
Second Best
—
—
no second resolved use
Theoretical Best
Office A
$189.6K
$165.9K – $221.3K
NOI $13,275 @ 7.0% cap · market cap 6.64%
Zoning and permitted uses should be independently verified with authorities.
How Realmo checks its estimates
Property Analytics
Unlock full access to Insights
Subscribe to Realmo Intelligence
Open Analytics
Current Use
Location Intelligence
Trade Area within ½ mile
4,165
Businesses Nearby
Under-served
Demand for This Use
Explore this area
Business Placement
Demographics for 45206, OH
10,670
Population
7,191
Households
1.5
Avg Household Size
37
Median Age
49%
College-Educated
87%
High-School Grad
2.0 sq mi
ZIP Area
5,335
Density / Sq Mi
$51,128
Median Household Income
$44,936
Median Earnings
$849
Median Rent
$269,900
Median Home Value
Check the figures for this property
Cap Rate, Value Estimation, Potential NOI and more
View Realmo Analytics
Market
Vacancy Rate% for Retail in Cincinnati, OH

Questions? Ask Rey
Realmo’s AI knows this listing — price, zoning, demand, history. Ask anything.




Similar Off Market Nearby
- Kroger Floral — 1 W Corry St, Cincinnati, OH 45219
- Abbey Florist — 3209 Jefferson Ave, Cincinnati, OH 45220
Frequently Asked Questions
What type of property is this?
Storefront property - Compact commercial space offers visibility from Reading Rd for retail-oriented operations.
Where is this storefront property located?
The property is located at 2600 Reading Rd Cincinnati, OH.
What is the asking price?
The asking price for this property is $200,000.
What are key features of this property?
This property features: 954 sq ft compact storefront property; Commercial designation and zoning support flexible retail use; Visibility from Reading Rd traffic


