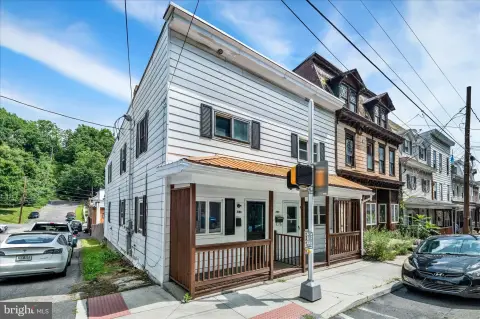
7-Unit Apartment
For Sale
$525,000
255 SUNBURY STREET, Minersville, PA 17954
Fully occupied units feature utility upgrades and tenant-paid electric heat.
Property Size3,588 SF
Price / SF$146.32
Days on Market54
Property Features for 255 SUNBURY STREET
General Information
Standard status
Active
Size
3,588 SF
Property subtype
Commercial
Occupancy
100%
Additional Details
Multifamily Units
7
Building Details
Year Built
1860
Buildings
1
Listing Agency:
Century 21 Gold
(610) 779-2500
Listed By:
Emily Martini · License #RS374422
(484) 319-0979
Source:
Cummingsrealtors
Added: Aug 25
Changed: Oct 16
Last Checked: Oct 16 at 8:38AM
Displayed information is deemed reliable but is not guaranteed and should be independently verified. All listing content including descriptions, pricing, images are the copyrighted material of Century 21 Gold

Ask AI about this property
Review the available facts, identify missing information and prepare questions for the agent.
Investment Insights
Based on property information with market context.
This 7-unit apartment building was constructed in 1860 and has received repairs and utility improvements throughout the units. Electric heat is paid by tenants, while each apartment has its own water heater and separate water meter. The building is fully occupied, providing an established rental operation rather than a vacancy repositioning project.
Located at 255 Sunbury Street in Minersville, Pennsylvania, the property combines multiple rental units under one address. Separate water infrastructure also supports the possibility of allocating water charges by apartment in the future. The reported annual return is 9.75%.
Located at 255 Sunbury Street in Minersville, Pennsylvania, the property combines multiple rental units under one address. Separate water infrastructure also supports the possibility of allocating water charges by apartment in the future. The reported annual return is 9.75%.
Key Highlights
- 7‑unit apartment building at 255 Sunbury Street, Minersville, PA 17954
- Fully occupied with no stated vacancies
- Each unit has received repairs and utility upgrades
Financial Insights
Estimated NOI and Cap Rate
NOI / Yr
$19,630
Cap Rate
3.74%
Suggested Prices Based on Cap Rates
Cap Rate 5%
$392,600
$392.6K
Cap Rate 7%
$280,429
$280.4K
Cap Rate 9%
$218,111
$218.1K
Market Conditions
NOI Build-Up for 3,588 SF
Gross rent
$37.9K $10.56/SF
− Vacancy
−$2.2K −$0.61/SF
EGI
$35.7K $9.95/SF
− OpEx
−$16.1K −$4.48/SF
NOI
$19.6K $5.47/SF
Area
Schuylkill County, PA
Vacancy
5.80%
Lease Rate
$10.56 /SF/Yr
Expense Ratio
45.00%
Simulate Cap Rate and NOI
Suggested Prices Based on Cap Rates
Cap Rate 5%
$392,600
Cap Rate 7%
$280,429
Cap Rate 9%
$218,111
Alternative Uses
Best Use
Apartment 5plus
$280.4K
$245.4K – $327.2K
NOI $19,630 @ 7.0% cap · market cap 3.74%
Second Best
—
—
no second resolved use
Theoretical Best
Office A
$538.2K
$470.9K – $627.9K
NOI $37,674 @ 7.0% cap · market cap 7.18%
Zoning and permitted uses should be independently verified with authorities.
How Realmo checks its estimates
Property Analytics
Current Use
Lease Details
7
Residential units
100%
Occupancy
Location Intelligence
Trade Area within ½ mile
328
Businesses Nearby
Explore this area
Business Placement
Demographics for 17954, PA
4,606
Population
2,290
Households
2
Avg Household Size
40
Median Age
14%
College-Educated
82%
High-School Grad
0.7 sq mi
ZIP Area
6,580
Density / Sq Mi
$56,736
Median Household Income
$36,719
Median Earnings
$737
Median Rent
$81,800
Median Home Value
Market
Vacancy Rate% for Multifamily in Northeast region




Frequently Asked Questions
What type of property is this?
Apartment building - Fully occupied units feature utility upgrades and tenant-paid electric heat.
Where is this apartment building located?
The property is located at 255 SUNBURY STREET Minersville, PA.
What is the asking price?
The asking price for this property is $525,000.
What are key features of this property?
This property features: 7‑unit apartment building at 255 Sunbury Street, Minersville, PA 17954; Fully occupied with no stated vacancies; Each unit has received repairs and utility upgrades


