Professional Office Building with
For Sale
$779,000
2535 Ceanothus, Chico, CA 95973
Commercial Sale, Chico, CA
Property Size3,000 SF
Price / SF$259.67
Days on Market217
Property Features for 2535 Ceanothus
General Information
Property type
Residential
Property subtype
Office
Directions
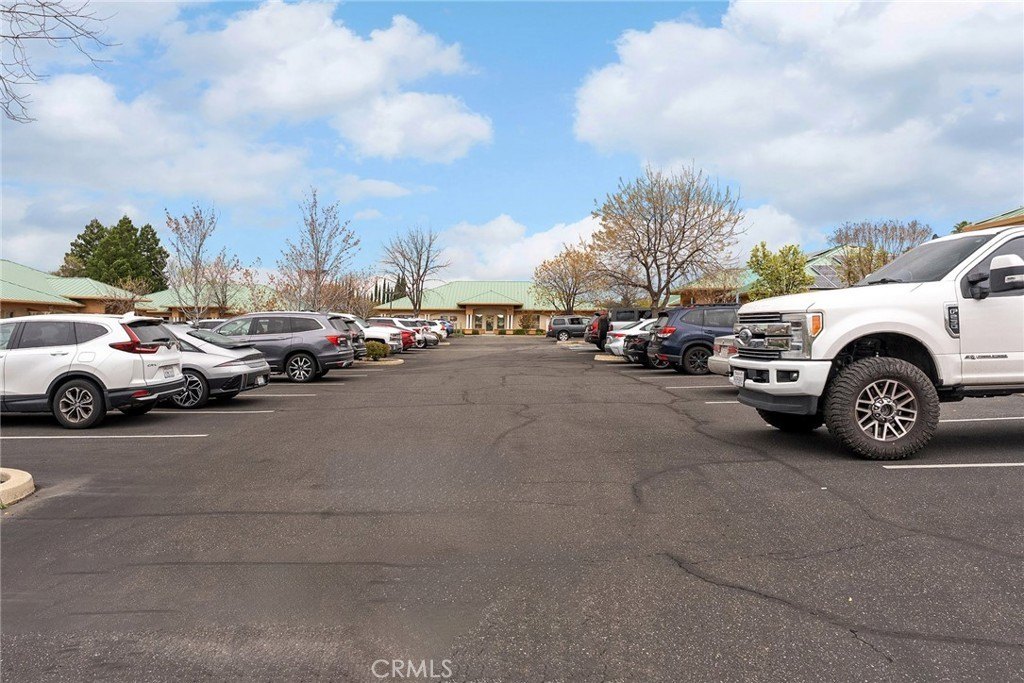
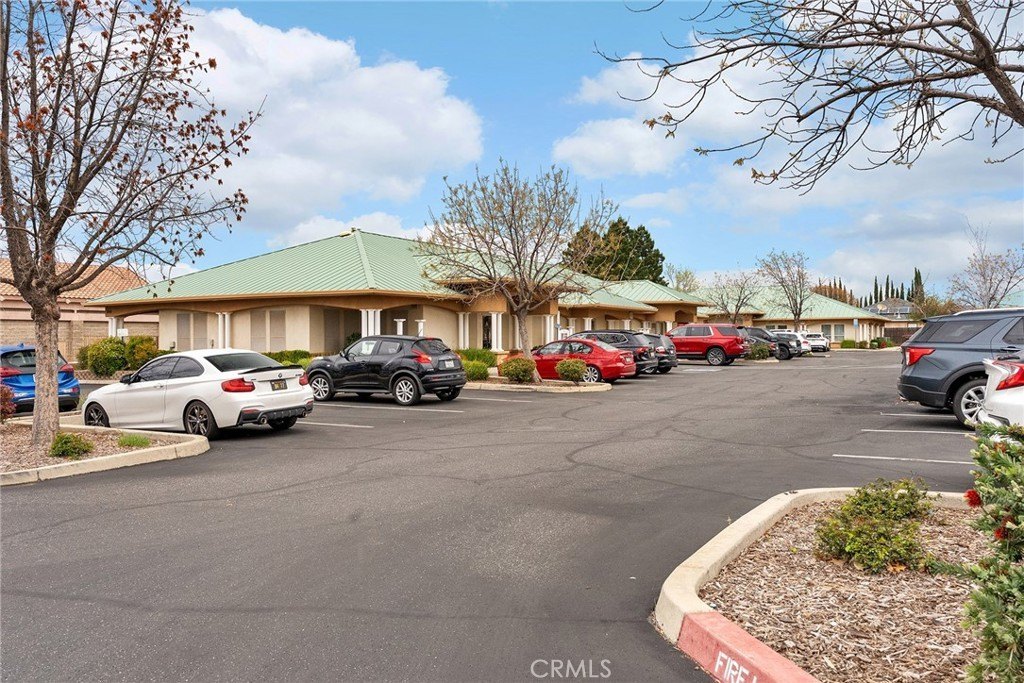
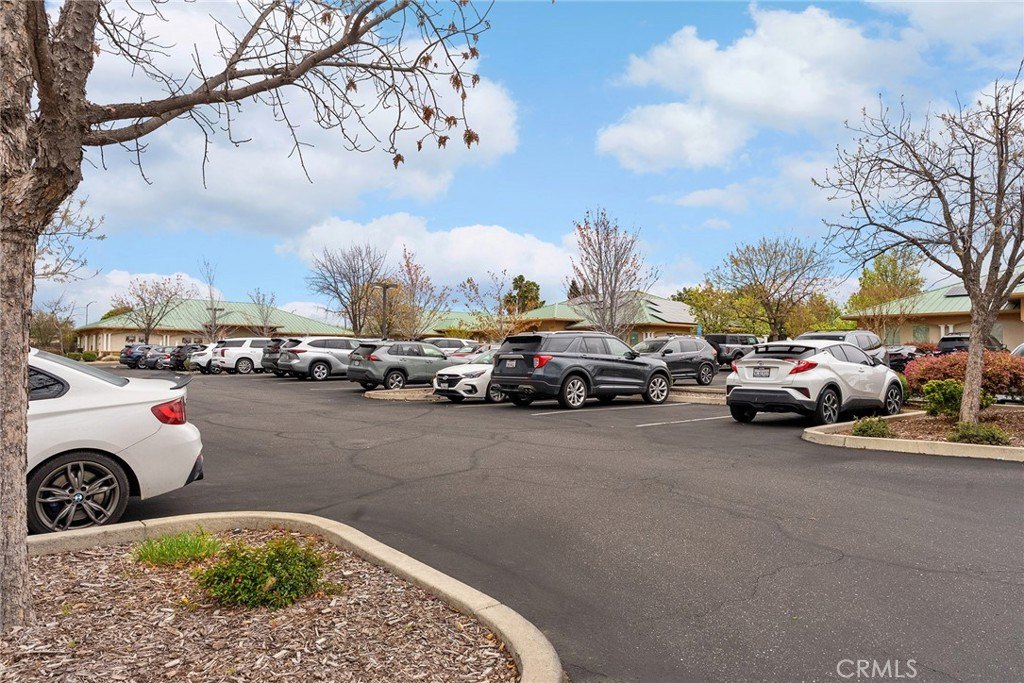
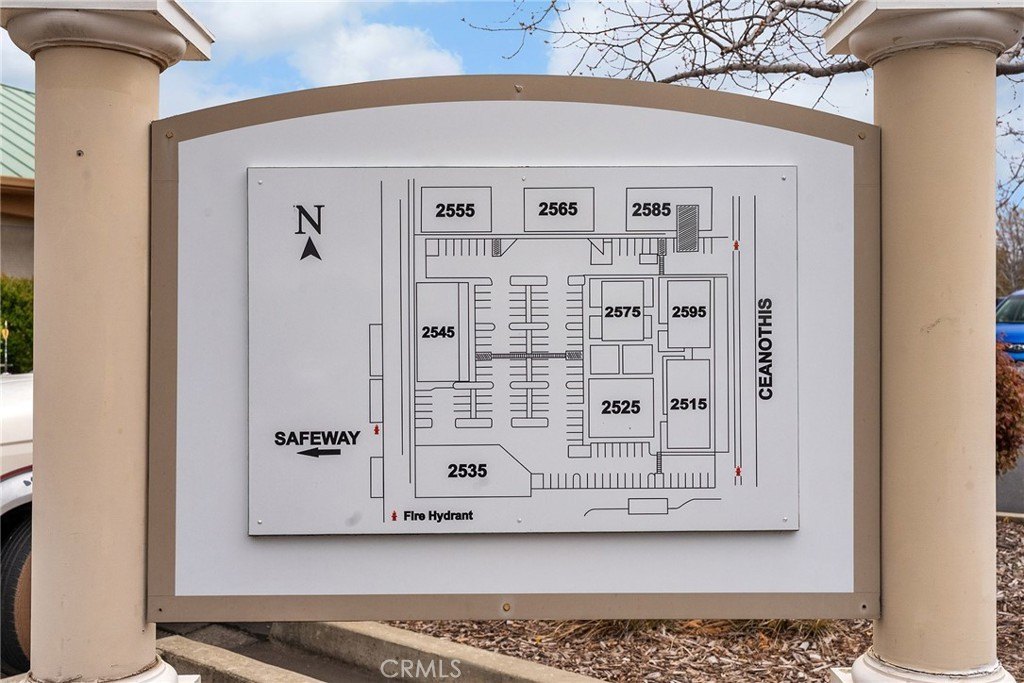
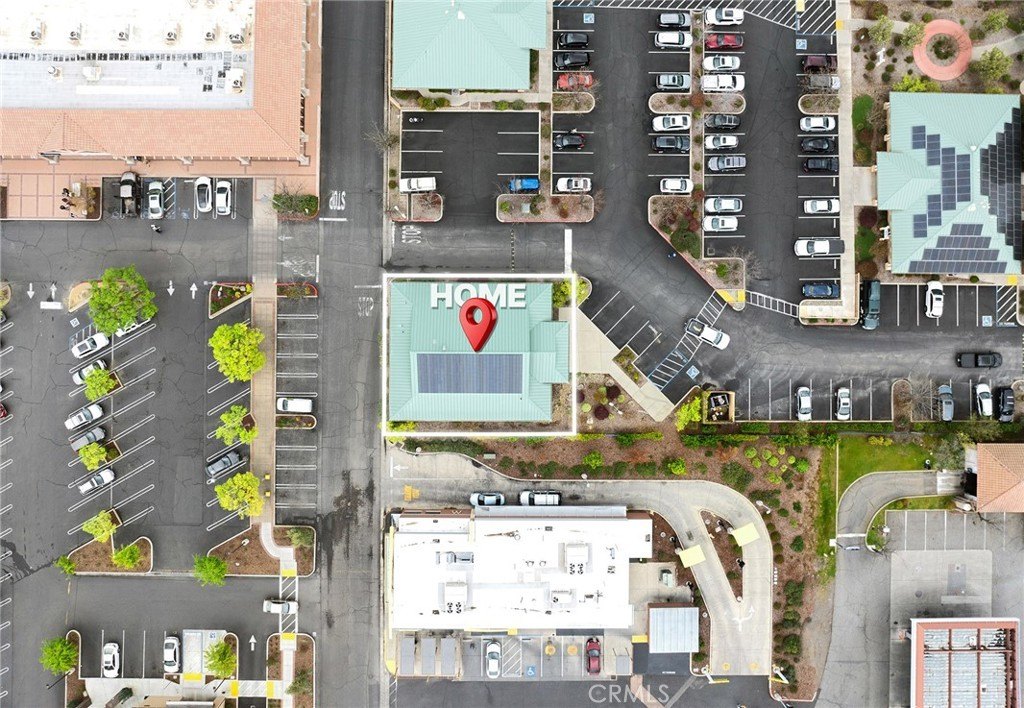
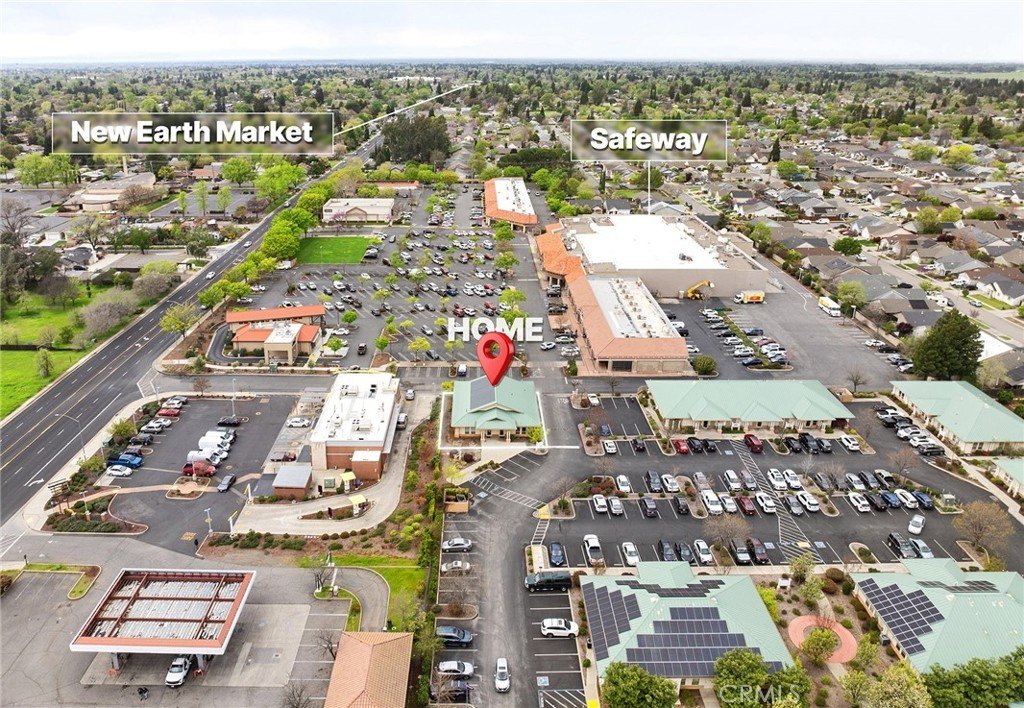
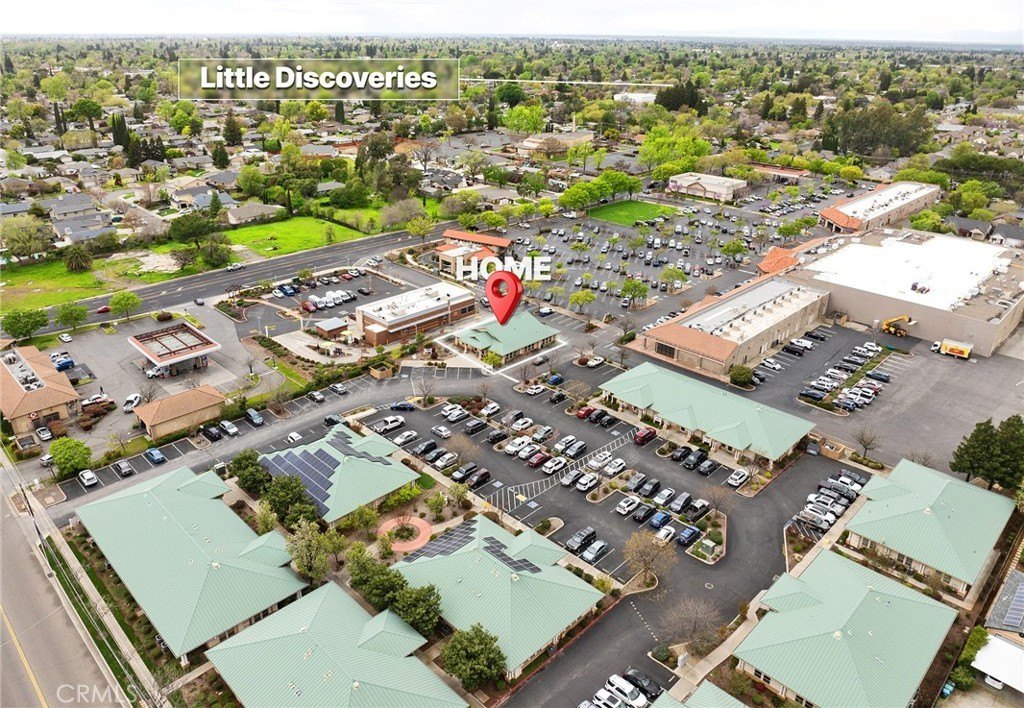
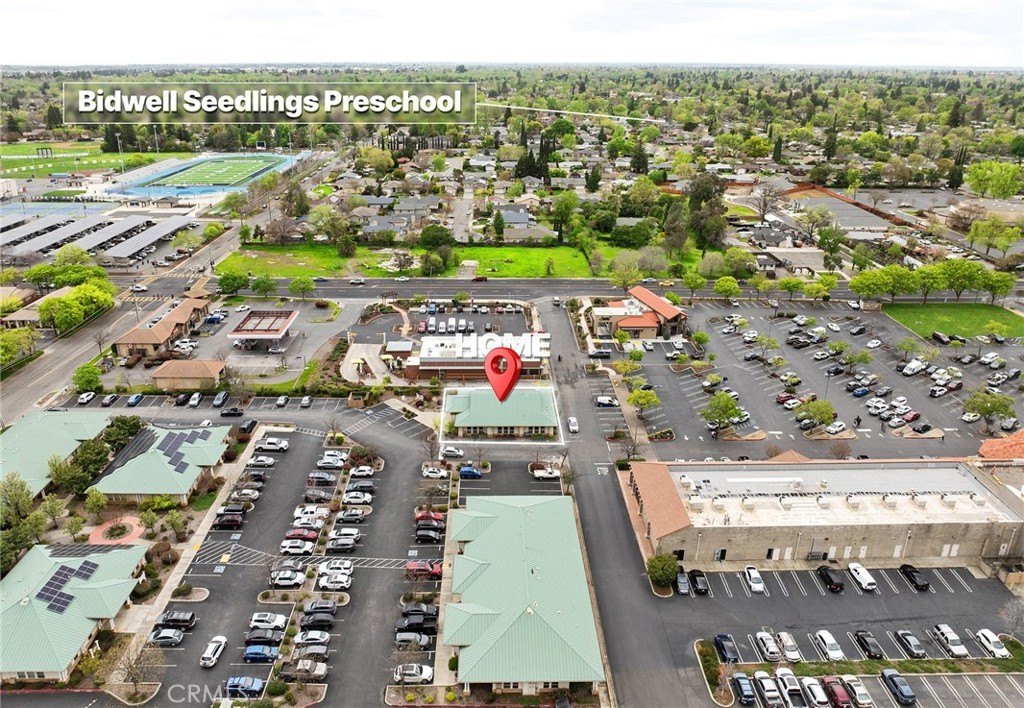
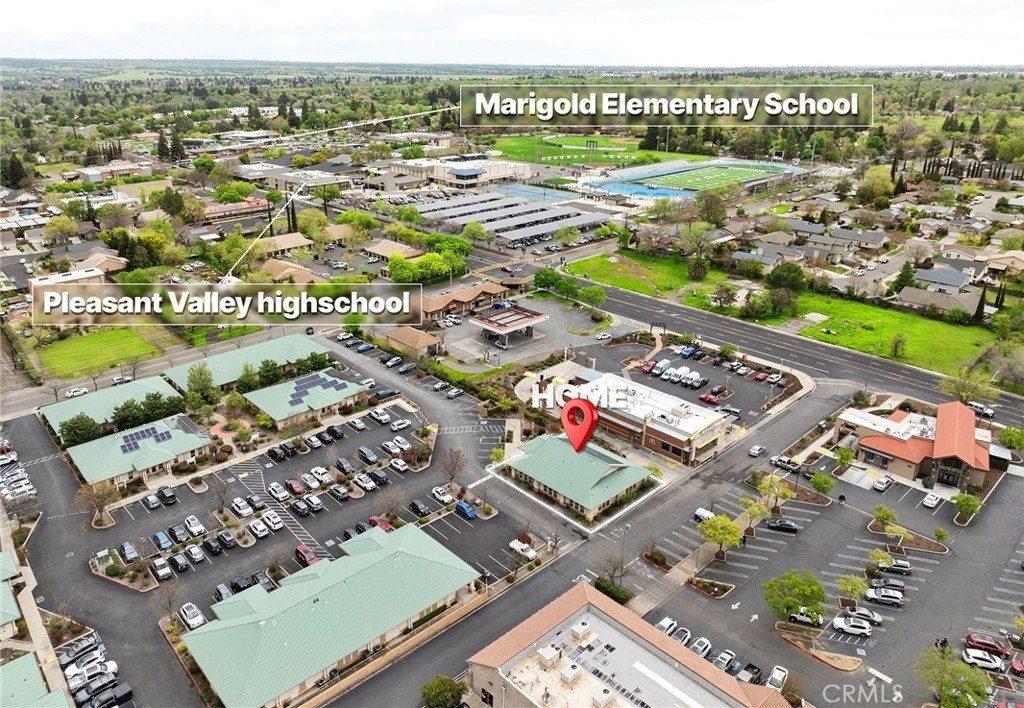
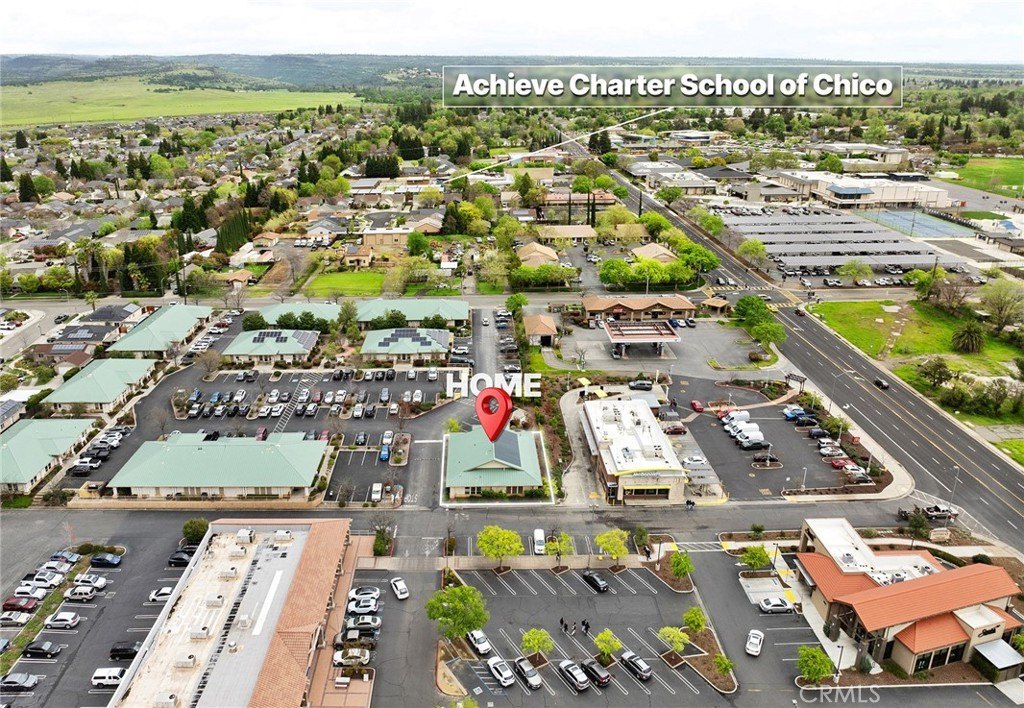
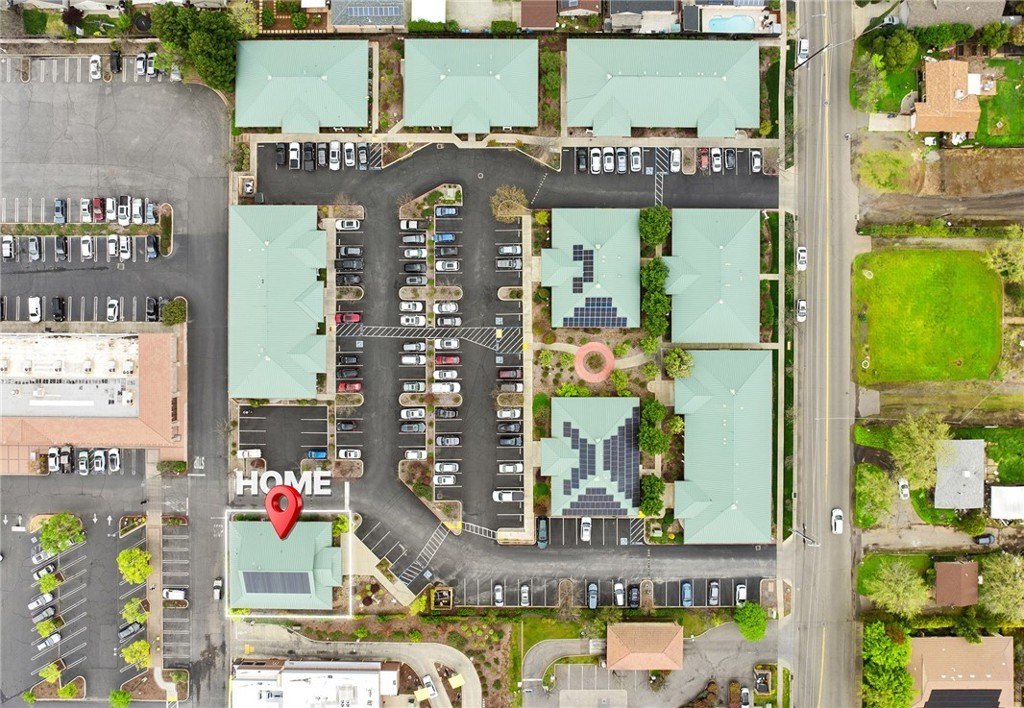
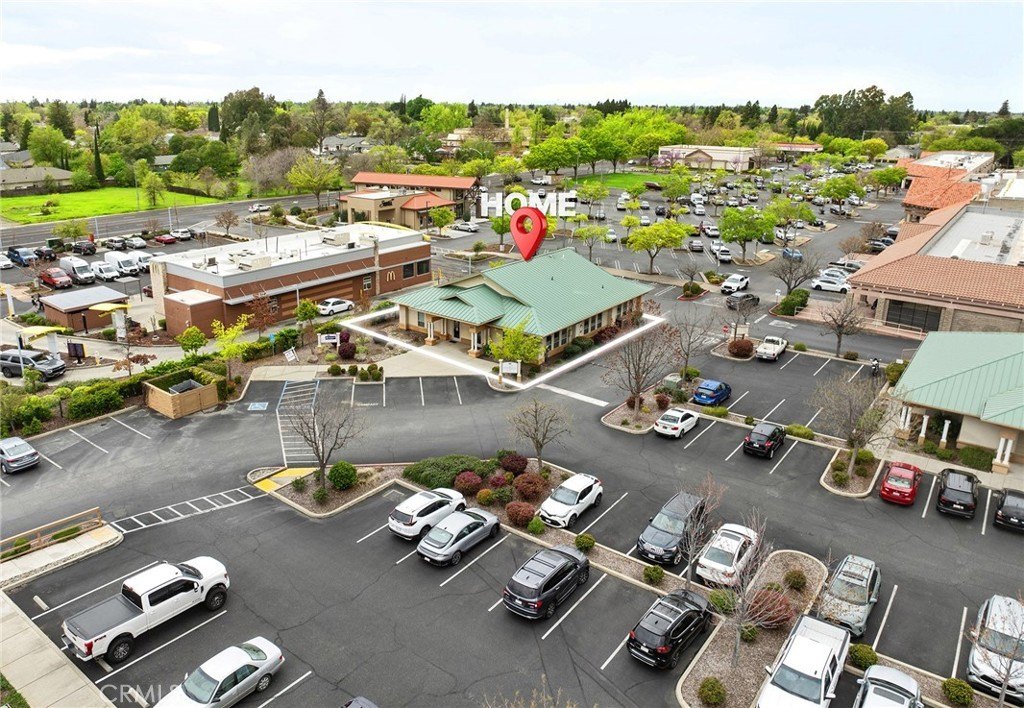
The building is located in the Pleasant Valley Courtyard complex. The complex is situated on Ceanothus Ave, near the intersection of East Ave and Mariposa Ave, in close proximity to Pleasant Valley High School and the Safeway Shopping Center.
Standard status
Active
APN
016280048000
Taxes and HOA fees
Tax Year
2025
Tax Annual Amount
9398
Building Details
Year built
2008
Listing Agency:
Keller Williams Realty Chico Area
(530) 809-3700
Listed By:
Matthew Herman · License #01505777
(530) 212-7373
Added: Mar 4
Changed: Sep 2
Last Checked: Oct 7 at 3:06AM
MLS# SN26054524
Copyright © 2026 California Regional Multiple Listing Service, Inc. All rights reserved. All information provided by the listing agent/broker is deemed reliable but is not guaranteed and should be independently verified.
Investment Insights
Based on property information with market context.
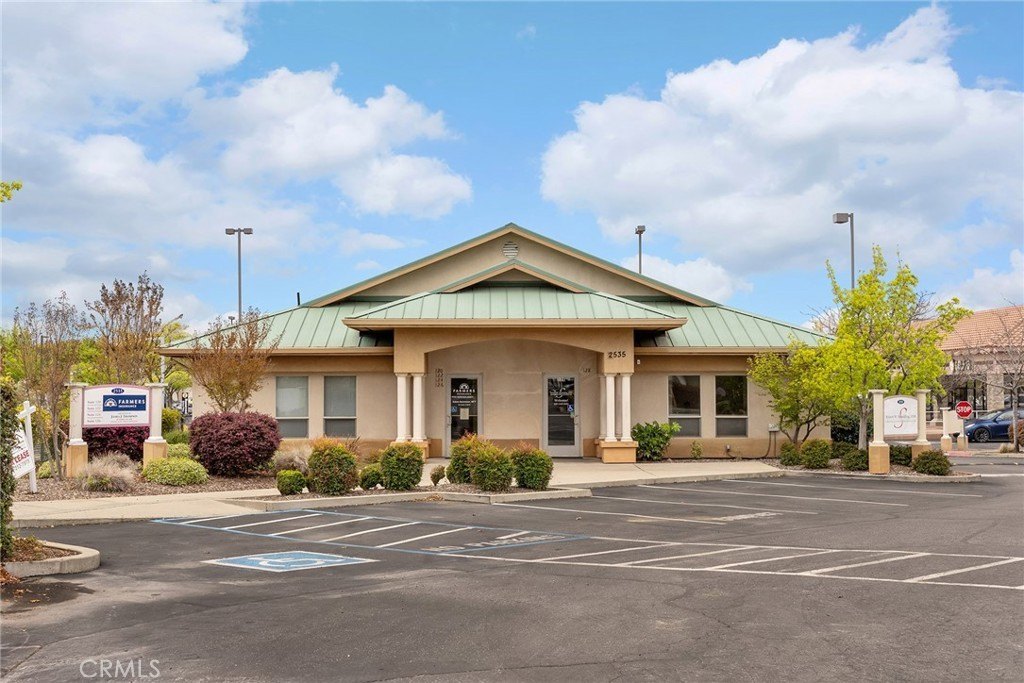
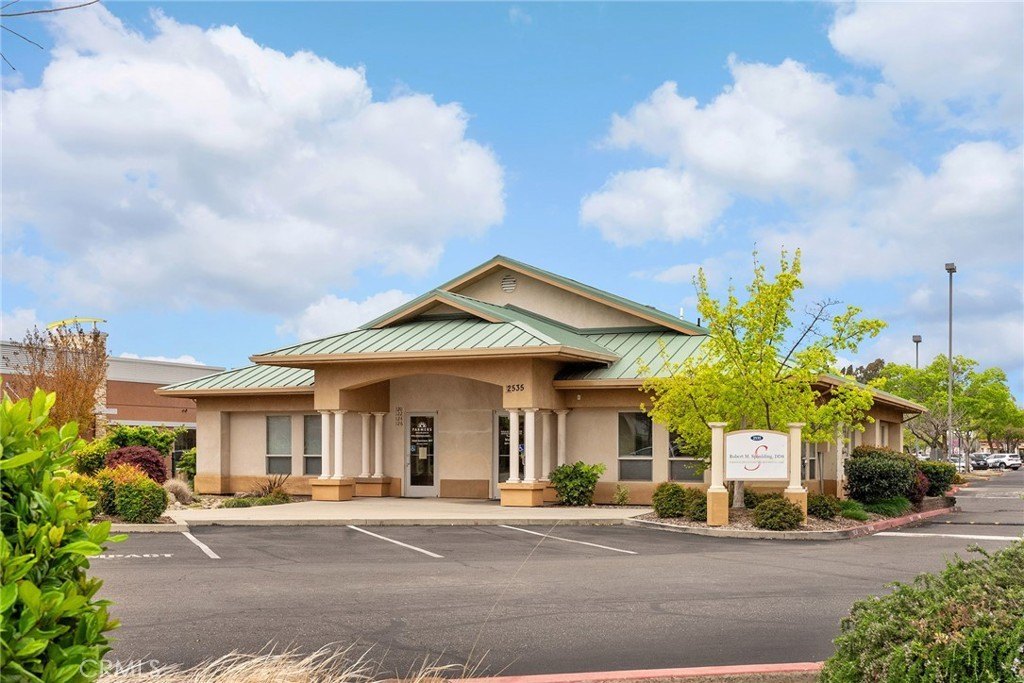
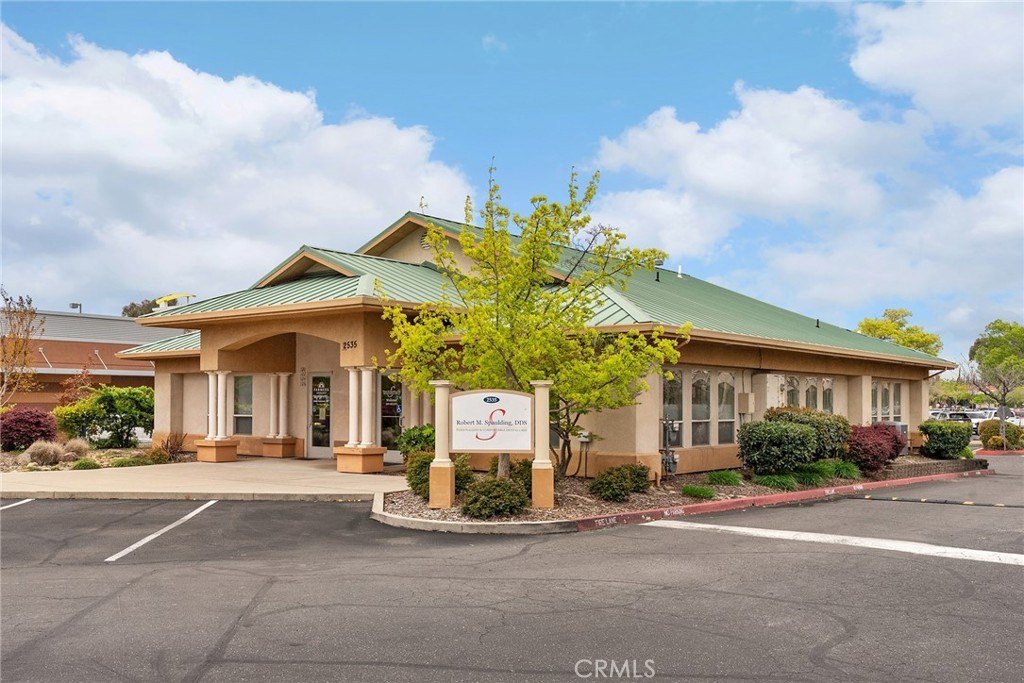
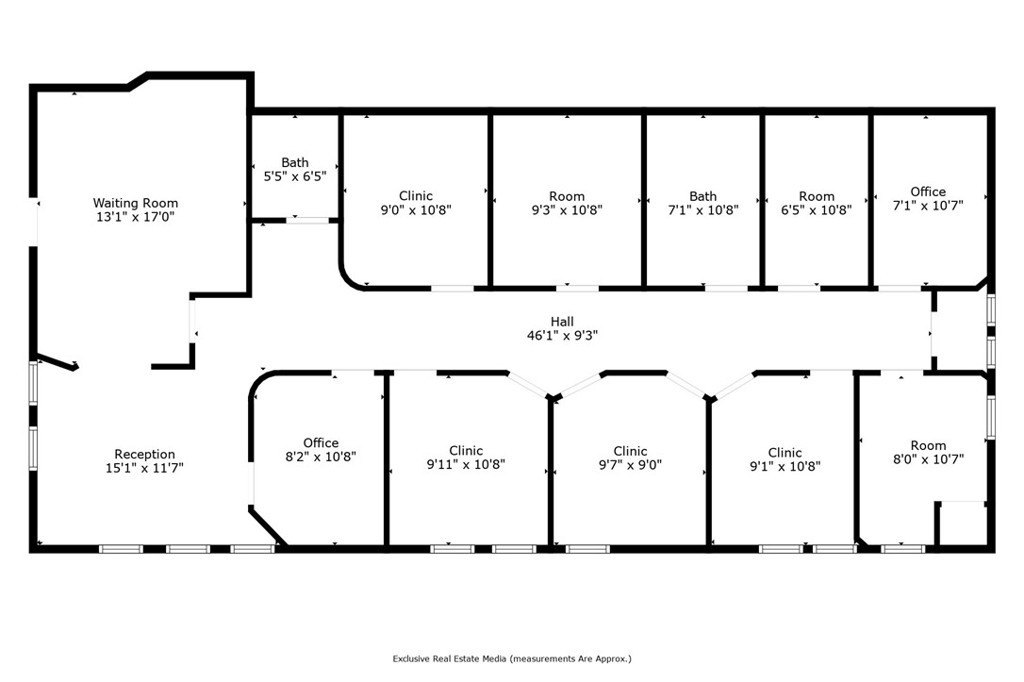
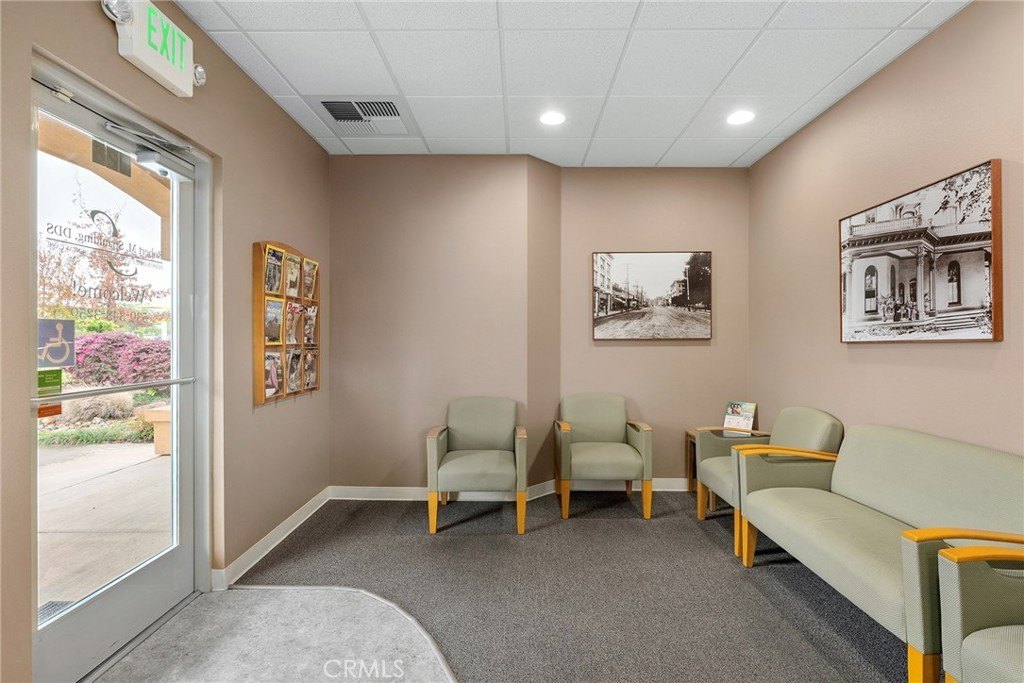
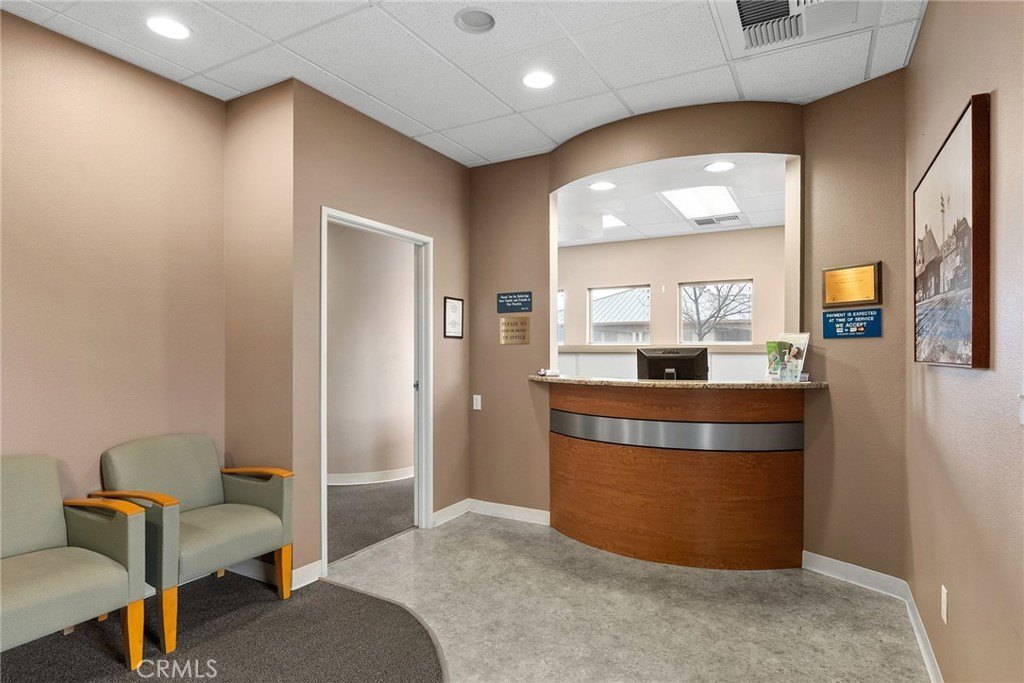
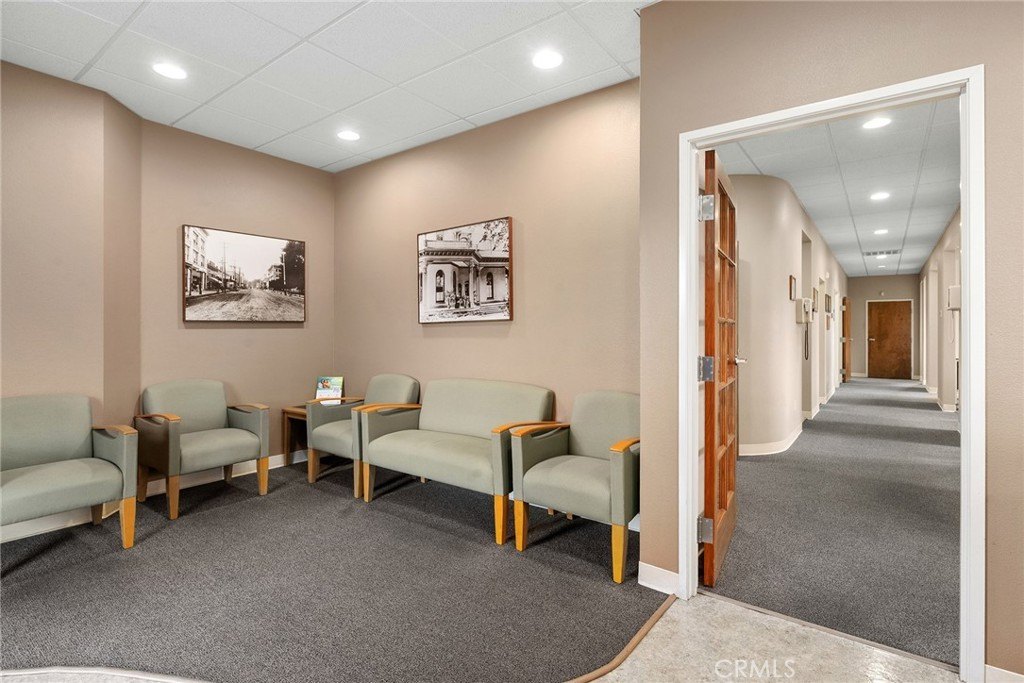
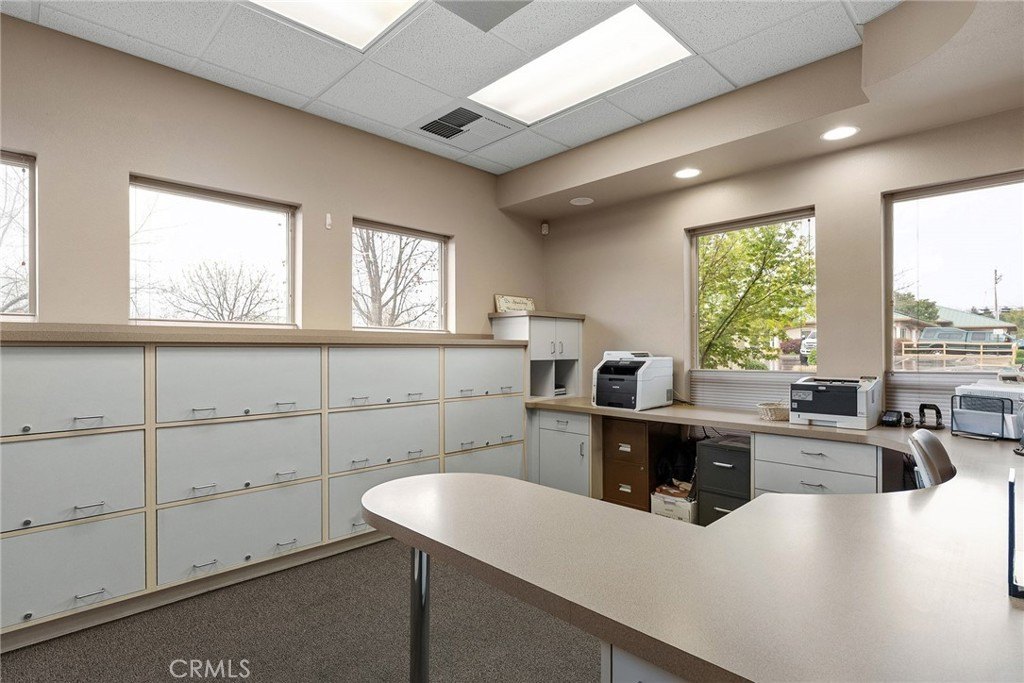
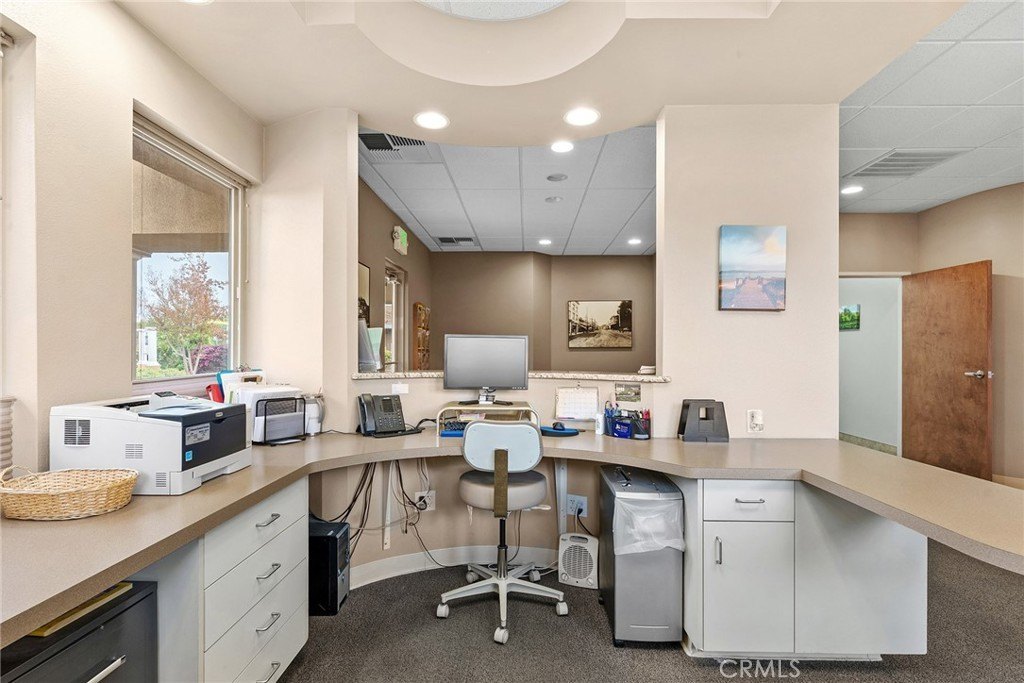
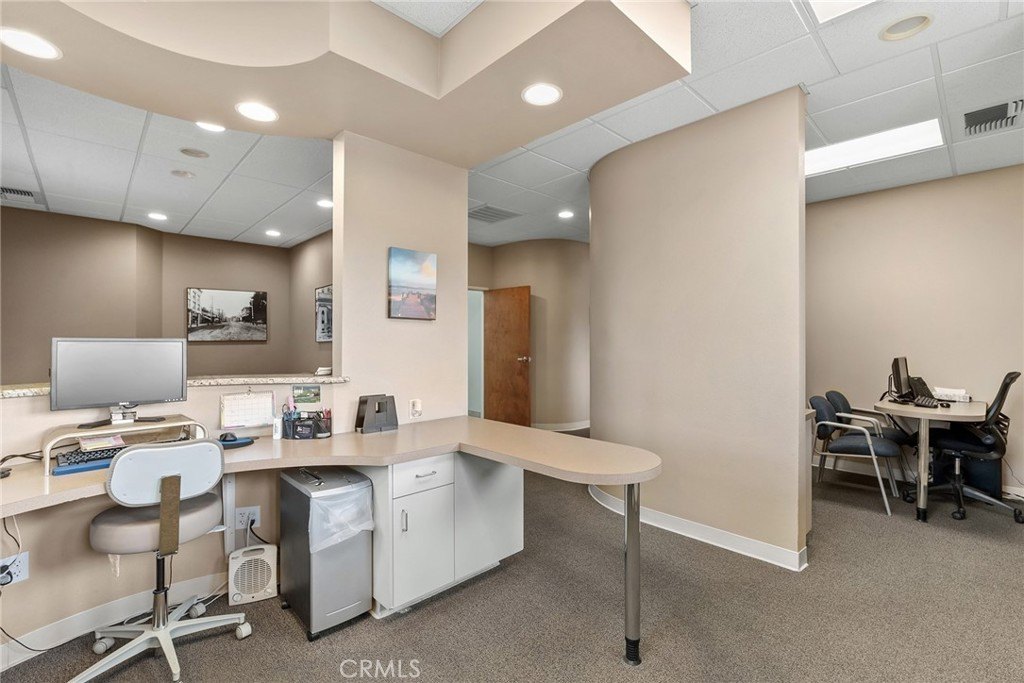
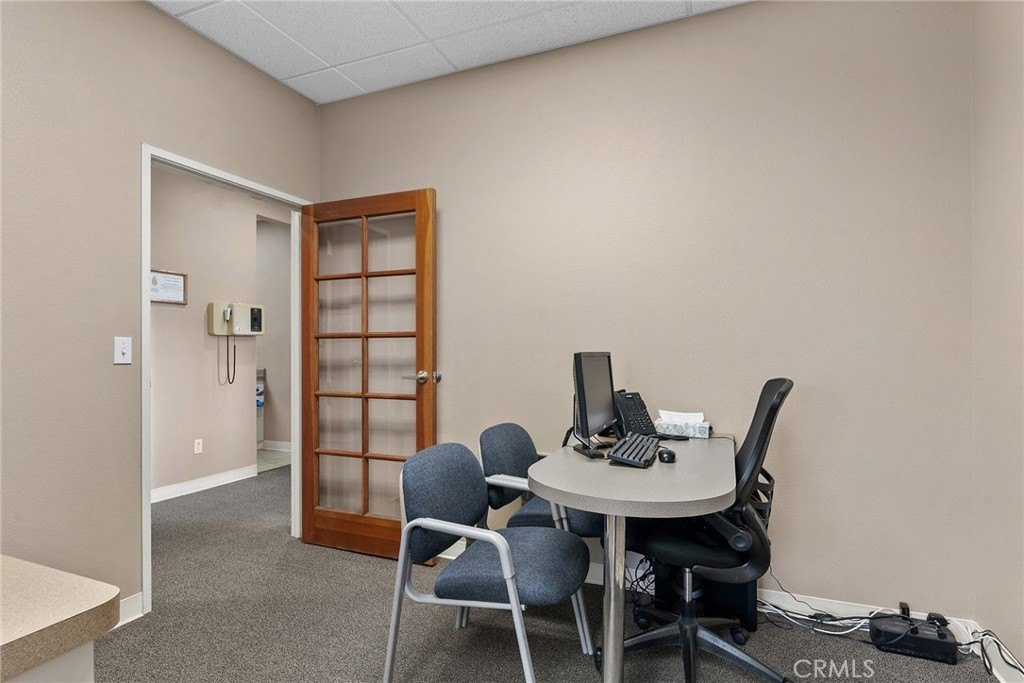
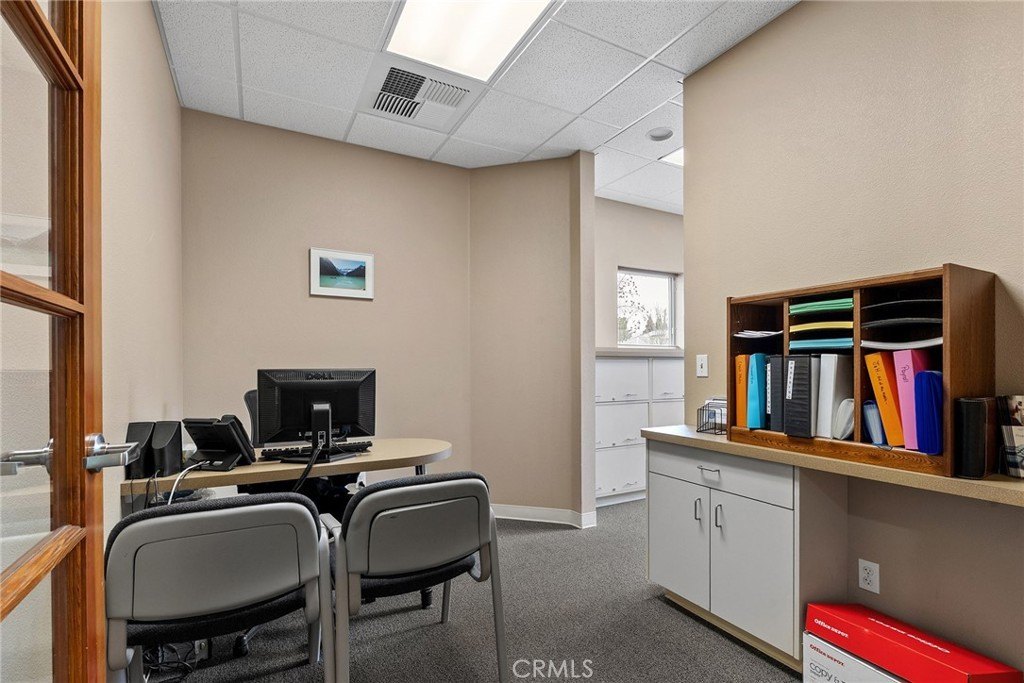
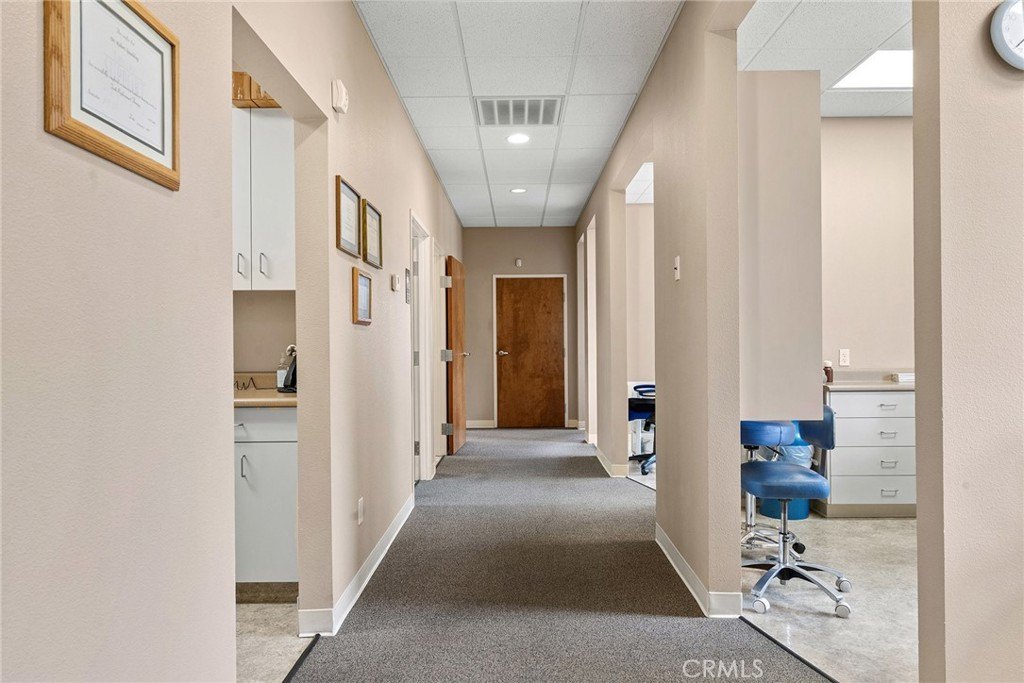
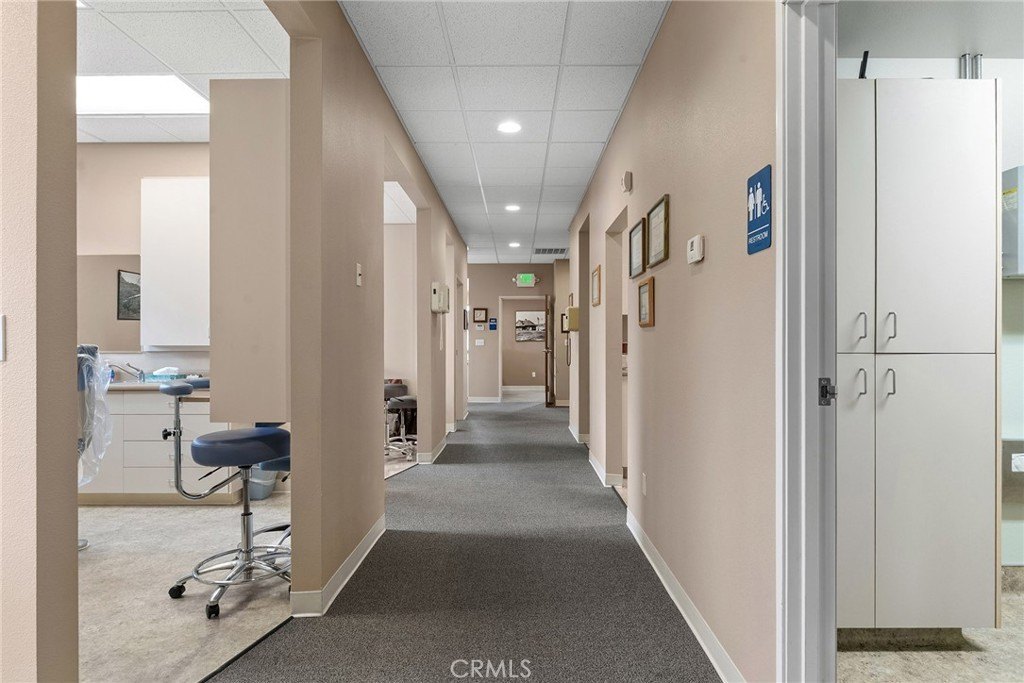
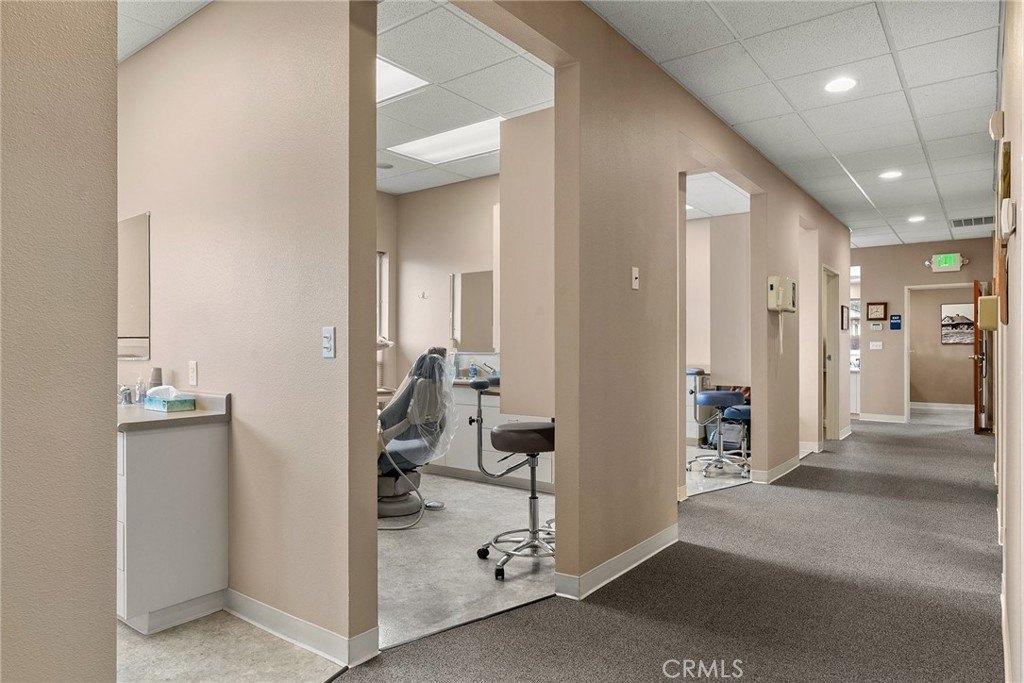
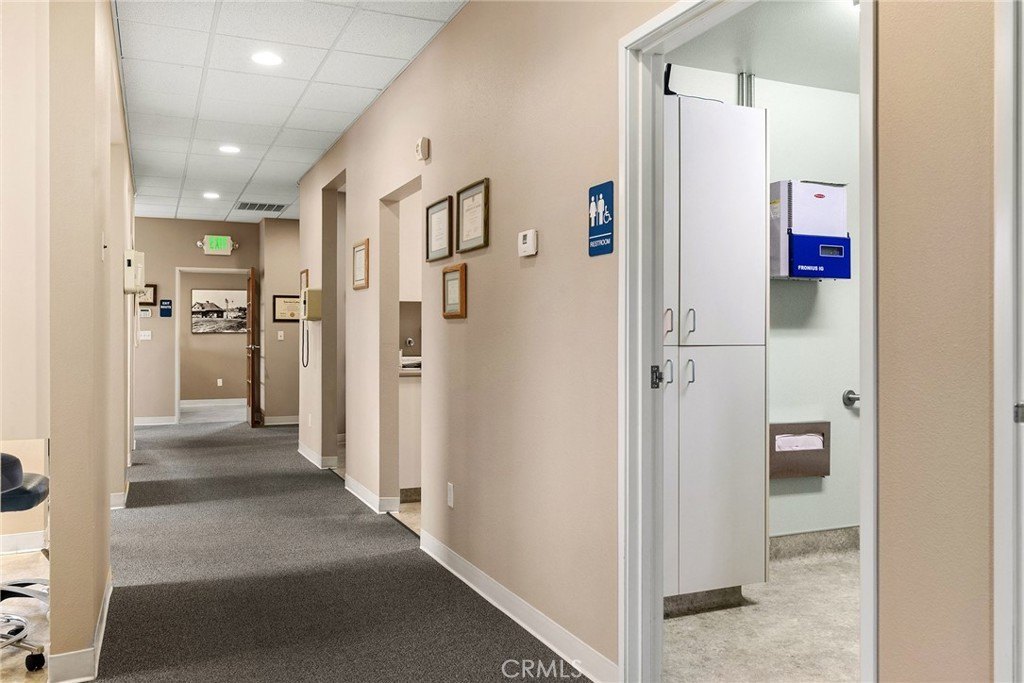
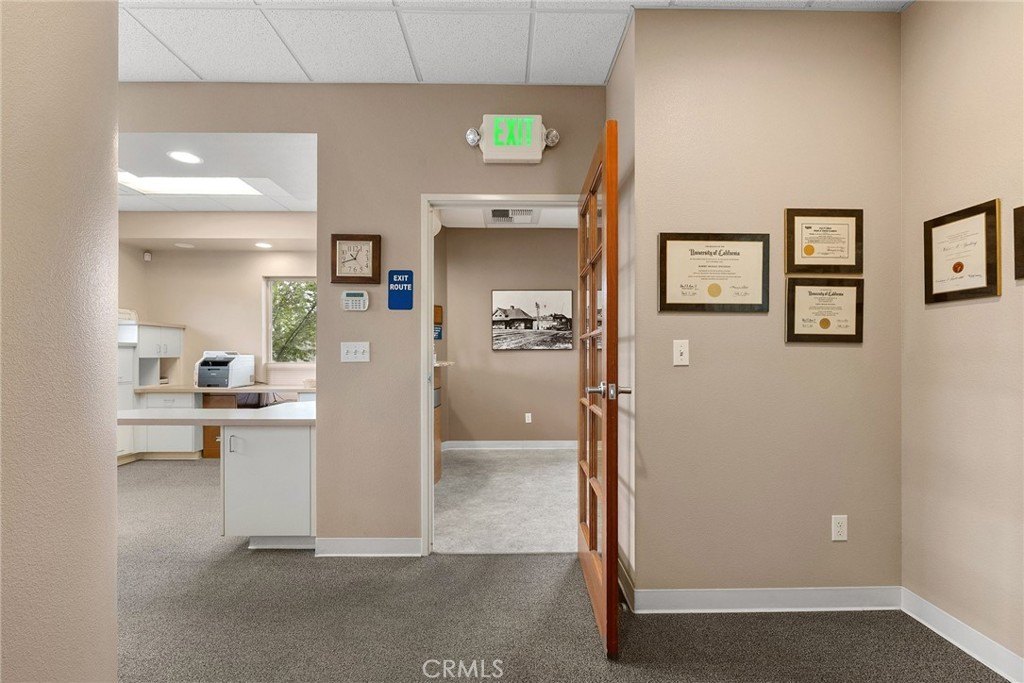
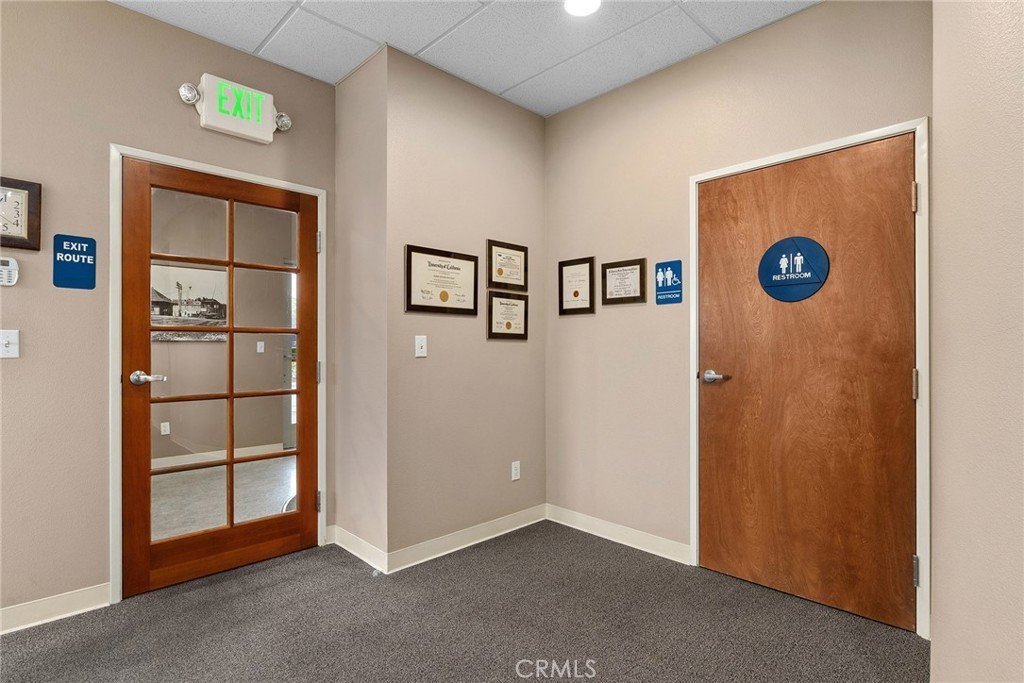
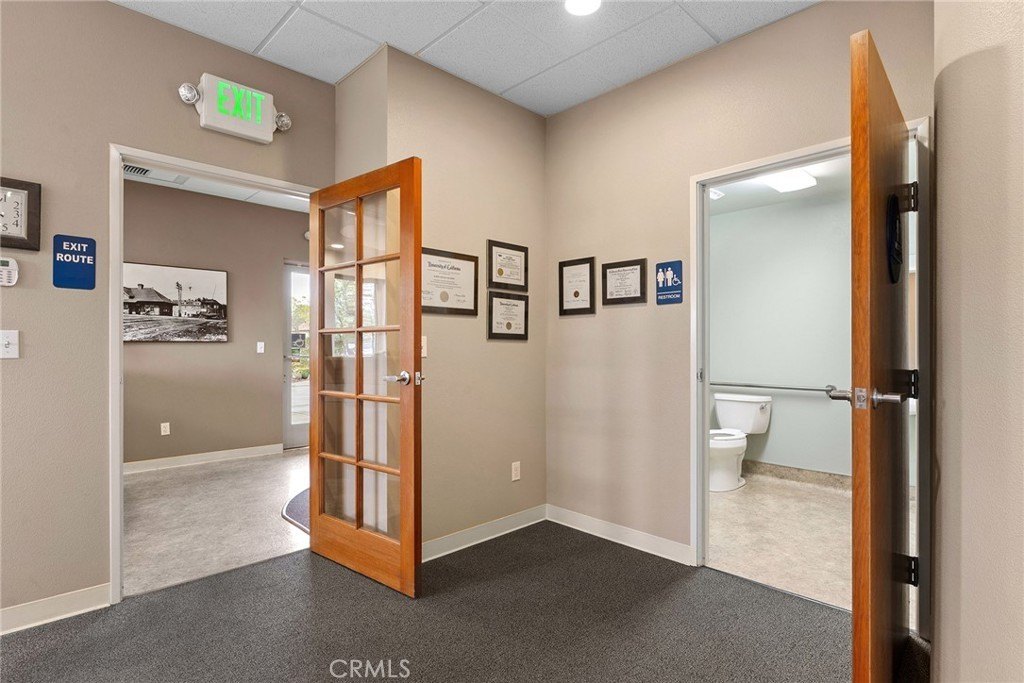
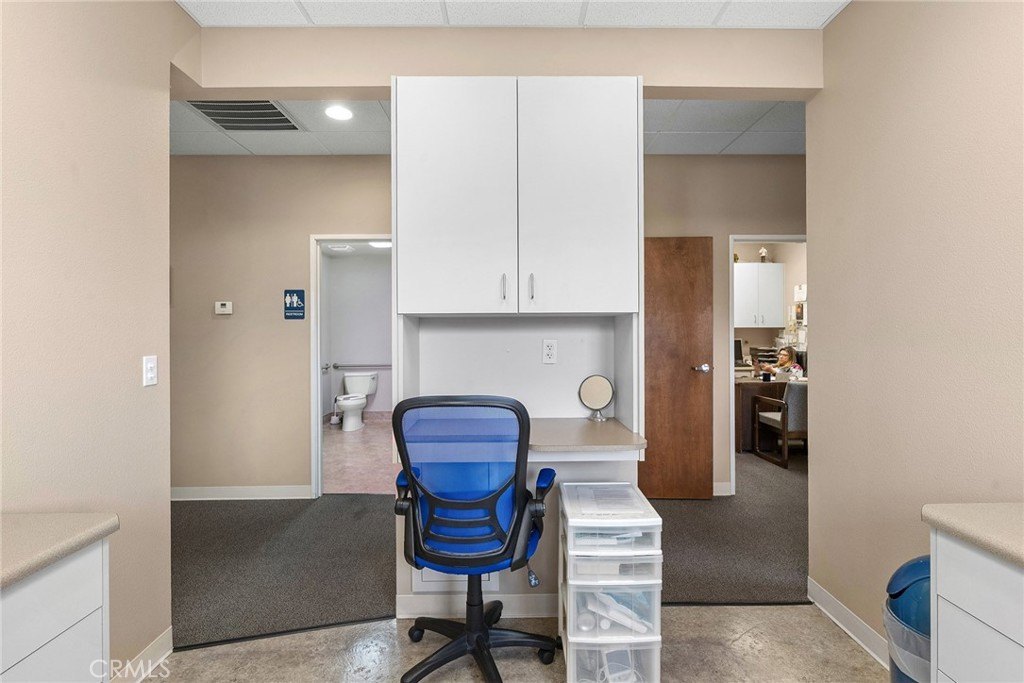
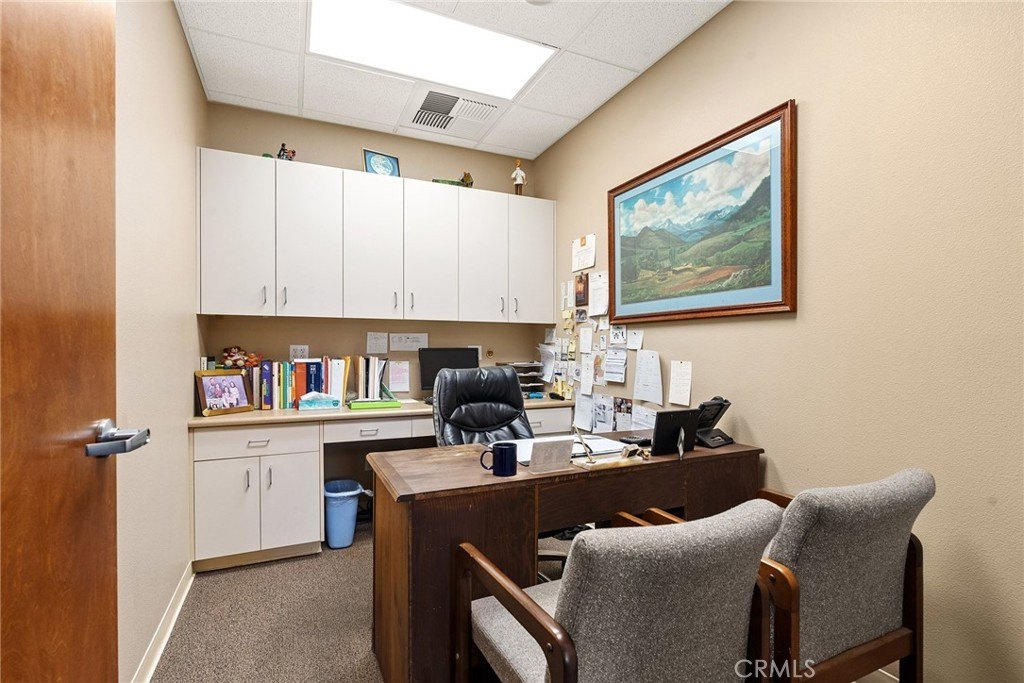
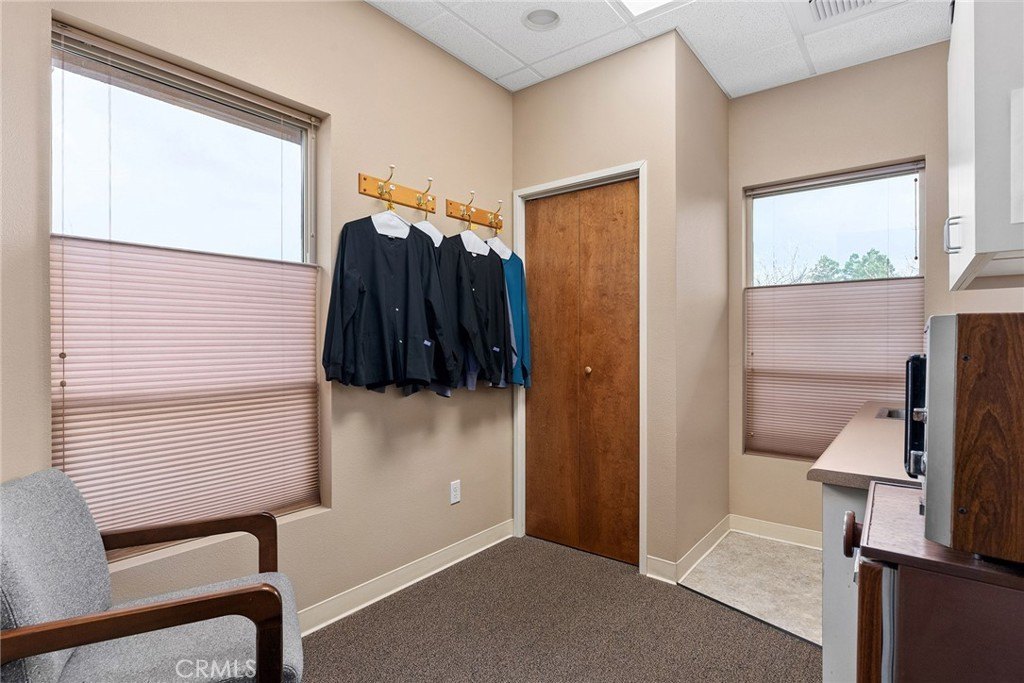
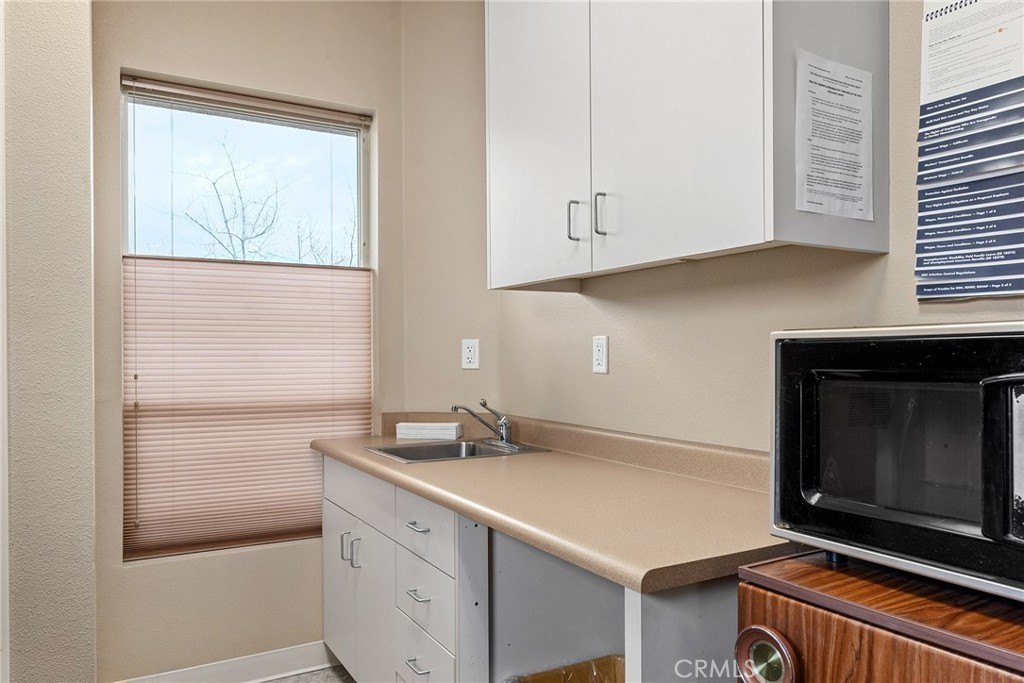
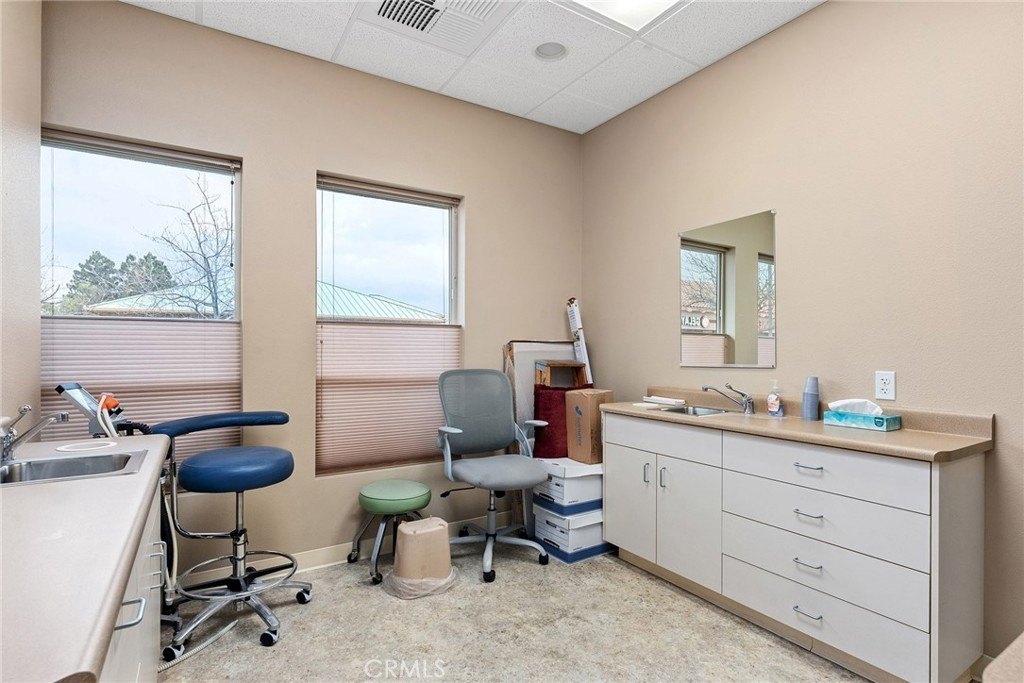
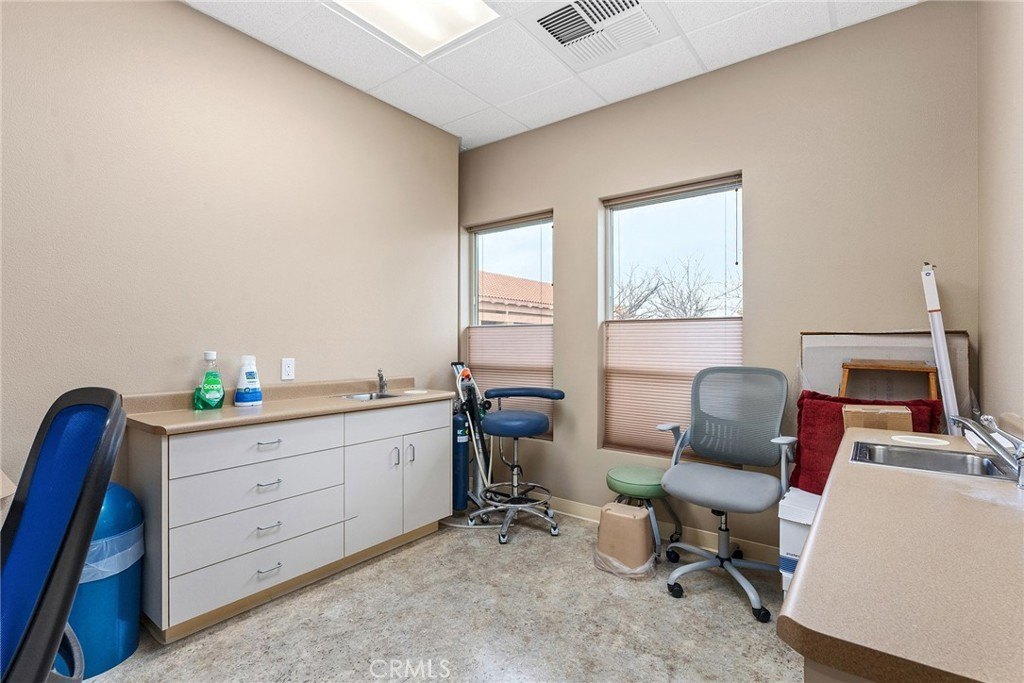
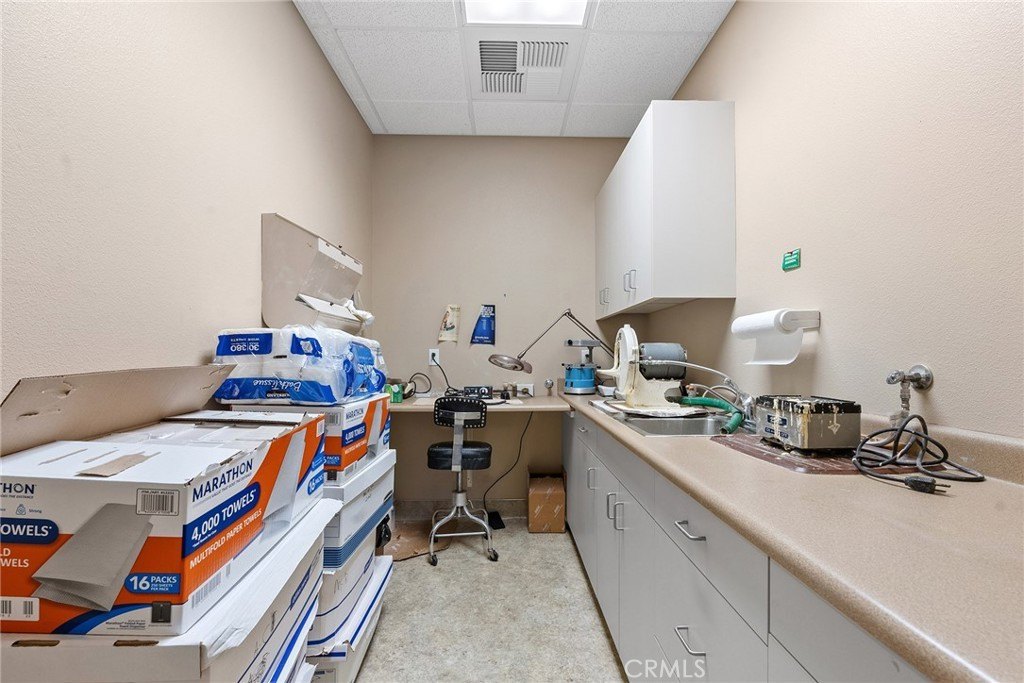
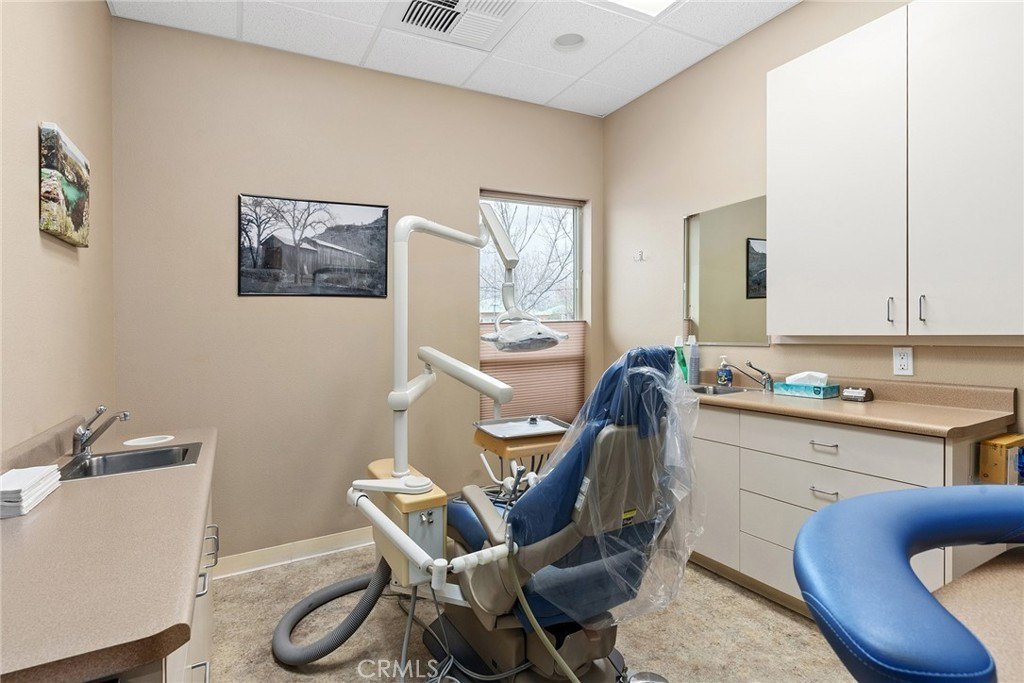
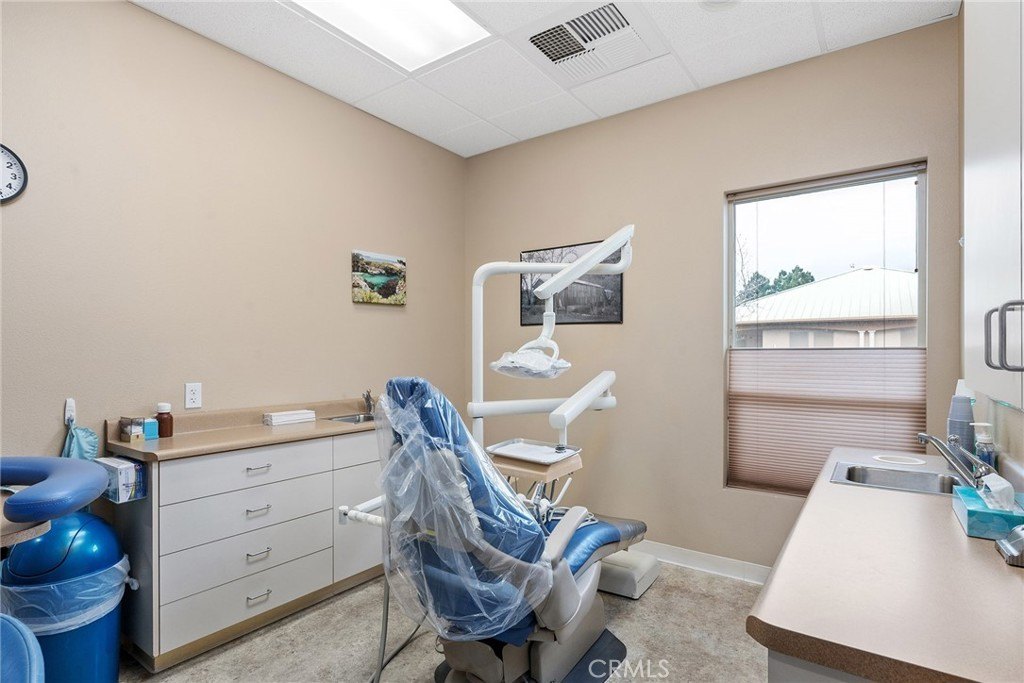
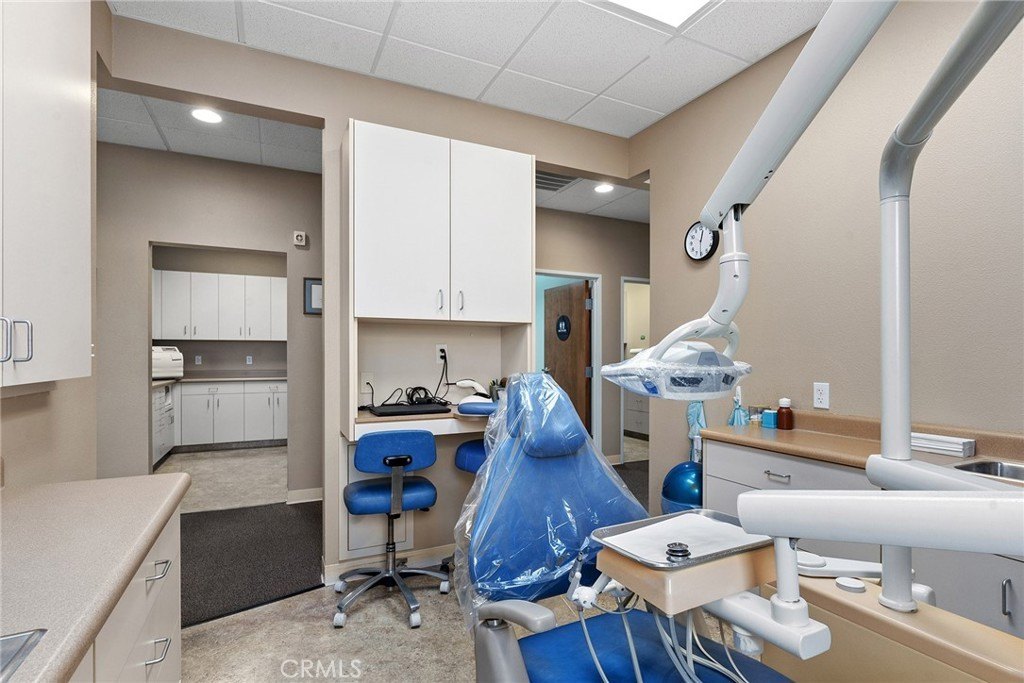
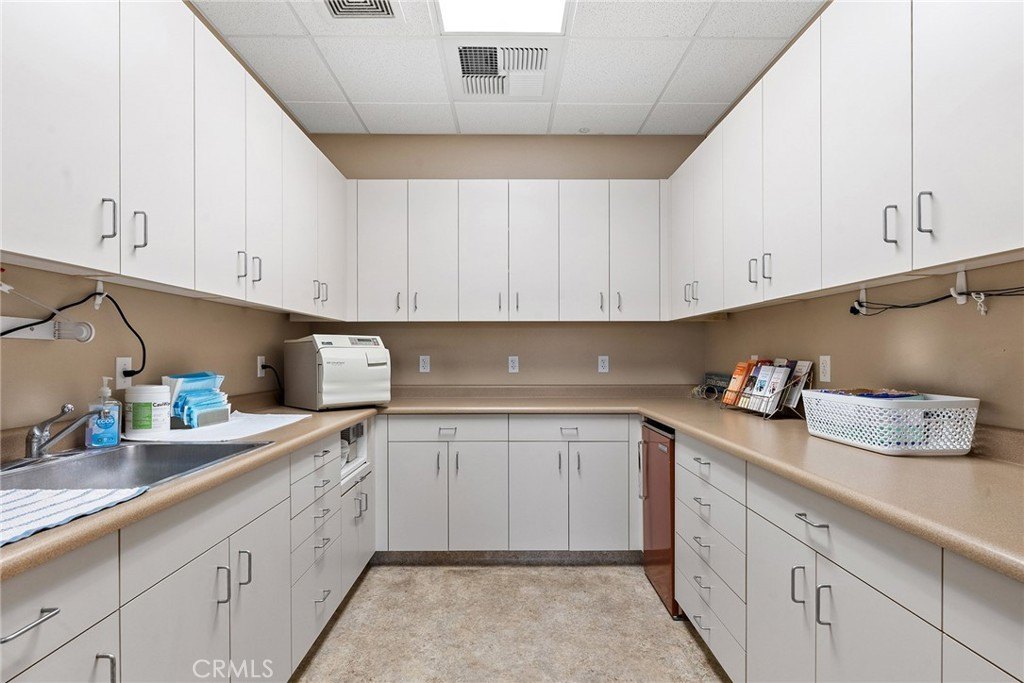
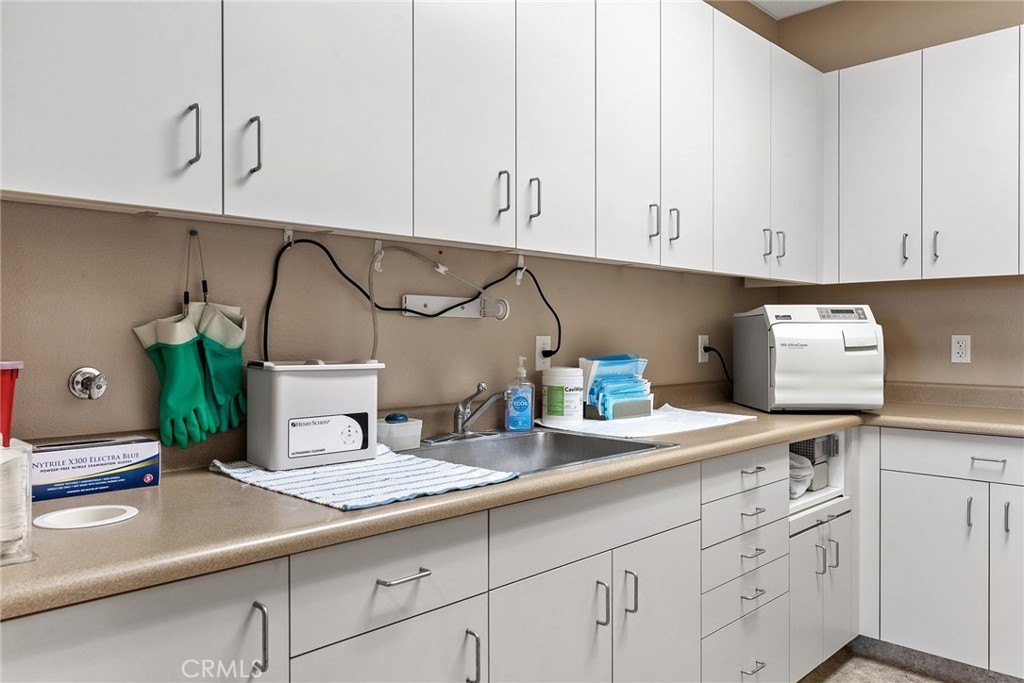
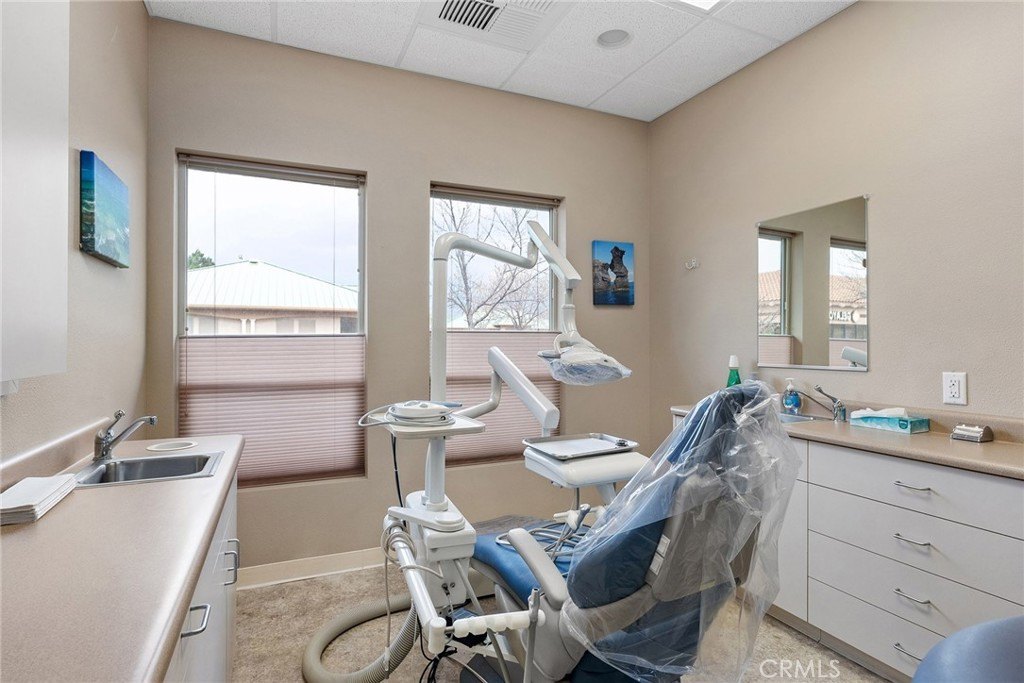
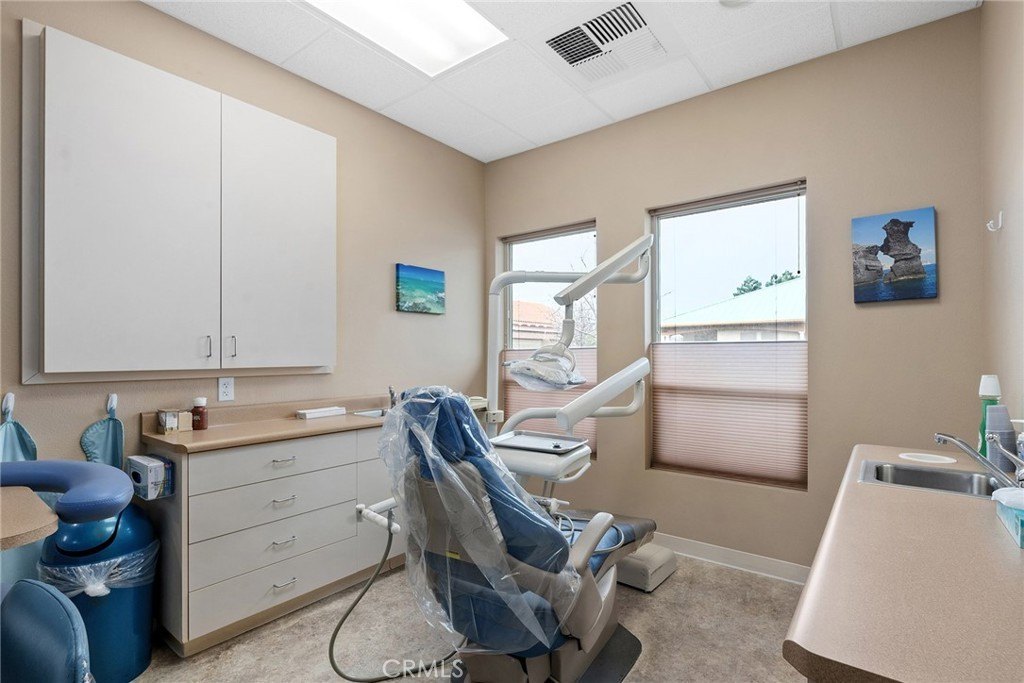
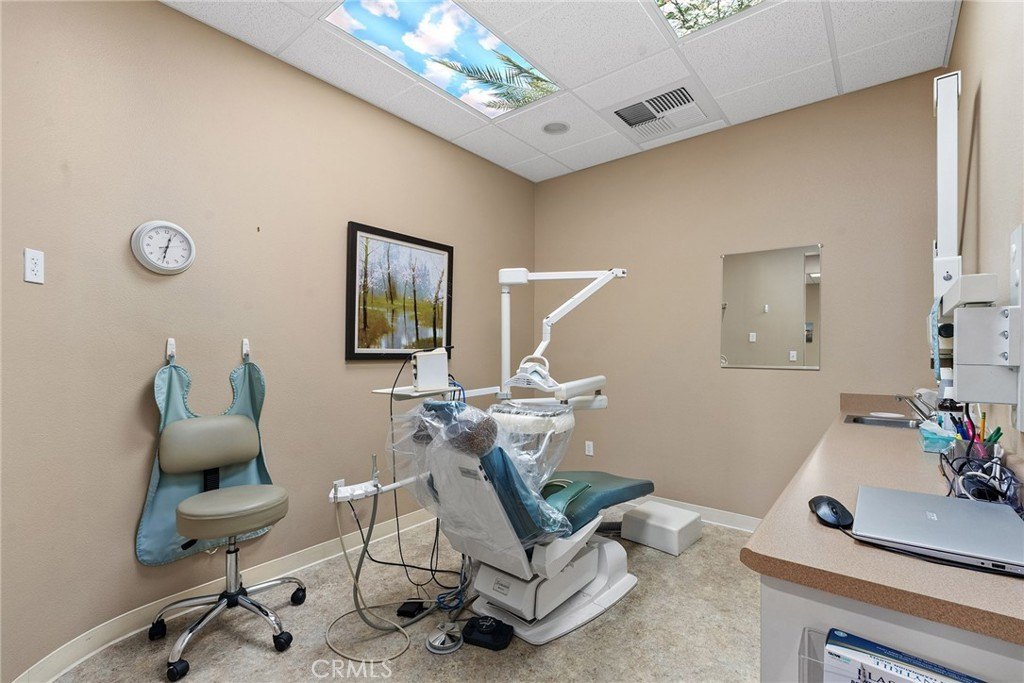
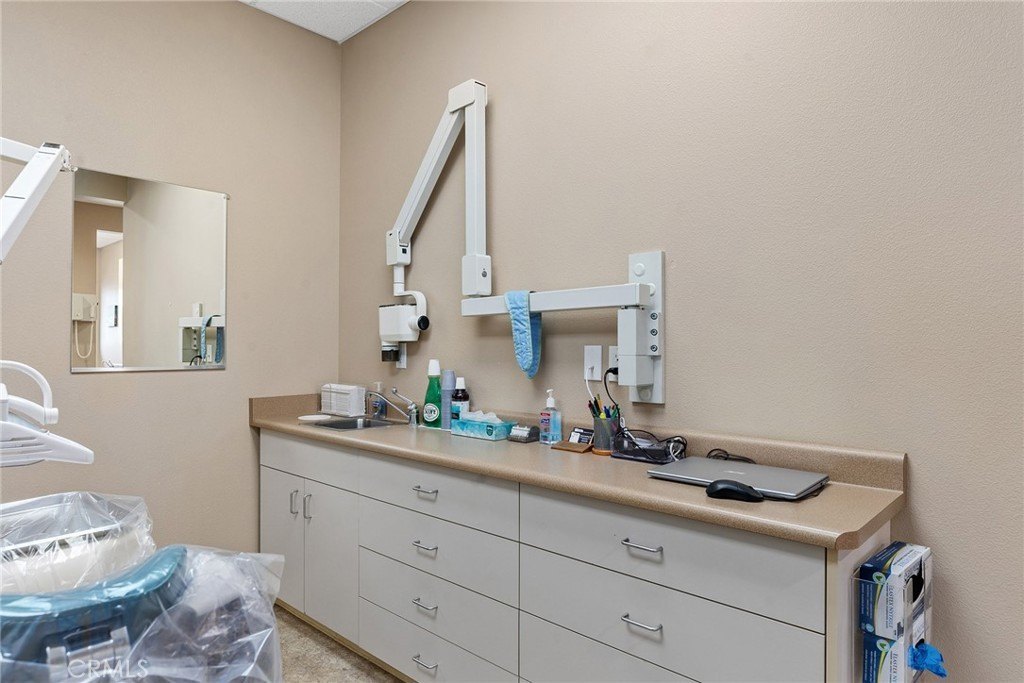
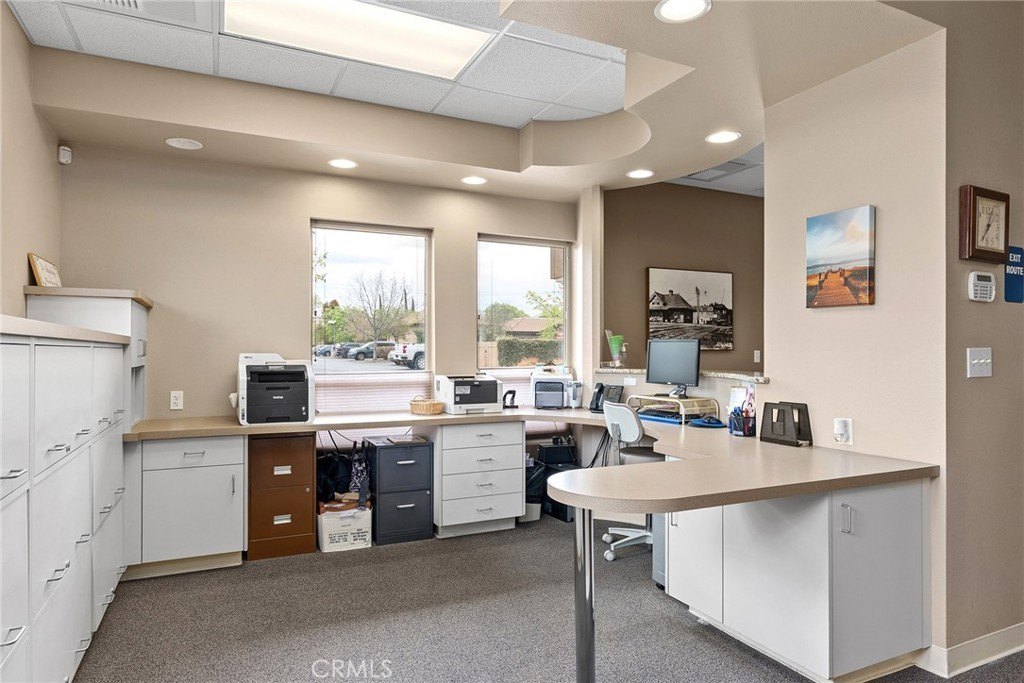
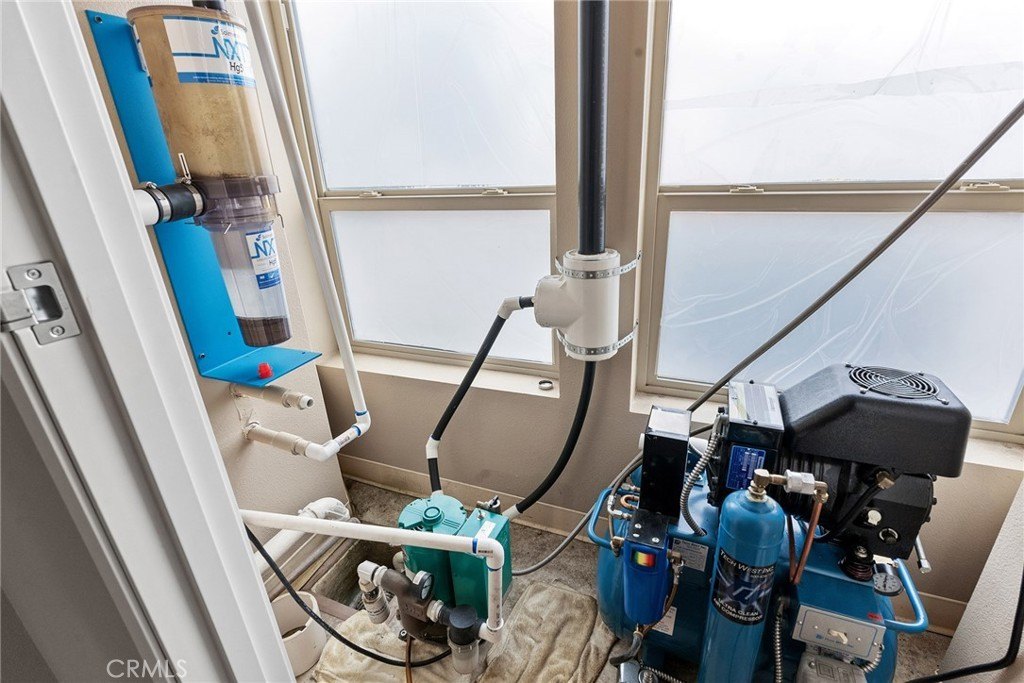
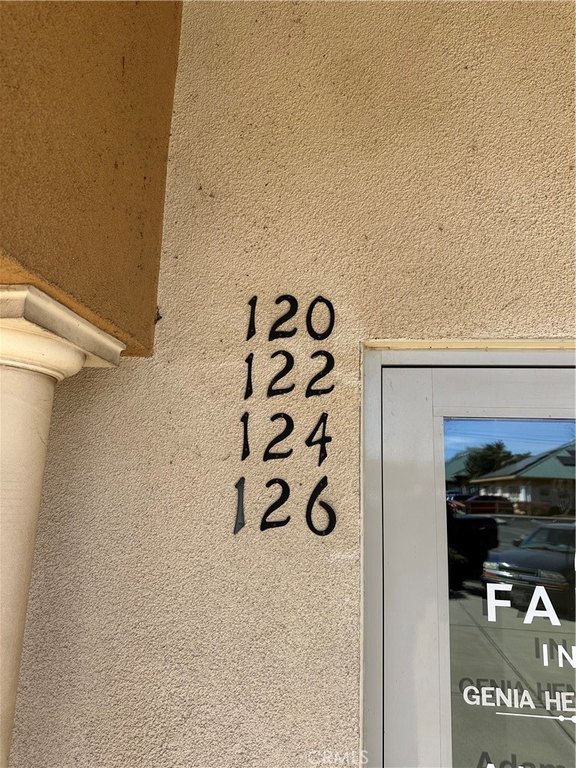
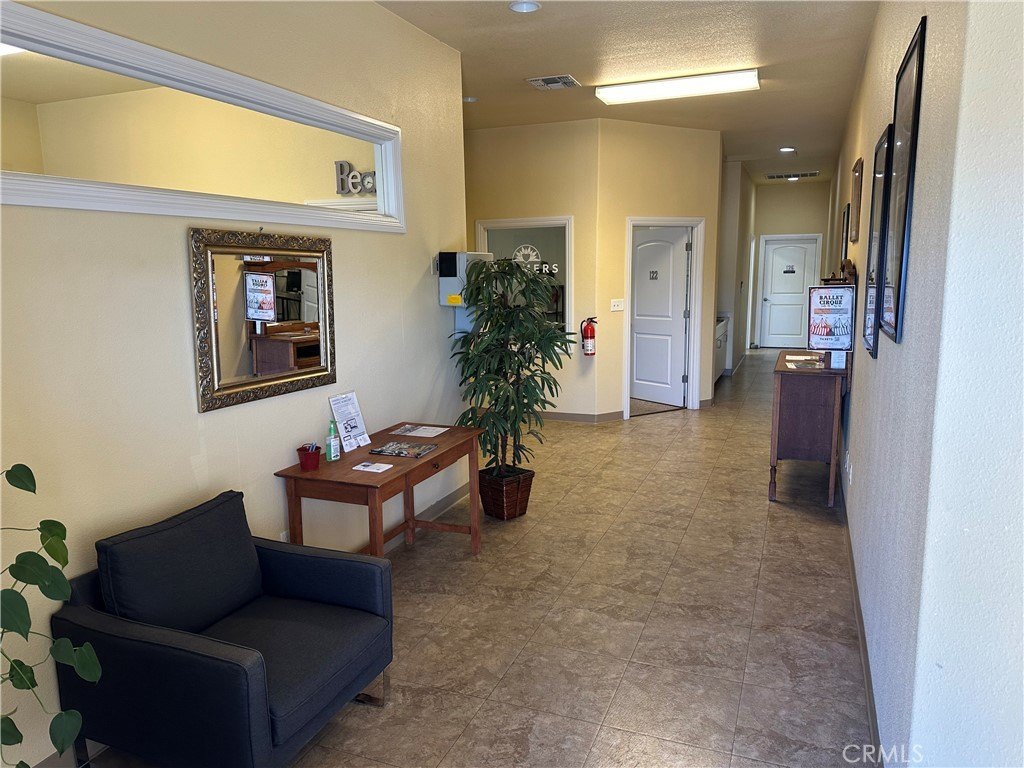
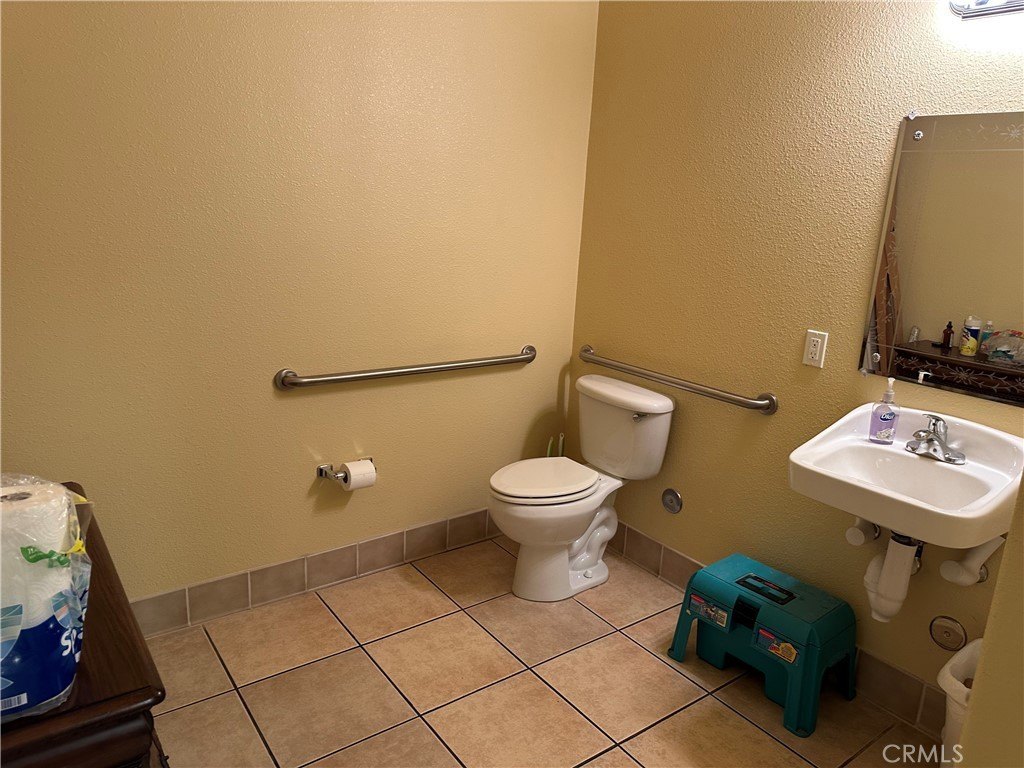
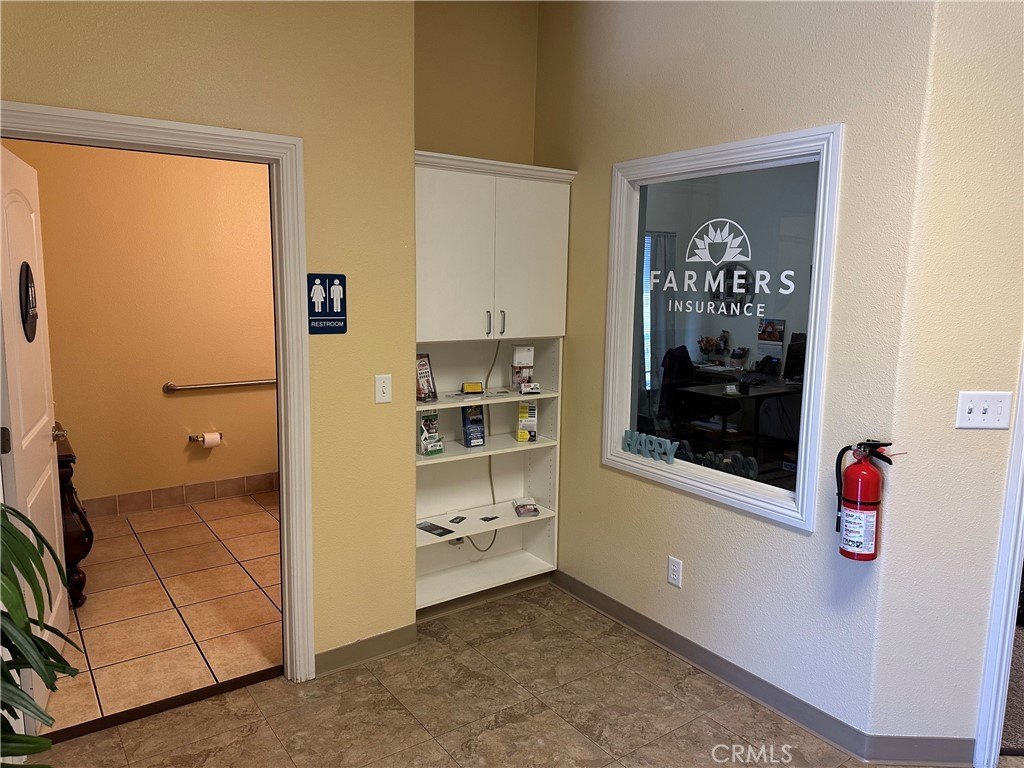
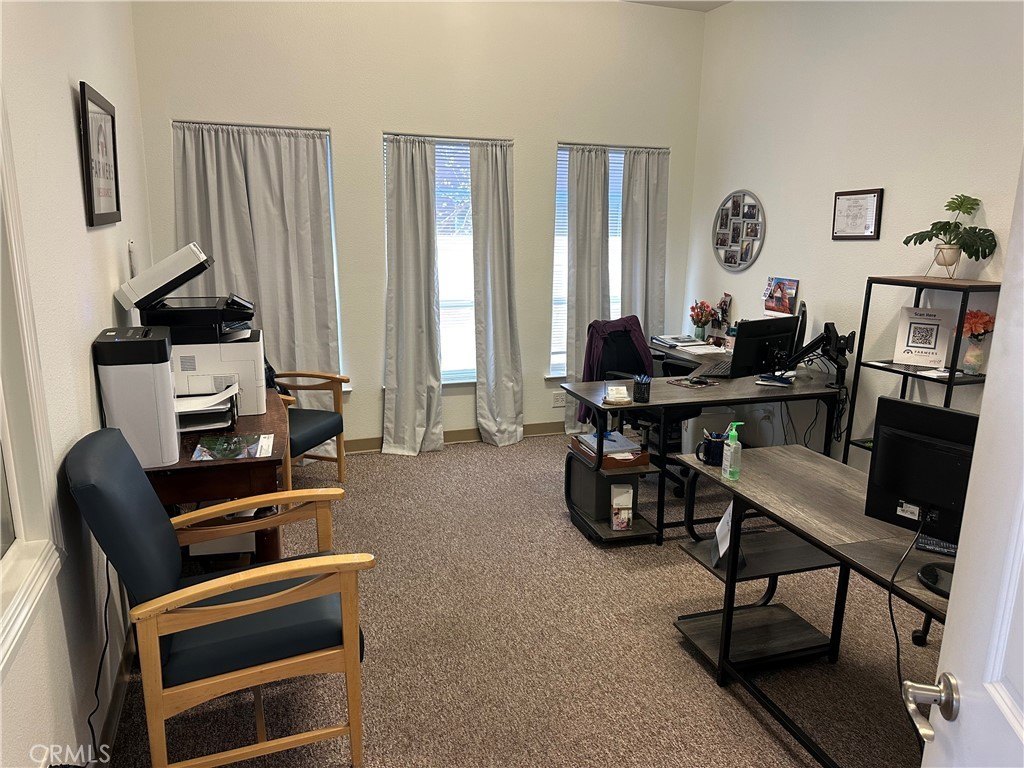
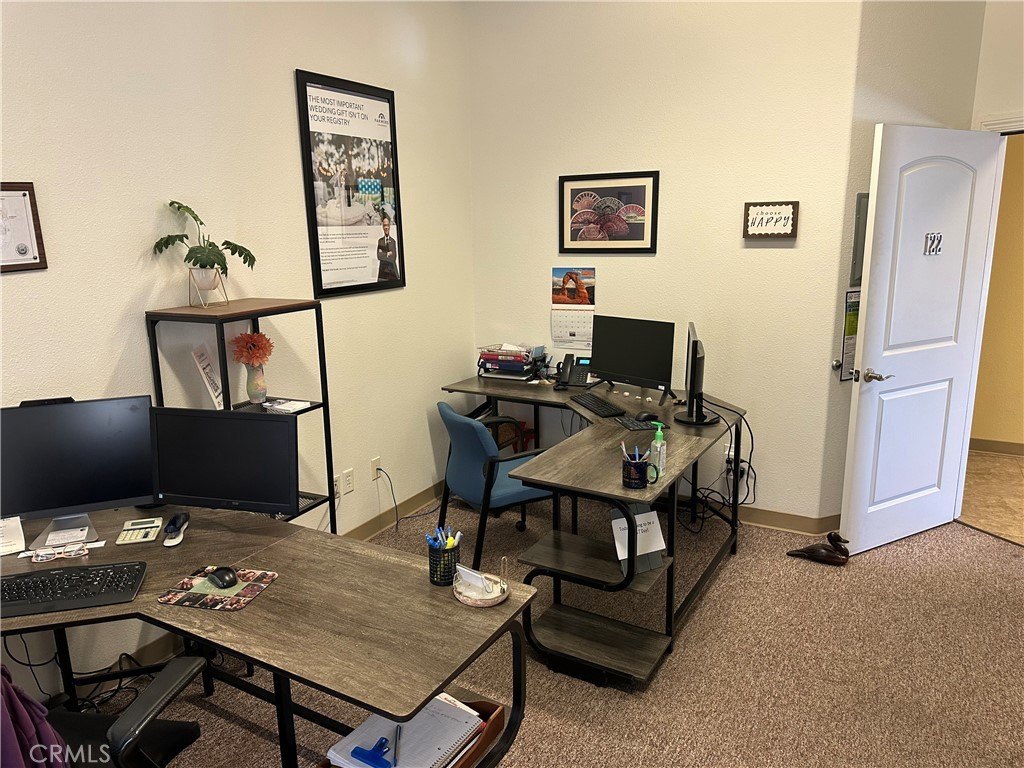
Built in 2008, this professional office building is located within the Pleasant Valley Courtyard and features a total of two evenly split units. The layout provides a private entrance for each suite and independent utility meters. Unit #120 is configured with four large individual offices, while Unit #128 is built out for a dental or medical practice.
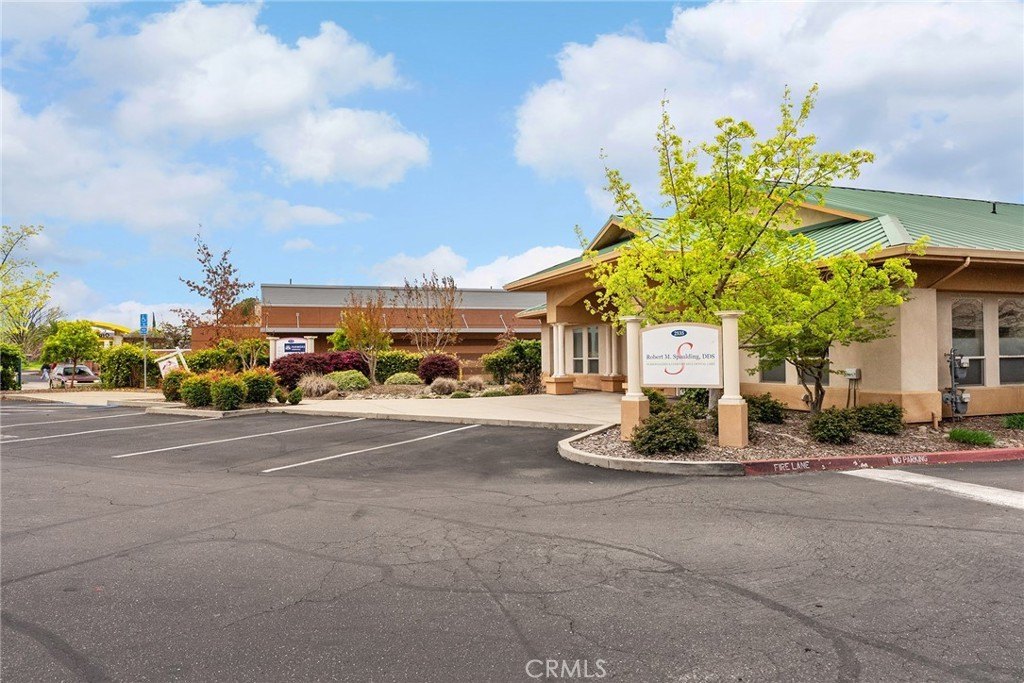
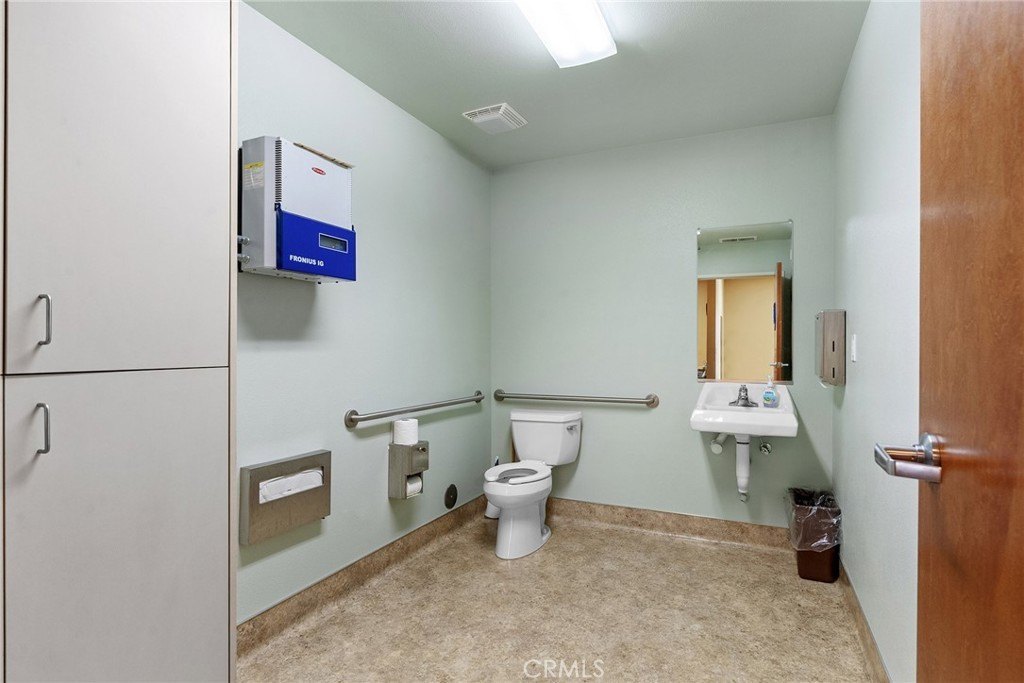
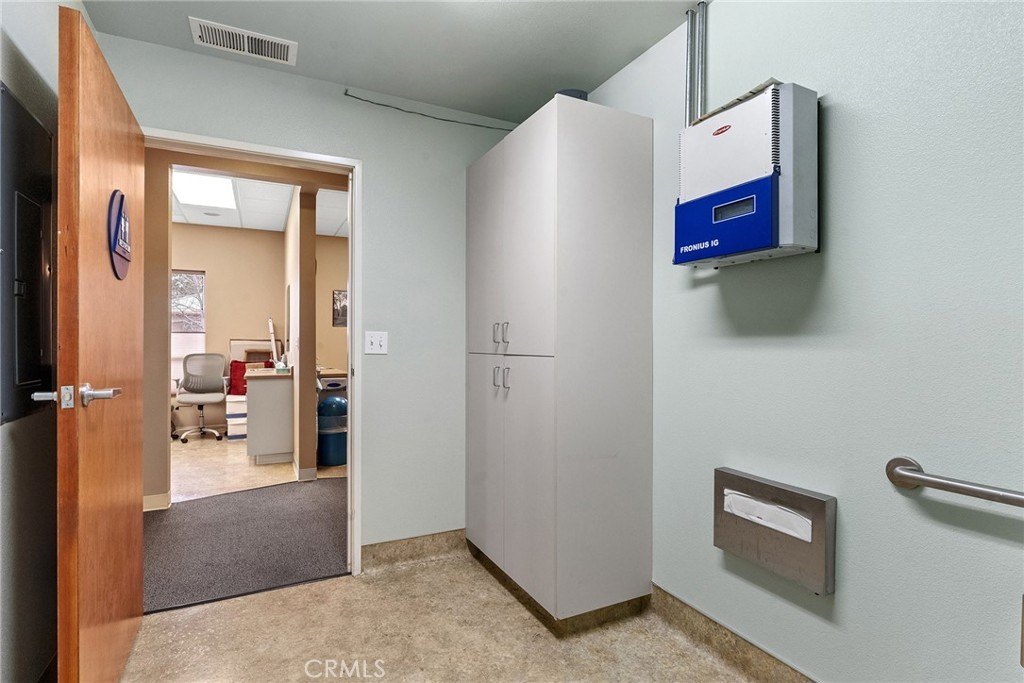
The property sits on Ceanothus Avenue in Chico and offers proximity to Pleasant Valley High School and the Safeway Shopping Center. The building is constructed with wood framing and includes a durable metal roof. A photovoltaic solar system is also installed to support energy efficiency.
For buyers seeking a small, purpose-built office asset, the split-suite structure allows for different professional uses and operational flexibility. The current tenant configuration includes office-ready space in Unit #120 and a medical/dental buildout in Unit #128. Long-term leases are reported as in place through 2028, supporting stability for an owner looking to acquire an income-producing property. Viewing is available by appointment only.
The property sits on Ceanothus Avenue in Chico and offers proximity to Pleasant Valley High School and the Safeway Shopping Center. The building is constructed with wood framing and includes a durable metal roof. A photovoltaic solar system is also installed to support energy efficiency.
For buyers seeking a small, purpose-built office asset, the split-suite structure allows for different professional uses and operational flexibility. The current tenant configuration includes office-ready space in Unit #120 and a medical/dental buildout in Unit #128. Long-term leases are reported as in place through 2028, supporting stability for an owner looking to acquire an income-producing property. Viewing is available by appointment only.
Key Highlights
- 2008‑built 3,000 SF professional office building in Pleasant Valley Courtyard
- Split into two 1,500 SF units (Unit #120 and Unit #128), each with a private entrance and independent utility meters
- Unit #120 includes four large individual offices; Unit #128 is built out for a dental or medical practice
Financial Insights
Estimated NOI and Cap Rate
NOI / Yr
$34,884
Cap Rate
4.48%
Suggested Prices Based on Cap Rates
Cap Rate 5%
$697,680
$697.7K
Cap Rate 7%
$498,343
$498.3K
Cap Rate 9%
$387,600
$387.6K
Market Conditions
NOI Build-Up for 3,000 SF
Gross rent
$61.2K $20.40/SF
− Vacancy
−$3.1K −$1.02/SF
EGI
$58.1K $19.38/SF
− OpEx
−$23.3K −$7.75/SF
NOI
$34.9K $11.63/SF
Area
Chico, CA
Vacancy
5.00%
Lease Rate
$20.40 /SF/Yr
Expense Ratio
40.00%
Simulate Cap Rate and NOI
Suggested Prices Based on Cap Rates
Cap Rate 5%
$697,680
Cap Rate 7%
$498,343
Cap Rate 9%
$387,600
Alternative Uses
Best Use
Healthcare Medical
$498.3K
$436.1K – $581.4K
NOI $34,884 @ 7.0% cap · market cap 4.48%
Second Best
Office B
$453.6K
$396.9K – $529.2K
NOI $31,749 @ 7.0% cap · market cap 4.08%
Theoretical Best
Office A
$605.7K
$530.0K – $706.7K
NOI $42,401 @ 7.0% cap · market cap 5.44%
Zoning and permitted uses should be independently verified with authorities.
Property Analytics
Unlock full access to Insights
Subscribe to Realmo Intelligence
Open Analytics
Current Use
Lease Details
2
Office units
Multi-tenant
Tenancy
Location Intelligence
Trade Area within ½ mile
477
Businesses Nearby
Explore this area
Business Placement
Demographics for 95973, CA
39,609
Population
15,836
Households
2.5
Avg Household Size
39
Median Age
41%
College-Educated
94%
High-School Grad
300.1 sq mi
ZIP Area
132
Density / Sq Mi
$92,228
Median Household Income
$45,897
Median Earnings
$1,546
Median Rent
$484,600
Median Home Value
Check the figures for this property
Cap Rate, Value Estimation, Potential NOI and more
View Realmo Analytics
Market
Vacancy Rate% for Office in West region

Questions? Ask Rey
Realmo’s AI knows this listing — price, zoning, demand, history. Ask anything.


Frequently Asked Questions
What type of property is this?
Office units - 2008-built office building with two separately metered units and photovoltaic solar, suited for multiple professional office users.
Where is this office units located?
The property is located at 2535 Ceanothus Chico, CA.
What is the asking price?
The asking price for this property is $779,000.
What are key features of this property?
This property features: 2008‑built 3,000 SF professional office building in Pleasant Valley Courtyard; Split into two 1,500 SF units (Unit #120 and Unit #128), each with a private entrance and independent utility meters; Unit #120 includes four large individual offices; Unit #128 is built out for a dental or medical practice