Duplex with Separate
For Sale
$399,900
252 Pinewood Drive, Fowlerville, MI 48836
Multifamily, 1 Story, Fowlerville Vlg, MI
Property Size1,882 SF
Lot Size0.66 Acres
Price / SF$212.49
Days on Market56
Property Features for 252 Pinewood Drive
General Information
Property type
Residential Multi Family
Property subtype
Single Family Residence
Zoning
Multi-Family,Residential
Bedrooms
2
Bathrooms
3
Full bathrooms
2
Half bathrooms
1
Rooms
Basement, Bathroom 1, Bedroom 2, Bathroom 2, Bedroom 1
Pets allowed
Yes
Interior features
220 Volts, Circuit Breakers, ENERGY STAR(R) Qualified Window(s), Programmable Thermostat
Exterior features
Awning/Overhang(s), Lighting
Elementary school district
Fowlerville
Middle school district
Fowlerville
High school district
Fowlerville
Directions
Grand River to North on Benjamin to East on Devonshire to North on Pinewood. Home will be on your right.
Subdivision
Fowlerville Vlg
Standard status
Active
APN
0511305063
Size
1,882 SF
Lot size
0.66 Acres
Taxes and HOA fees
Tax Description
SEC 11 T3N R3E VILLAGE OF FOWLERVILLE, ASSESSOR'S PLAT NO. 2 LOT 28 BEG S2*E 768.84 FT FROM CEN OF SEC FOR POB, TH S2*E 108.58 FT, TH W 135.85 FT TO R/W PINEWOOD DR,TH N12*W 111.12 FT ALG ARC L TH E 155.56 FT TO POB ALSO 2 FT LYING N THEREOF ALSO RIGHTS OF ESMT REMAINING AS EXC TO 305-073, 1/90 0.36 AC M/L
Tax Annual Amount
4325
Legal Description
SEC 11 T3N R3E VILLAGE OF FOWLERVILLE, ASSESSOR'S PLAT NO. 2 LOT 28 BEG S2*E 768.84 FT FROM CEN OF SEC FOR POB, TH S2*E 108.58 FT, TH W 135.85 FT TO R/W PINEWOOD DR,TH N12*W 111.12 FT ALG ARC L TH E 155.56 FT TO POB ALSO 2 FT LYING N THEREOF ALSO RIGHTS OF ESMT REMAINING AS EXC TO 305-073, 1/90 0.36 AC M/L
Utilities
Heating system
Forced Air
Cooling system
Ceiling Fan(s), Attic Fan, Central Air
Water source
Public
Building Details
Year built
1965
Floors in Building
1
Number of units
2
Building materials
Vinyl
Roof type
Asphalt
Architectural style
Ranch
Listing Agency:
Remerica United Realty-Brighton
(810) 202-1850
Listed By:
April R Seeburger
(517) 402-7349
Added: Aug 27
Changed: Oct 20
Last Checked: Oct 21 at 3:06PM
MLS# 20261069396
Copyright © 2026 Realcomp Limited II. All rights reserved. All information provided by the listing agent/broker is deemed reliable but is not guaranteed and should be independently verified.

Ask AI about this property
Review the available facts, identify missing information and prepare questions for the agent.
Investment Insights
Based on property information with market context.
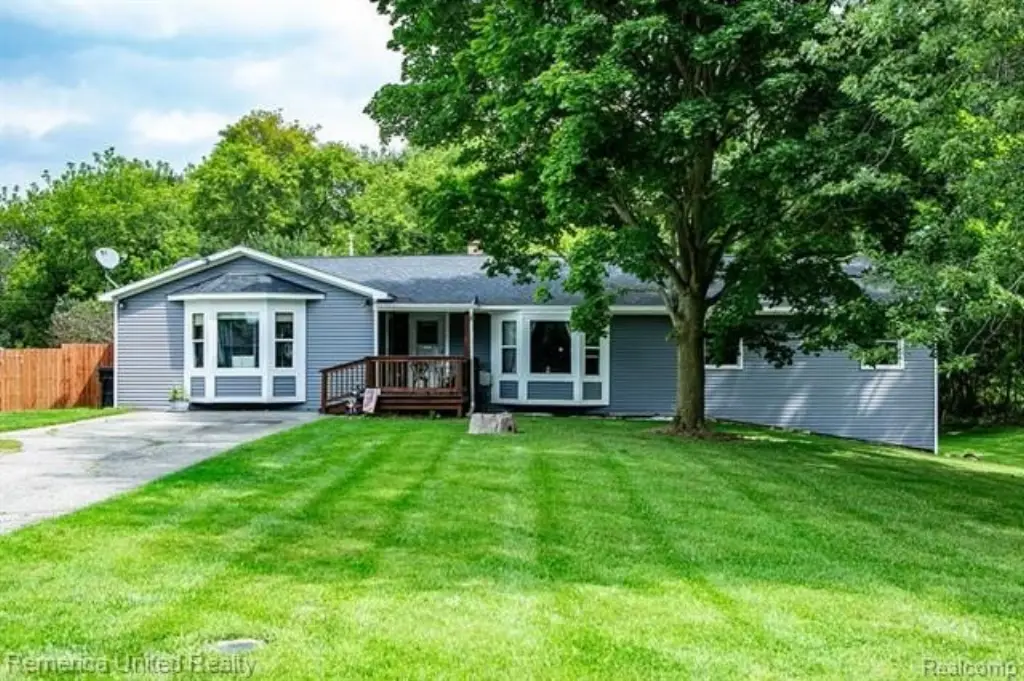
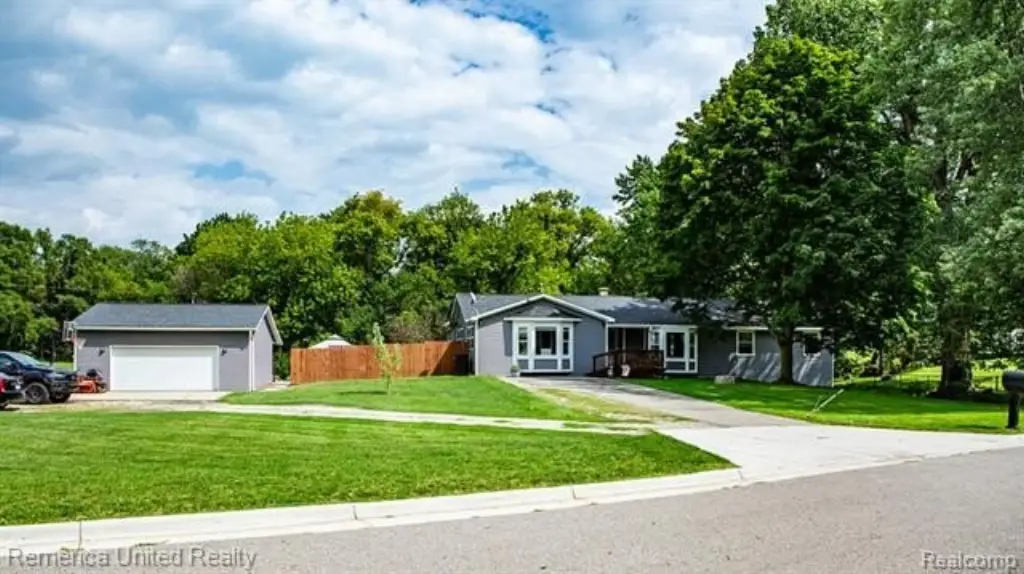
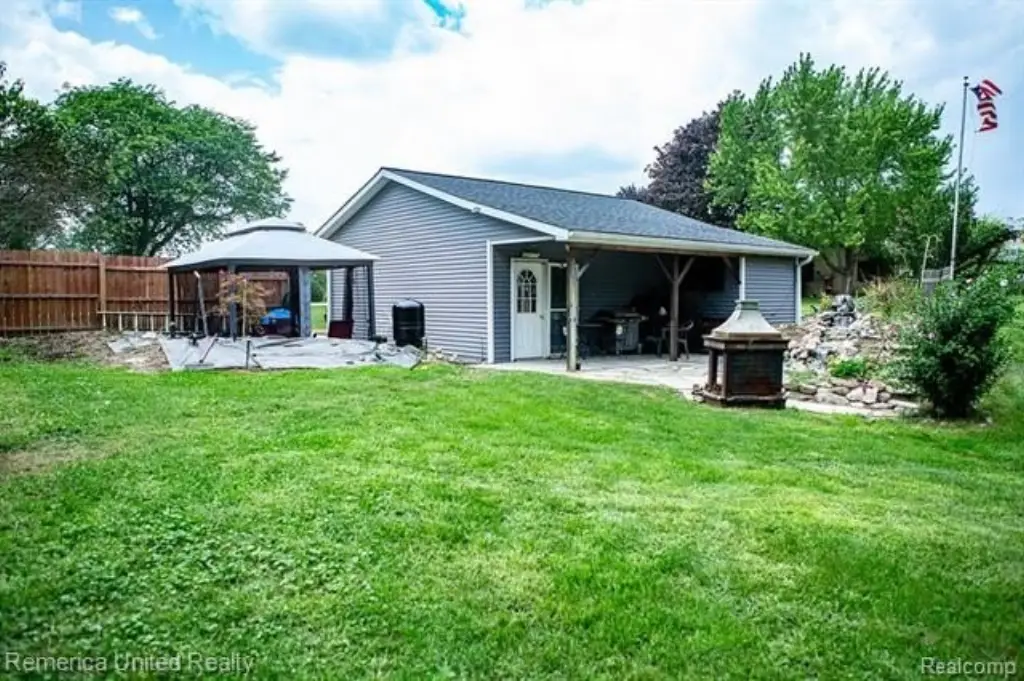
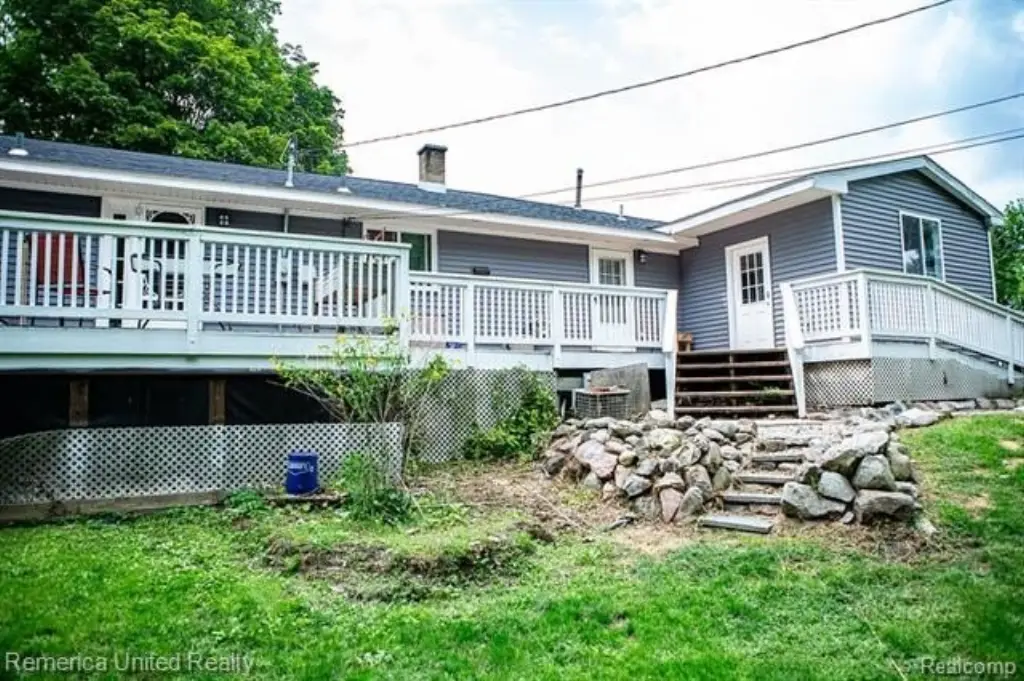
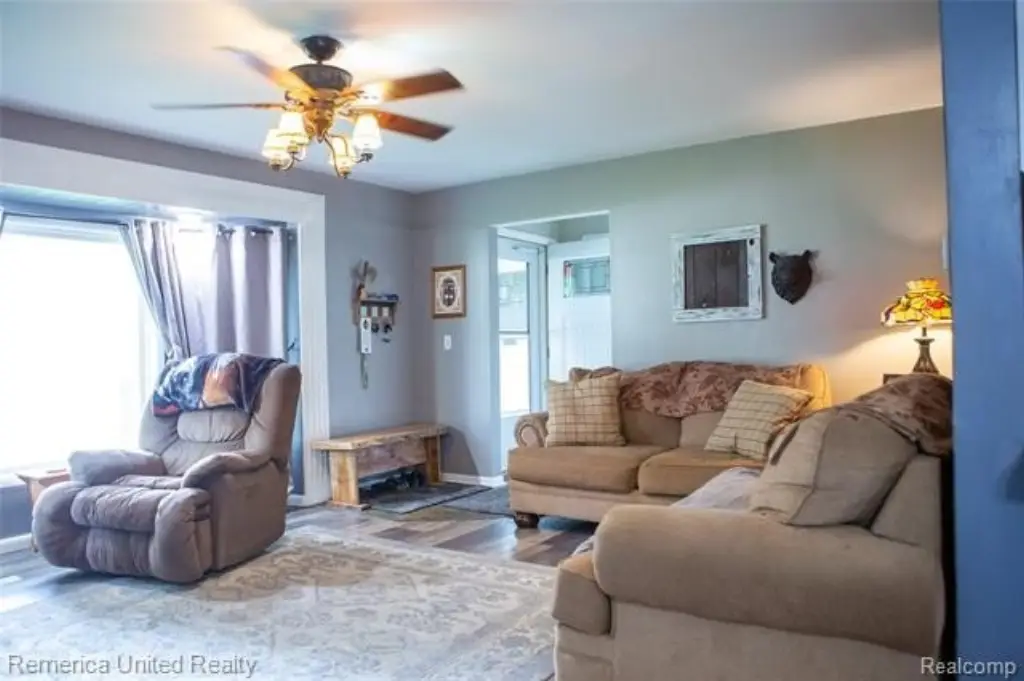
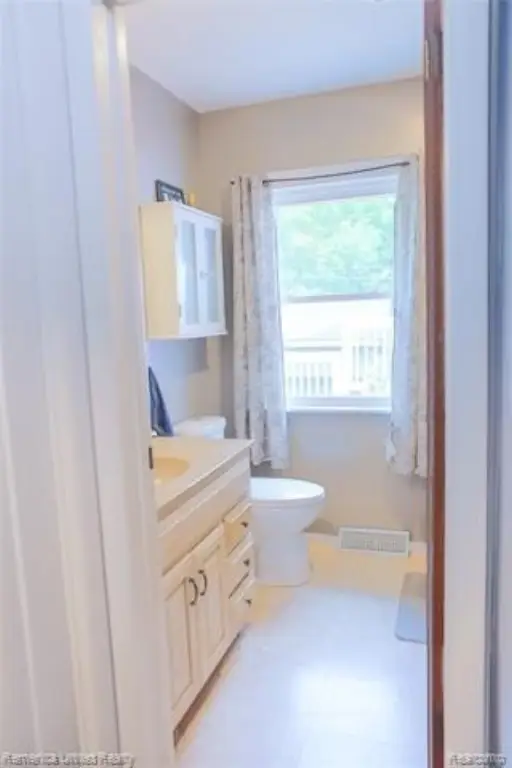
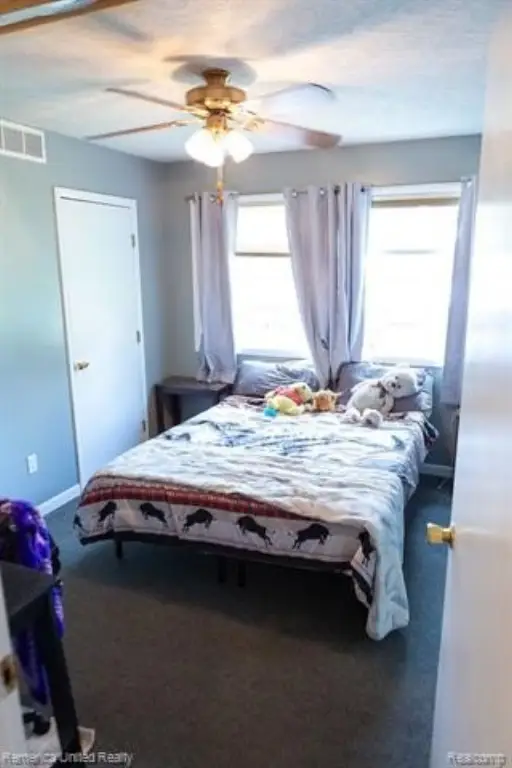
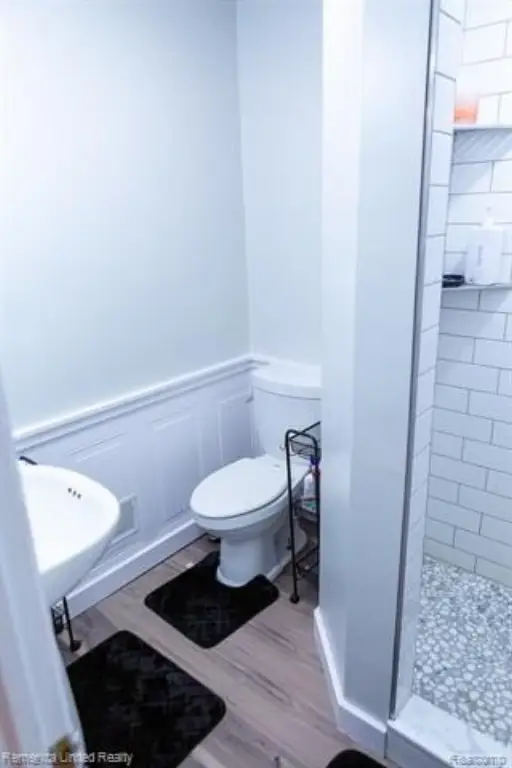
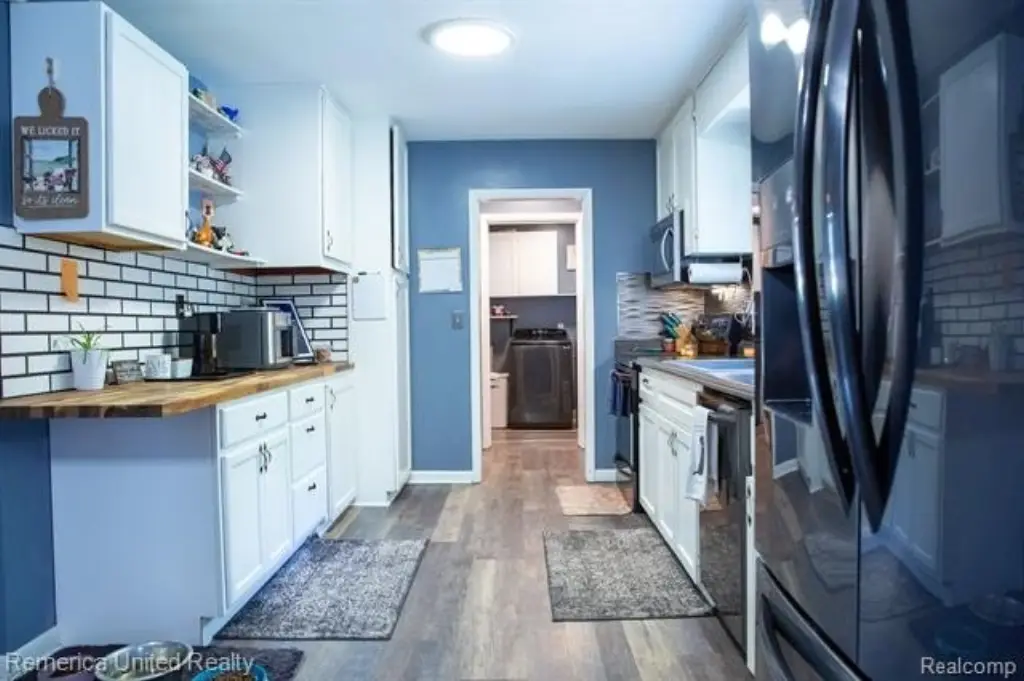
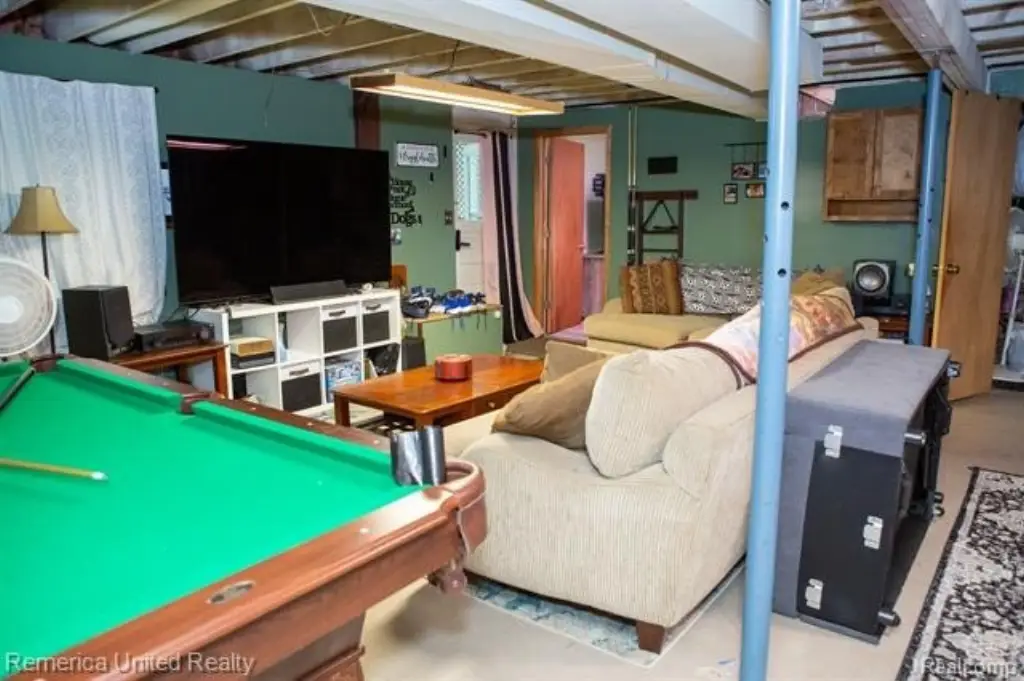
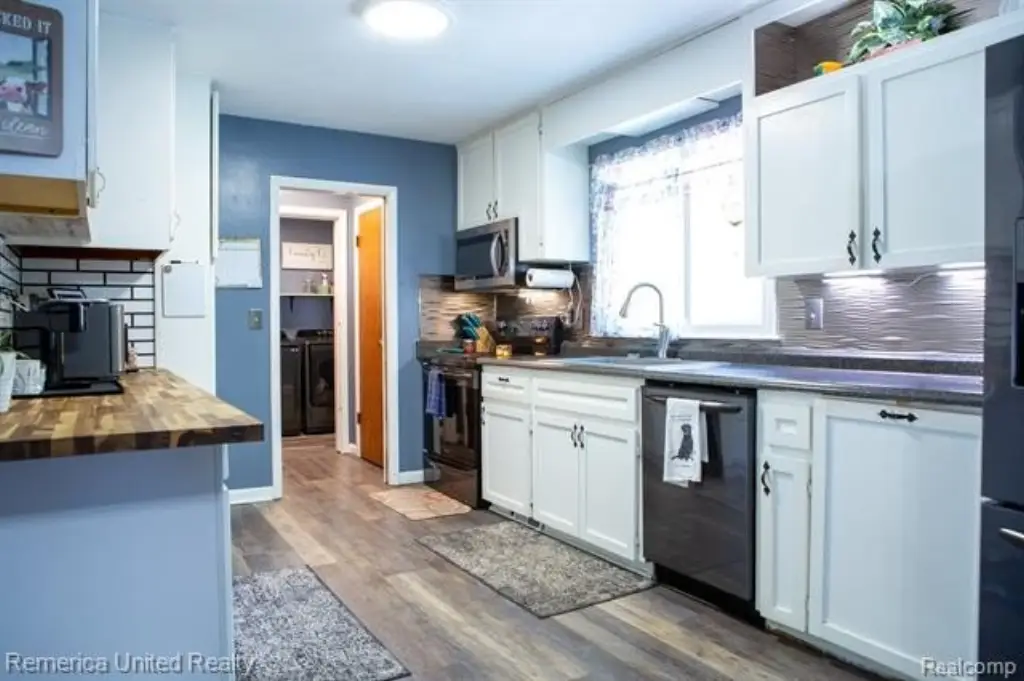
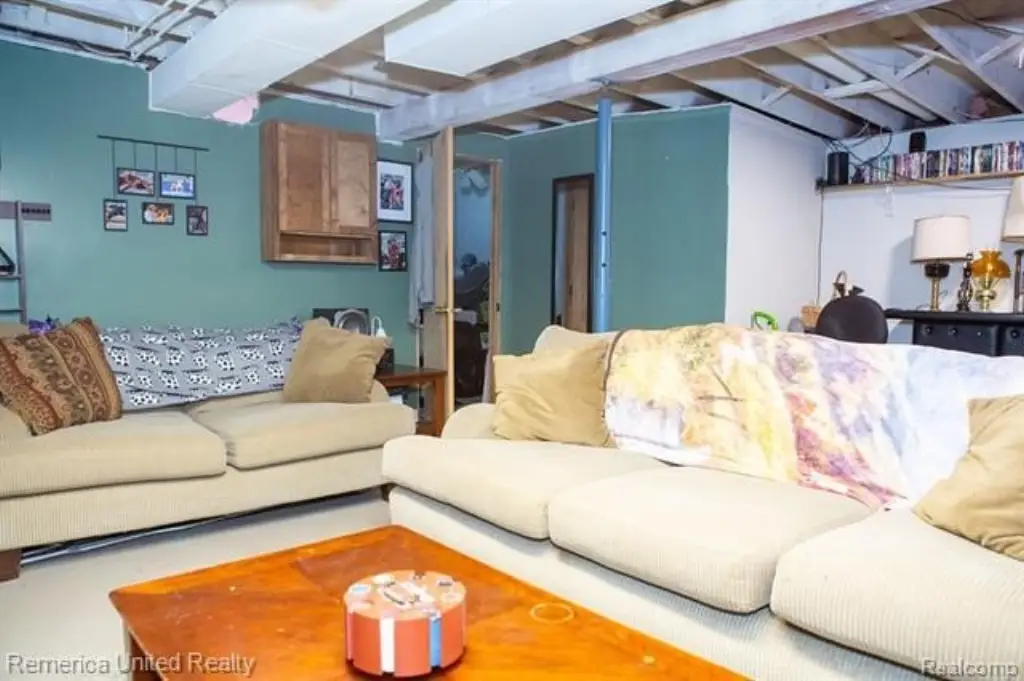
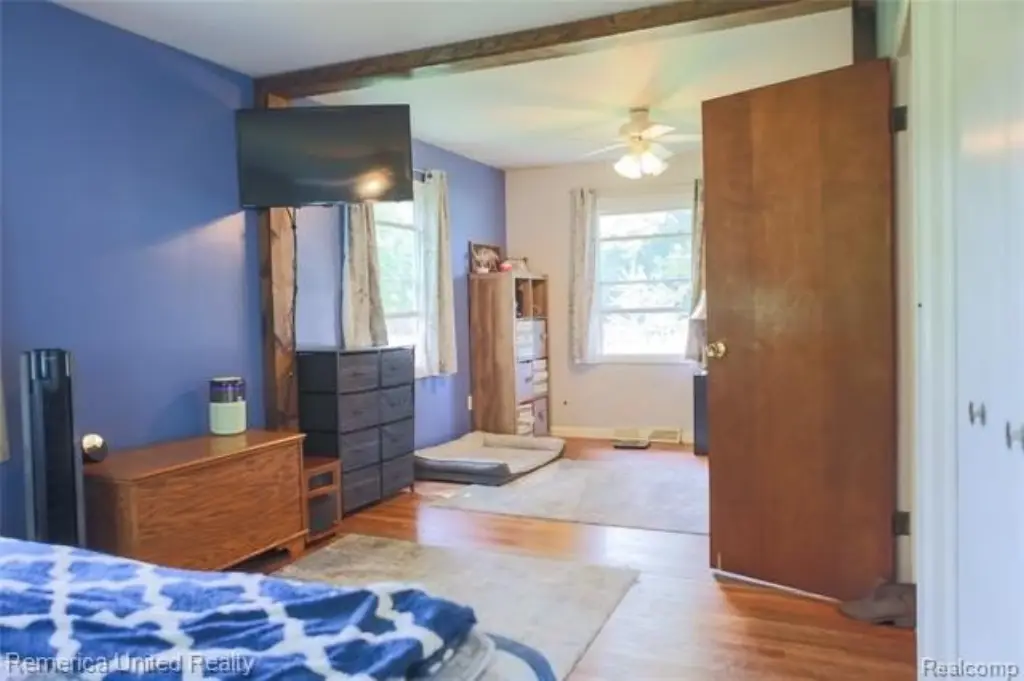
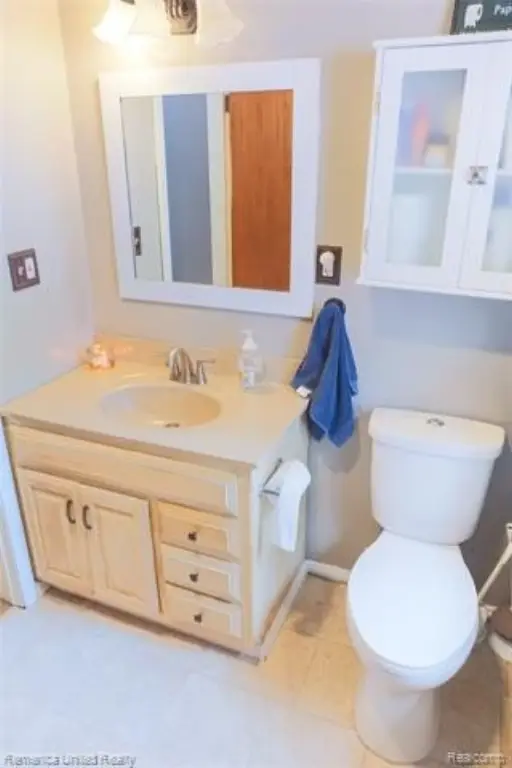
This 1,882-square-foot ranch-style duplex sits on a 0.66-acre parcel and includes a two-bedroom separate-entry apartment with a remodeled bathroom. The primary residence offers an open living arrangement, two main-floor bedrooms, an updated bathroom, and a renovated kitchen with newer black stainless-steel appliances. The lower level adds a walkout, half bath, two additional rooms with windows, and a large recreation area. A newer 2.5-car garage includes 220-volt service, keyless entry, an opener, and an 8-by-8-foot storage extension.
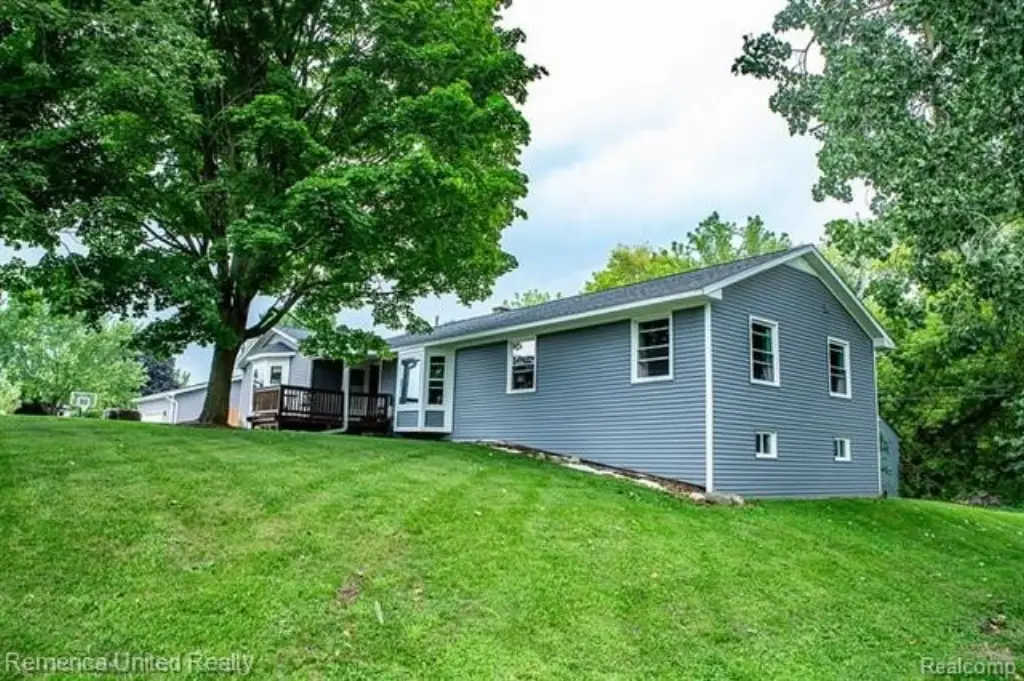
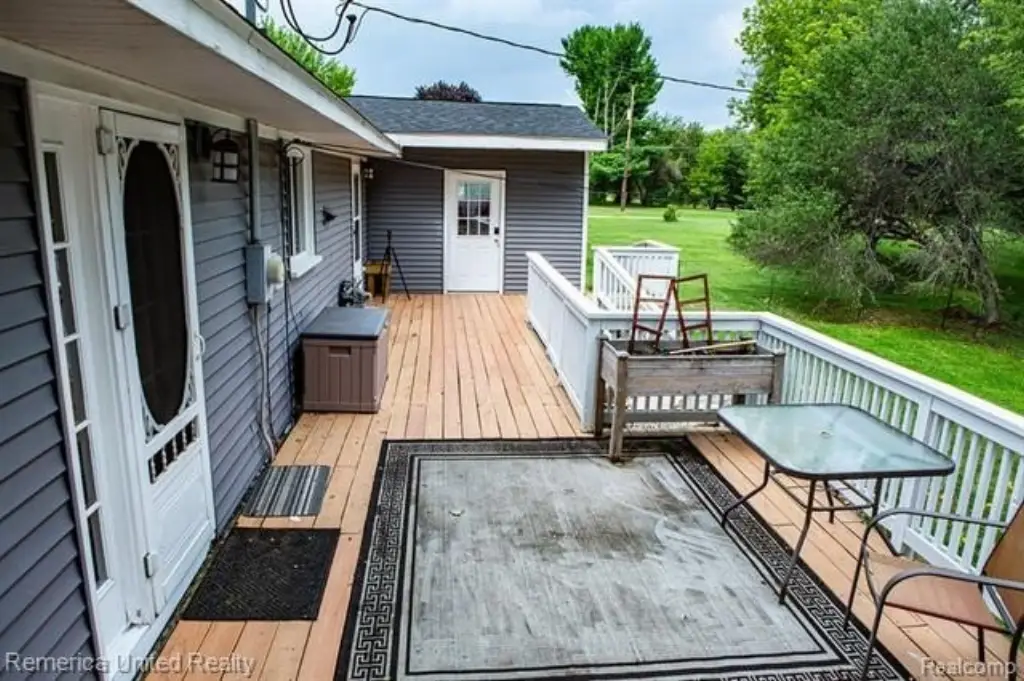
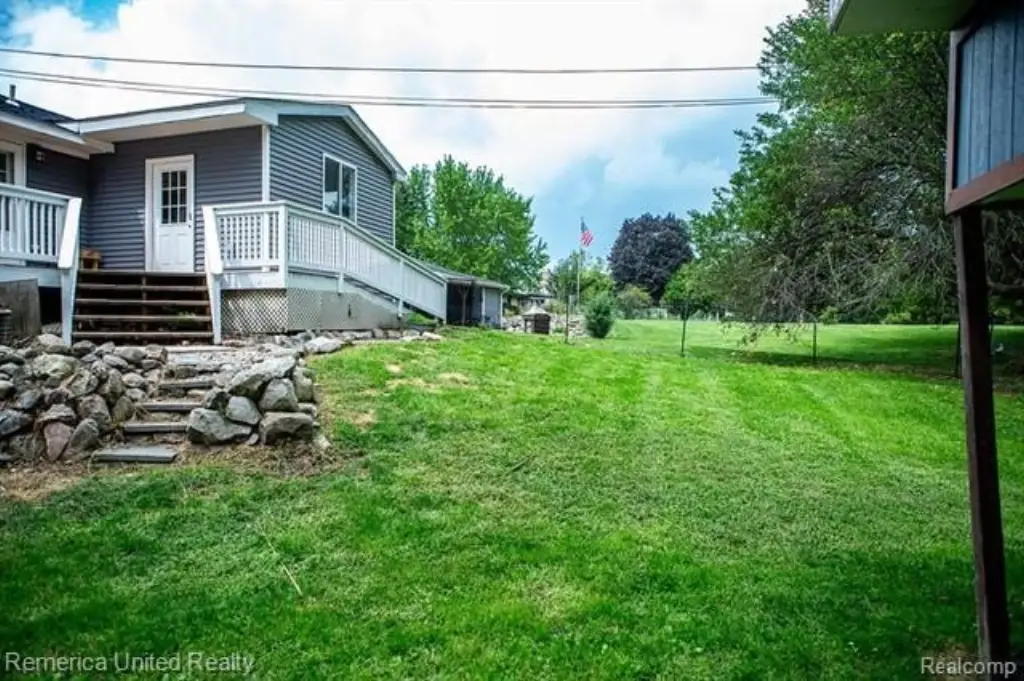
Additional improvements include a newer roof, windows, water heater, and vinyl siding. Central air, forced-air heat, an attic fan, and ceiling fans support year-round comfort. The property is zoned Multi-Family, Residential and was built in 1965. It is positioned on a dead-end street near sidewalks leading to the Fowlerville Schools Campus, with mature trees, wooded rear surroundings, and a large rear deck.
Additional improvements include a newer roof, windows, water heater, and vinyl siding. Central air, forced-air heat, an attic fan, and ceiling fans support year-round comfort. The property is zoned Multi-Family, Residential and was built in 1965. It is positioned on a dead-end street near sidewalks leading to the Fowlerville Schools Campus, with mature trees, wooded rear surroundings, and a large rear deck.
Key Highlights
- 1,882‑square‑foot ranch‑style duplex on 0.66 acres
- Separate‑entry 2‑bedroom apartment with remodeled bathroom
- Newer 2.5‑car garage with 220‑volt service and 8 x 8 storage bump out
Financial Insights
Estimated NOI and Cap Rate
NOI / Yr
$17,144
Cap Rate
4.29%
Suggested Prices Based on Cap Rates
Cap Rate 5%
$342,880
$342.9K
Cap Rate 7%
$244,914
$244.9K
Cap Rate 9%
$190,489
$190.5K
Market Conditions
NOI Build-Up for 1,882 SF
Gross rent
$26.0K $13.80/SF
− Vacancy
−$1.5K −$0.79/SF
EGI
$24.5K $13.01/SF
− OpEx
−$7.3K −$3.90/SF
NOI
$17.1K $9.11/SF
Area
Livingston County, MI
Vacancy
5.70%
Lease Rate
$13.80 /SF/Yr
Expense Ratio
30.00%
Simulate Cap Rate and NOI
Suggested Prices Based on Cap Rates
Cap Rate 5%
$342,880
Cap Rate 7%
$244,914
Cap Rate 9%
$190,489
Alternative Uses
Best Use
Multifamily LT 5
$244.9K
$214.3K – $285.7K
NOI $17,144 @ 7.0% cap · market cap 4.29%
Second Best
Apartment 5plus
$225.2K
$197.0K – $262.7K
NOI $15,763 @ 7.0% cap · market cap 3.94%
Theoretical Best
Healthcare Medical
$299.8K
$262.3K – $349.7K
NOI $20,984 @ 7.0% cap · market cap 5.25%
Zoning and permitted uses should be independently verified with authorities.
How Realmo checks its estimates
Property Analytics
Unlock full access to Insights
Subscribe to Realmo Intelligence
Open Analytics
Lease Details
Yes
Paved road access
Location Intelligence
Trade Area within ½ mile
233
Businesses Nearby
Explore this area
Business Placement
Demographics for 48836, MI
14,183
Population
5,614
Households
2.5
Avg Household Size
39
Median Age
21%
College-Educated
94%
High-School Grad
94.0 sq mi
ZIP Area
151
Density / Sq Mi
$86,317
Median Household Income
$47,510
Median Earnings
$1,068
Median Rent
$262,700
Median Home Value
Check the figures for this property
Cap Rate, Value Estimation, Potential NOI and more
View Realmo Analytics
Market
Vacancy Rate% for Multifamily in Midwest region
Frequently Asked Questions
What type of property is this?
Duplex - Flexible ranch layout includes a two-bedroom rental unit plus updated kitchen, bathrooms, windows, roof, water heater, and siding.
Where is this duplex located?
The property is located at 252 Pinewood Drive Fowlerville, MI.
What is the asking price?
The asking price for this property is $399,900.
What are key features of this property?
This property features: 1,882‑square‑foot ranch‑style duplex on 0.66 acres; Separate‑entry 2‑bedroom apartment with remodeled bathroom; Newer 2.5‑car garage with 220‑volt service and 8 x 8 storage bump out


