Mixed-Use Apartment and Retail
For Sale
Contact for pricing
248 East 4th Street, Loveland, CO 80537
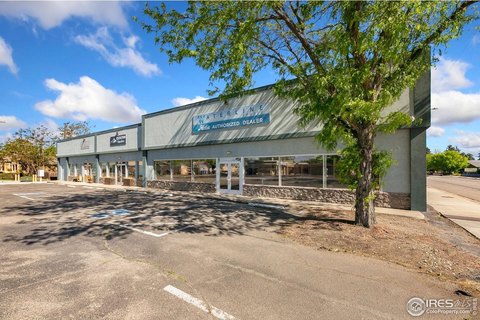
Stabilized mixed-use property with 27 apartment units and three established retail tenants across 21,004 square feet.
Property Size21,004 SF
Price / SF$223.77
Days on Market173
Property Features for 248 East 4th Street
General Information
Standard status
Active
Size
21,004 SF
Property subtype
Multifamily
Additional Details
Sprinkler System
Yes
Multifamily Units
27
Building Details
Year Built
1906
Year Renovated
2016
Units
27
Listing Agency:
Cushman & Wakefield - Denver, Colorado
Listed By:
Lee Wagner · License #CO 100084704
(417) 459-2155
Source:
Crexi
Added: May 5
Changed: Oct 20
Last Checked: Oct 23 at 4:00AM
Displayed information is deemed reliable but is not guaranteed and should be independently verified. All listing content including descriptions, pricing, images are the copyrighted material of Cushman & Wakefield - Denver, Colorado

Ask AI about this property
Review the available facts, identify missing information and prepare questions for the agent.
Investment Insights
Based on property information with market context.
Lincoln Apartments is a stabilized, mixed-use asset with 27 vintage apartment units and three established retail tenants totaling 21,004 square feet. The building has benefited from a series of capital improvements, including a comprehensive renovation completed in 2016 and additional major infrastructure work in 2023.
Renovations in 2016 included building-wide sprinkler installation supported in part by a City of Loveland grant of $423,559. In 2023, the property received a full electrical overhaul, new heating infrastructure, and a new roof.
The property is located on E. 4th Street in downtown Loveland and is described as being immediately proximate to the Rialto Theater, Loveland Museum, Benson Sculpture Garden, and a local brewery scene.
Renovations in 2016 included building-wide sprinkler installation supported in part by a City of Loveland grant of $423,559. In 2023, the property received a full electrical overhaul, new heating infrastructure, and a new roof.
The property is located on E. 4th Street in downtown Loveland and is described as being immediately proximate to the Rialto Theater, Loveland Museum, Benson Sculpture Garden, and a local brewery scene.
Key Highlights
- Lincoln Apartments in downtown Loveland features 27 apartment units plus 3 established retail tenants.
- 21,004 SF mixed‑use building on E. 4th Street, steps from the Rialto Theater, Loveland Museum, and Benson Sculpture Garden.
- Renovated in 2016, including a City of Loveland grant of $423,559 for building‑wide sprinkler installation.
Financial Insights
Estimated NOI and Cap Rate
NOI / Yr
$199,906
Cap Rate
4.25%
Suggested Prices Based on Cap Rates
Cap Rate 5%
$3,998,120
$4.0M
Cap Rate 7%
$2,855,800
$2.9M
Cap Rate 9%
$2,221,178
$2.2M
Market Conditions
NOI Build-Up for 21,004 SF
Gross rent
$380.6K $18.12/SF
− Vacancy
−$17.1K −$0.82/SF
EGI
$363.5K $17.30/SF
− OpEx
−$163.6K −$7.79/SF
NOI
$199.9K $9.52/SF
Area
Larimer County, CO
Vacancy
4.50%
Lease Rate
$18.12 /SF/Yr
Expense Ratio
45.00%
Simulate Cap Rate and NOI
Suggested Prices Based on Cap Rates
Cap Rate 5%
$3,998,120
Cap Rate 7%
$2,855,800
Cap Rate 9%
$2,221,178
Alternative Uses
Best Use
Apartment 5plus
$2.86M
$2.50M – $3.33M
NOI $199,906 @ 7.0% cap · market cap 4.25%
Second Best
Retail
$2.63M
$2.30M – $3.06M
NOI $183,773 @ 7.0% cap · market cap 3.91%
Theoretical Best
Office A
$5.64M
$4.93M – $6.58M
NOI $394,647 @ 7.0% cap · market cap 8.40%
Zoning and permitted uses should be independently verified with authorities.
How Realmo checks its estimates
Property Analytics
Contact the owner directly
Get the owner's phone numbers and email
Open Analytics
Current Use
Lease Details
27
Residential units
Yes
Sprinkler system
Location Intelligence
Trade Area within ½ mile
1,671
Businesses Nearby
Explore this area
Business Placement
Demographics for 80537, CO
43,603
Population
20,314
Households
2.1
Avg Household Size
44
Median Age
37%
College-Educated
95%
High-School Grad
122.4 sq mi
ZIP Area
356
Density / Sq Mi
$83,746
Median Household Income
$44,448
Median Earnings
$1,630
Median Rent
$460,100
Median Home Value
Check the figures for this property
Cap Rate, Value Estimation, Potential NOI and more
View Realmo Analytics
Market
Vacancy Rate% for Multifamily in West region




Frequently Asked Questions
What type of property is this?
Apartment building - Stabilized mixed-use property with 27 apartment units and three established retail tenants across 21,004 square feet.
Where is this apartment building located?
The property is located at 248 East 4th Street Loveland, CO.
What is the asking price?
The asking price for this property is $4,700,000.
What are key features of this property?
This property features: Lincoln Apartments in downtown Loveland features 27 apartment units plus 3 established retail tenants.; 21,004 SF mixed‑use building on E. 4th Street, steps from the Rialto Theater, Loveland Museum, and Benson Sculpture Garden.; Renovated in 2016, including a City of Loveland grant of $423,559 for building‑wide sprinkler installation.


