Attached Two-Family Row
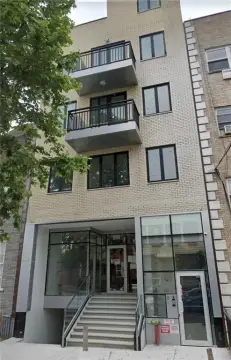
2462 BRAGG ST. Brooklyn, NY 11235
For Sale
Contact for pricing
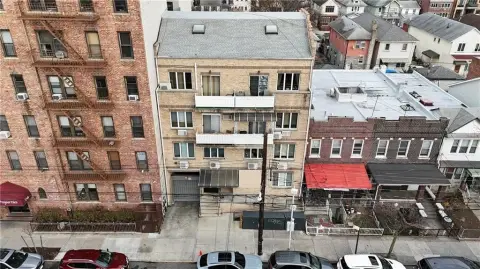
Updated two-family attached home with hardwood floors, renovated baths, a full basement, and two off-street parking spaces.
Property Size2,244 SF
Price / SF$579.27
Days on Market19
Property Features for 2462 BRAGG ST.
General Information
Standard status
Active
Size
2,244 SF
Property subtype
Mixed Use
Building Details
Year Built
1955
Listing Agency:
LOMBARDO HOMES & ESTATES
(516) 200-6448
Listed By:
Joseph Lombardo · License #10311204851
Source:
Crexi
Added: Jul 9
Changed: Jul 23
Last Checked: Jul 27 at 10:11AM
Displayed information is deemed reliable but is not guaranteed and should be independently verified. All listing content including descriptions, pricing, images are the copyrighted material of LOMBARDO HOMES & ESTATES
Investment Insights
Based on property information with market context.
This updated attached two-family row house offers approximately 2,244 square feet across a full three-story layout. The property includes 5 bedrooms and 4 bathrooms, along with a full basement. Interior highlights noted in the offering include an updated kitchen, hardwood floors, and renovated bathrooms finished with custom Italian stone. The home is described as having custom Italian stone baseboard heat and natural gas. The exterior is reported to include an asphalt roof, and major mechanical updates include a newer roof (approximately 2 years old), a recently updated furnace, and a hot water heater.
The property features two off-street parking spaces and is served by public water and public sewer. It is located in the Sheepshead Bay neighborhood of Brooklyn, with a Walk Score of 94 and proximity to the Sheepshead Bay waterfront, restaurants, shopping, and public transportation.
As a residential income property, the home currently has a tenant in place in the rental unit who is willing to remain, supporting both owner-occupant and investor use.
The property features two off-street parking spaces and is served by public water and public sewer. It is located in the Sheepshead Bay neighborhood of Brooklyn, with a Walk Score of 94 and proximity to the Sheepshead Bay waterfront, restaurants, shopping, and public transportation.
As a residential income property, the home currently has a tenant in place in the rental unit who is willing to remain, supporting both owner-occupant and investor use.
Key Highlights
- Updated 2‑family attached home built in 1955 with approx. 2,244 SF, 5 bedrooms and 4 bathrooms
- Owner unit features updated kitchen, hardwood floors, and renovated bathrooms with custom Italian stone
- Custom Italian stone baseboard heat with natural gas; full basement in the home
Financial Insights For Multifamily LT 5
Simulate Cap Rate and NOI
NOI Build-Up
- Vacancy
- income lost from leasable area expected to sit empty during the year — subtracted from gross rent.
- EGI (Effective Gross Income)
- gross rent minus vacancy losses — the realistic income before paying operating costs.
- OpEx (Operating Expenses)
- recurring costs to operate the property (property tax, insurance, utilities, maintenance, management) — excludes financing and capital improvements.
- NOI (Net Operating Income)
- income a property generates after operating costs but before financing and taxes.
| Component | $ | $/SF |
|---|---|---|
| Gross rent | $114.4k | $51.00 |
| − Vacancy | −$2.2k | −$0.97 |
| EGI | $112.3k | $50.03 |
| − OpEx | −$33.7k | −$15.01 |
| NOI | $78.6k | $35.02 |
2,244 SF · lease $51.00/SF/yr · vacancy 1.90% · expense 30.00%
Alternative Uses
Best Use
Multifamily LT 5
$1.12M
$982.4K – $1.31M
NOI $78,589 @ 7.0% cap · market cap 6.05%
Second Best
Apartment 5plus
$978.7K
$856.3K – $1.14M
NOI $68,507 @ 7.0% cap · market cap 5.27%
Theoretical Best
Specialty Retail
$1.86M
$1.63M – $2.17M
NOI $130,062 @ 7.0% cap · market cap 10.01%
Zoning and permitted uses should be independently verified with authorities.
Property Analytics
Location Intelligence
Current Use
Frequently Asked Questions
What type of property is this?
Duplex - Updated two-family attached home with hardwood floors, renovated baths, a full basement, and two off-street parking spaces.
Where is this duplex located?
The property is located at 2462 BRAGG ST. Brooklyn, NY.
What is the asking price?
The asking price for this property is $1,299,888.
What are key features of this property?
This property features: Updated 2‑family attached home built in 1955 with approx. 2,244 SF, 5 bedrooms and 4 bathrooms; Owner unit features updated kitchen, hardwood floors, and renovated bathrooms with custom Italian stone; Custom Italian stone baseboard heat with natural gas; full basement in the home