Two-Story Office Building with
For Sale
$2,500,000
243 Pegasus Drive, Bozeman, MT 59718
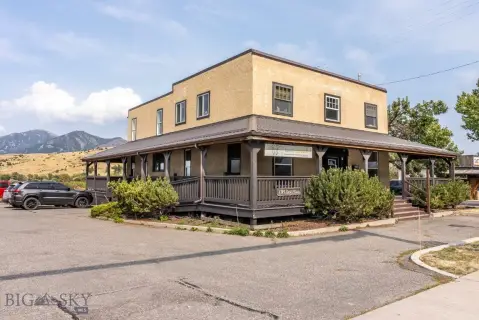
Two-story office building with private offices, open work areas, and a recording studio for flexible tenant or owner-operator use.
Property Size10,104 SF
Lot Size0.84 Acres
Price / SF$247.43
Days on Market195
Property Features for 243 Pegasus Drive
General Information
Standard status
Active
Size
10,104 SF
Lot size
0.84 Acres
Property subtype
Commercial
Zoning
C
Additional Details
Sprinkler System
Yes
Office Units
21
Taxes and HOA fees
Annual Taxes
$18,957
Building Details
Building Size
10,104 SF
Year Built
2006
Stories
2
Listing Agency:
Windermere Great Divide-Bozeman
(406) 995-2404
Listed By:
Ashley Keller
(406) 407-2520
Source:
Outlaw
Added: Mar 25
Changed: Sep 30
Last Checked: Oct 4 at 7:45AM
Displayed information is deemed reliable but is not guaranteed and should be independently verified. All listing content including descriptions, pricing, images are the copyrighted material of Windermere Great Divide-Bozeman
Investment Insights
Based on property information with market context.
Built in 2006, this 10,104 SF two-story office building sits on 1.84 acres in the Galactic Park Subdivision of Four Corners. The interior includes 21 private offices, four open work areas, a conference room, break room, recording studio, green room, and five restrooms, supported by mechanical and storage rooms. A welcoming reception area anchors the main entrance, while an elevator and two stairwells provide second-floor access.
The property is set in a quiet, low-traffic setting near the Gallatin River and is surrounded by high-end homes, offering a more relaxed alternative to busier commercial corridors. Nearby employers include Zoot Enterprises, Mesa Labs, and Wildfire Defense Systems, which may be convenient for office users in related industries.
For tenants and buyers seeking a flexible office configuration, the mix of private offices, open space, and dedicated studio rooms supports a range of professional uses, including general office operations and creative or recording-focused requirements. The building is serviced by Four Corners Water & Sewer and is equipped with a fire suppression system. The property is reported to be in good condition with no known deferred maintenance, with mechanical and storage support spaces already in place.
The property is set in a quiet, low-traffic setting near the Gallatin River and is surrounded by high-end homes, offering a more relaxed alternative to busier commercial corridors. Nearby employers include Zoot Enterprises, Mesa Labs, and Wildfire Defense Systems, which may be convenient for office users in related industries.
For tenants and buyers seeking a flexible office configuration, the mix of private offices, open space, and dedicated studio rooms supports a range of professional uses, including general office operations and creative or recording-focused requirements. The building is serviced by Four Corners Water & Sewer and is equipped with a fire suppression system. The property is reported to be in good condition with no known deferred maintenance, with mechanical and storage support spaces already in place.
Key Highlights
- 10,104 SF two‑story office building on 0.84 acres, built in 2006
- Layout includes 21 private offices, four open work areas, and a welcoming reception area
- Conference room and break room plus recording studio and green room included
Financial Insights
Estimated NOI and Cap Rate
NOI / Yr
$148,635
Cap Rate
5.95%
Suggested Prices Based on Cap Rates
Cap Rate 5%
$2,972,700
$3.0M
Cap Rate 7%
$2,123,357
$2.1M
Cap Rate 9%
$1,651,500
$1.7M
Market Conditions
NOI Build-Up for 10,104 SF
Gross rent
$212.2K $21.00/SF
− Vacancy
−$14.0K −$1.39/SF
EGI
$198.2K $19.61/SF
− OpEx
−$49.5K −$4.90/SF
NOI
$148.6K $14.71/SF
Area
Gallatin County, MT
Vacancy
6.60%
Lease Rate
$21.00 /SF/Yr
Expense Ratio
25.00%
Simulate Cap Rate and NOI
Suggested Prices Based on Cap Rates
Cap Rate 5%
$2,972,700
Cap Rate 7%
$2,123,357
Cap Rate 9%
$1,651,500
Alternative Uses
Best Use
Office B
$2.12M
$1.86M – $2.48M
NOI $148,635 @ 7.0% cap · market cap 5.95%
Second Best
—
—
no second resolved use
Theoretical Best
Office A
$2.64M
$2.31M – $3.08M
NOI $184,685 @ 7.0% cap · market cap 7.39%
Zoning and permitted uses should be independently verified with authorities.
Property Analytics
Unlock full access to Insights
Subscribe to Realmo Intelligence
Open Analytics
Current Use
Lease Details
21
Office units
Yes
Sprinkler system
Location Intelligence
Trade Area within ½ mile
101
Businesses Nearby
Explore this area
Business Placement
Demographics for 59718, MT
43,831
Population
19,765
Households
2.2
Avg Household Size
33
Median Age
57%
College-Educated
97%
High-School Grad
164.5 sq mi
ZIP Area
266
Density / Sq Mi
$91,852
Median Household Income
$44,915
Median Earnings
$1,748
Median Rent
$579,800
Median Home Value
Check the figures for this property
Cap Rate, Value Estimation, Potential NOI and more
View Realmo Analytics
Market
Vacancy Rate% for Office in West region

Questions? Ask Rey
Realmo’s AI knows this listing — price, zoning, demand, history. Ask anything.



Frequently Asked Questions
What type of property is this?
Office building - Two-story office building with private offices, open work areas, and a recording studio for flexible tenant or owner-operator use.
Where is this office building located?
The property is located at 243 Pegasus Drive Bozeman, MT.
What is the asking price?
The asking price for this property is $2,500,000.
What are key features of this property?
This property features: 10,104 SF two‑story office building on 0.84 acres, built in 2006; Layout includes 21 private offices, four open work areas, and a welcoming reception area; Conference room and break room plus recording studio and green room included