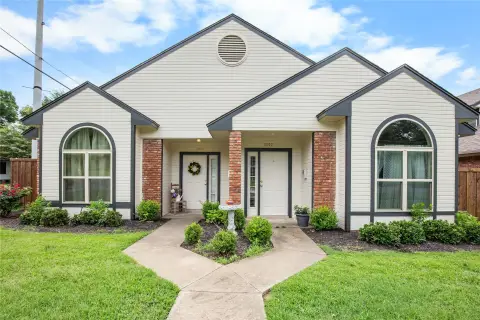
Updated Duplex with
For Sale
$269,500
Pending
2413 North Lockhart Street, Sherman, TX 75092
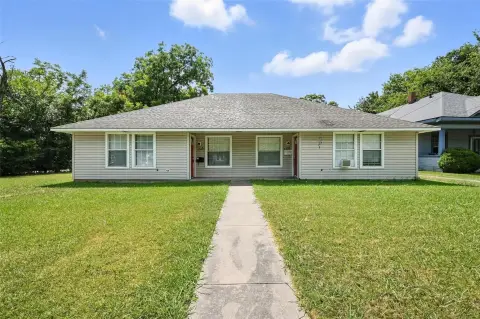
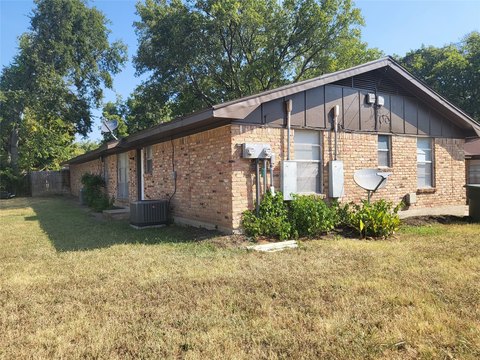
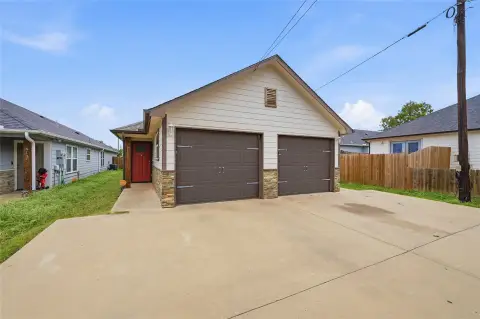
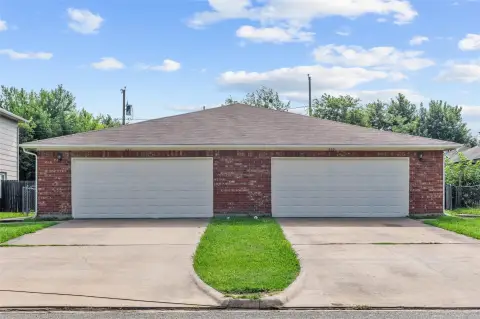
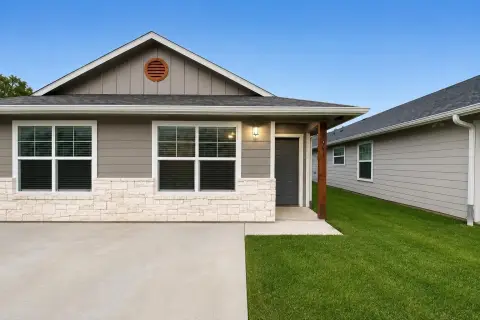
Well-maintained two-unit property with refreshed interiors, separate garages, and a storage building.
Property Size1,741 SF
Days on Market187
Property Features for 2413 North Lockhart Street
General Information
Standard status
Pending
Size
1,741 SF
Total Parking Spaces
4
Property subtype
Multi-Family / Full Duplex
Units
Unit Mix
2 x 2BR/1BA
Multifamily Units
2
Parking per Unit
1
Additional Details
Utilities to Site
Yes
Amenities
storage building
Ceiling Fan(s), Central Air
Central, Electric
Ceramic Tile, Laminate
Dishwasher, Disposal, Electric Range
Cable TV Available, Decorative Lighting, Eat-in Kitchen, High Speed Internet Available
No
Composition
One
Chain Link, Wood
Storage
1
Slab
Assessor
2
Brick
Building Details
Year Built
1966
Buildings
1
Listing Agency:
Keller Williams North Country
Listed By:
Robin Atherton · License #0535305
(903) 815-3870
Source:
Compass
Added: Apr 20
Changed: Oct 21
Last Checked: Oct 20 at 11:21PM
Displayed information is deemed reliable but is not guaranteed and should be independently verified. All listing content including descriptions, pricing, images are the copyrighted material of Keller Williams North Country

Ask AI about this property
Review the available facts, identify missing information and prepare questions for the agent.
Investment Insights
Based on property information with market context.
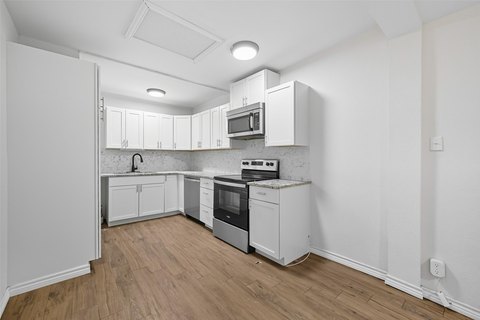
Built in 1966, this duplex contains two separate residences, each offering two bedrooms, one bathroom, and a one-car garage. The 1,741-square-foot property has fresh interior and exterior paint, laminate flooring with an underlayment moisture barrier, ceramic tile in the kitchens and baths, updated countertops and sinks, ceiling fans, and revised light fixtures. Both units have central air, electric heat pumps, dishwashers, disposals, and electric ranges.
Electrical panels serving both sides were updated in 2020. Sewer lines between the street and the home were replaced in 2025, along with installation of Carrier heat pumps that remain under warranty. A Class IV hail-resistant roof and gutters were completed in June 2023. The address includes 2413 and 2415 N. Lockhart Street, with a 10 by 16 storage building behind 2415. Fairview Elementary School and Fairview Park are nearby; the park includes playgrounds, a pool, tennis courts, soccer fields, and baseball fields.
Electrical panels serving both sides were updated in 2020. Sewer lines between the street and the home were replaced in 2025, along with installation of Carrier heat pumps that remain under warranty. A Class IV hail-resistant roof and gutters were completed in June 2023. The address includes 2413 and 2415 N. Lockhart Street, with a 10 by 16 storage building behind 2415. Fairview Elementary School and Fairview Park are nearby; the park includes playgrounds, a pool, tennis courts, soccer fields, and baseball fields.
Key Highlights
- Two‑unit duplex with 2 bedrooms, 1 bath, and a one‑car garage on each side
- 1,741 SF property built in 1966
- Electrical panels on both sides updated in 2020
Financial Insights
Estimated NOI and Cap Rate
NOI / Yr
$13,346
Cap Rate
4.95%
Suggested Prices Based on Cap Rates
Cap Rate 5%
$266,920
$266.9K
Cap Rate 7%
$190,657
$190.7K
Cap Rate 9%
$148,289
$148.3K
Market Conditions
NOI Build-Up for 1,741 SF
Gross rent
$21.5K $12.36/SF
− Vacancy
−$2.5K −$1.41/SF
EGI
$19.1K $10.95/SF
− OpEx
−$5.7K −$3.29/SF
NOI
$13.3K $7.67/SF
Area
Grayson County, TX
Vacancy
11.40%
Lease Rate
$12.36 /SF/Yr
Expense Ratio
30.00%
Simulate Cap Rate and NOI
Suggested Prices Based on Cap Rates
Cap Rate 5%
$266,920
Cap Rate 7%
$190,657
Cap Rate 9%
$148,289
Alternative Uses
Best Use
Multifamily LT 5
$190.7K
$166.8K – $222.4K
NOI $13,346 @ 7.0% cap · market cap 4.95%
Second Best
Apartment 5plus
$169.0K
$147.9K – $197.2K
NOI $11,831 @ 7.0% cap · market cap 4.39%
Theoretical Best
Hotel Hospitality
$893.1K
$781.5K – $1.04M
NOI $62,519 @ 7.0% cap · market cap 23.20%
Zoning and permitted uses should be independently verified with authorities.
How Realmo checks its estimates
Property Analytics
Contact the owner directly
Get the owner's phone numbers and email
Open Analytics
Lease Details
2
Residential units
Yes
Utilities to site
Location Intelligence
Trade Area within ½ mile
332
Businesses Nearby
Explore this area
Business Placement
Demographics for 75092, TX
27,186
Population
13,117
Households
2.1
Avg Household Size
39
Median Age
30%
College-Educated
94%
High-School Grad
113.9 sq mi
ZIP Area
239
Density / Sq Mi
$67,160
Median Household Income
$41,683
Median Earnings
$1,205
Median Rent
$260,100
Median Home Value
Check the figures for this property
Cap Rate, Value Estimation, Potential NOI and more
View Realmo Analytics
Market
Vacancy Rate% for Multifamily in South region


Frequently Asked Questions
What type of property is this?
Duplex - Well-maintained two-unit property with refreshed interiors, separate garages, and a storage building.
Where is this duplex located?
The property is located at 2413 North Lockhart Street Sherman, TX.
What is the asking price?
The asking price for this property is $269,500.
What are key features of this property?
This property features: Two‑unit duplex with 2 bedrooms, 1 bath, and a one‑car garage on each side; 1,741 SF property built in 1966; Electrical panels on both sides updated in 2020


