Freestanding Warehouse
For Sale
Contact for pricing
241 N Pacific Avenue, San Pedro, CA 90731
Freestanding warehouse near the Port of Los Angeles and West Harbor waterfront development, supporting flexible industrial operations.
Property Size2,430 SF
Price / SF$431.69
Days on Market140
Property Features for 241 N Pacific Avenue
General Information
Standard status
Active
Size
2,430 SF
Property subtype
Industrial
Zoning
C2-1VL-CPIO
Investment Type
Owner/User
Additional Details
Highway Access
Yes
Building Details
Year Built
1977
Buildings
1
Stories
1
Listing Agency:
WESTMAC
Listed By:
Milan Sigal Ashley · License #CA 02114806
(310) 966-4352
Source:
Crexi
Added: Jun 2
Changed: Oct 16
Last Checked: Oct 19 at 7:19AM
Displayed information is deemed reliable but is not guaranteed and should be independently verified. All listing content including descriptions, pricing, images are the copyrighted material of WESTMAC

Ask AI about this property
Review the available facts, identify missing information and prepare questions for the agent.
Investment Insights
Based on property information with market context.
241 N Pacific Avenue is a freestanding commercial warehouse totaling 2,430 square feet, offering a functional industrial layout and operational flexibility. The property’s configuration supports warehouse and distribution use, as well as contractor and creative industrial operations that need dedicated, street-facing access.
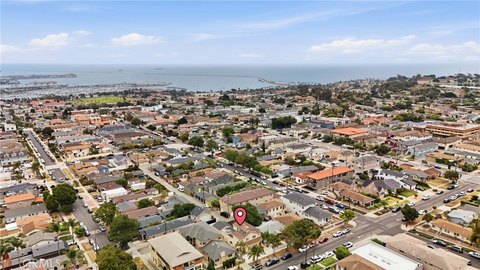
Located in the heart of San Pedro, the site is described as moments from the Port of Los Angeles and the new West Harbor waterfront development. It also benefits from regional connectivity to major transportation corridors, including the I-110 Freeway and the Vincent Thomas Bridge, with proximity to port infrastructure. The property is presented as having strong street presence along Pacific Avenue and is near the LA Waterfront district, including the USS Iowa Museum and the Los Angeles Waterfront.
For tenants, this asset is positioned for practical industrial use where a freestanding warehouse can streamline day-to-day operations. For owner-users, the layout may accommodate warehousing and distribution workflows, while investors and operators may value the infill, port-adjacent setting described in the offering for diversified industrial tenant fit.
Located in the heart of San Pedro, the site is described as moments from the Port of Los Angeles and the new West Harbor waterfront development. It also benefits from regional connectivity to major transportation corridors, including the I-110 Freeway and the Vincent Thomas Bridge, with proximity to port infrastructure. The property is presented as having strong street presence along Pacific Avenue and is near the LA Waterfront district, including the USS Iowa Museum and the Los Angeles Waterfront.
For tenants, this asset is positioned for practical industrial use where a freestanding warehouse can streamline day-to-day operations. For owner-users, the layout may accommodate warehousing and distribution workflows, while investors and operators may value the infill, port-adjacent setting described in the offering for diversified industrial tenant fit.
Key Highlights
- Freestanding commercial warehouse on N Pacific Avenue in San Pedro (built 1977).
- Port‑adjacent setting near the Port of Los Angeles and the new West Harbor waterfront development.
- Functional industrial layout suited for owner‑users, warehouse/distribution, contractors, creative industrial users, or investors.
Financial Insights
Estimated NOI and Cap Rate
NOI / Yr
$36,656
Cap Rate
3.49%
Suggested Prices Based on Cap Rates
Cap Rate 5%
$733,120
$733.1K
Cap Rate 7%
$523,657
$523.7K
Cap Rate 9%
$407,289
$407.3K
Market Conditions
NOI Build-Up for 2,430 SF
Gross rent
$46.1K $18.96/SF
− Vacancy
−$2.9K −$1.21/SF
EGI
$43.1K $17.75/SF
− OpEx
−$6.5K −$2.66/SF
NOI
$36.7K $15.08/SF
Area
Los Angeles, CA
Vacancy
6.40%
Lease Rate
$18.96 /SF/Yr
Expense Ratio
15.00%
Simulate Cap Rate and NOI
Suggested Prices Based on Cap Rates
Cap Rate 5%
$733,120
Cap Rate 7%
$523,657
Cap Rate 9%
$407,289
Alternative Uses
Best Use
Warehouse
$523.7K
$458.2K – $610.9K
NOI $36,656 @ 7.0% cap · market cap 3.49%
Second Best
Industrial
$431.2K
$377.3K – $503.1K
NOI $30,187 @ 7.0% cap · market cap 2.88%
Theoretical Best
Multifamily LT 5
$49.23M
$43.08M – $57.44M
NOI $3,446,124 @ 7.0% cap · market cap 328.52%
Zoning and permitted uses should be independently verified with authorities.
How Realmo checks its estimates
Property Analytics
Unlock full access to Insights
Subscribe to Realmo Intelligence
Open Analytics
Current Use
Lease Details
Yes
Highway access
Location Intelligence
Trade Area within ½ mile
3,746
Businesses Nearby
Balanced
Demand for This Use
Explore this area
Business Placement
Demographics for 90731, CA
61,270
Population
24,477
Households
2.5
Avg Household Size
38
Median Age
25%
College-Educated
81%
High-School Grad
9.3 sq mi
ZIP Area
6,588
Density / Sq Mi
$71,936
Median Household Income
$41,324
Median Earnings
$1,645
Median Rent
$808,800
Median Home Value
Check the figures for this property
Cap Rate, Value Estimation, Potential NOI and more
View Realmo Analytics
Market
Vacancy Rate% for Industrial in West region





Similar Off Market Nearby
- BagsAway Luggage Storage — 1207 Ocean Front Walk, Venice, CA 90291
- Stasher - Luggage Storage Venice LA — 522 S Venice Blvd, Venice, CA 90291
- CitySpareSpace Luggage Storage — 522 Venice Blvd., Venice, CA 90291
- Bounce Luggage Storage — 522 Venice Blvd., Los Angeles, CA 90291
- LuggageHero — 522 Venice Blvd., Venice, CA 90291
Frequently Asked Questions
What type of property is this?
Warehouse - Freestanding warehouse near the Port of Los Angeles and West Harbor waterfront development, supporting flexible industrial operations.
Where is this warehouse located?
The property is located at 241 N Pacific Avenue San Pedro, CA.
What is the asking price?
The asking price for this property is $1,049,000.
What are key features of this property?
This property features: Freestanding commercial warehouse on N Pacific Avenue in San Pedro (built 1977).; Port‑adjacent setting near the Port of Los Angeles and the new West Harbor waterfront development.; Functional industrial layout suited for owner‑users, warehouse/distribution, contractors, creative industrial users, or investors.


