Flex Property with

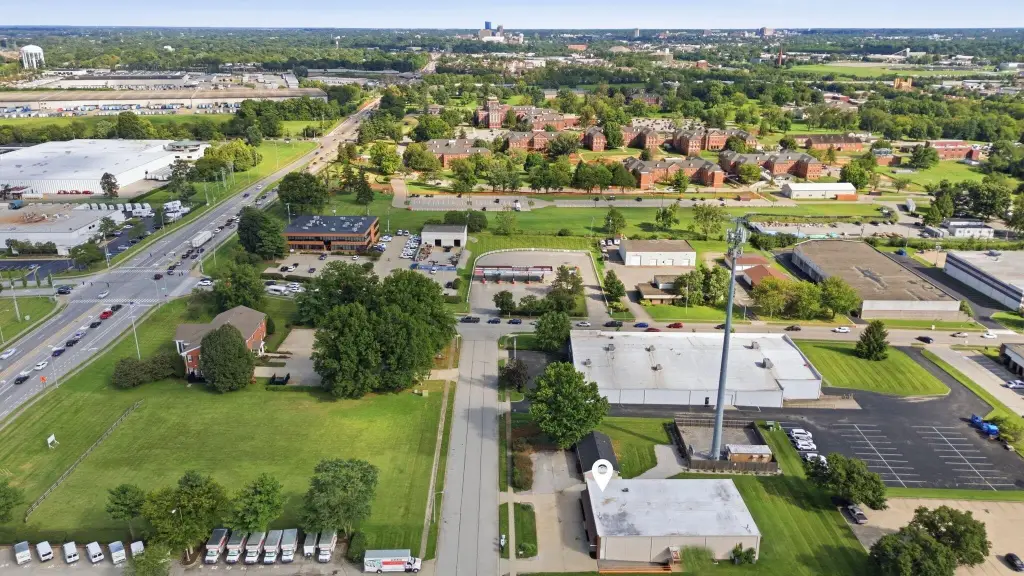
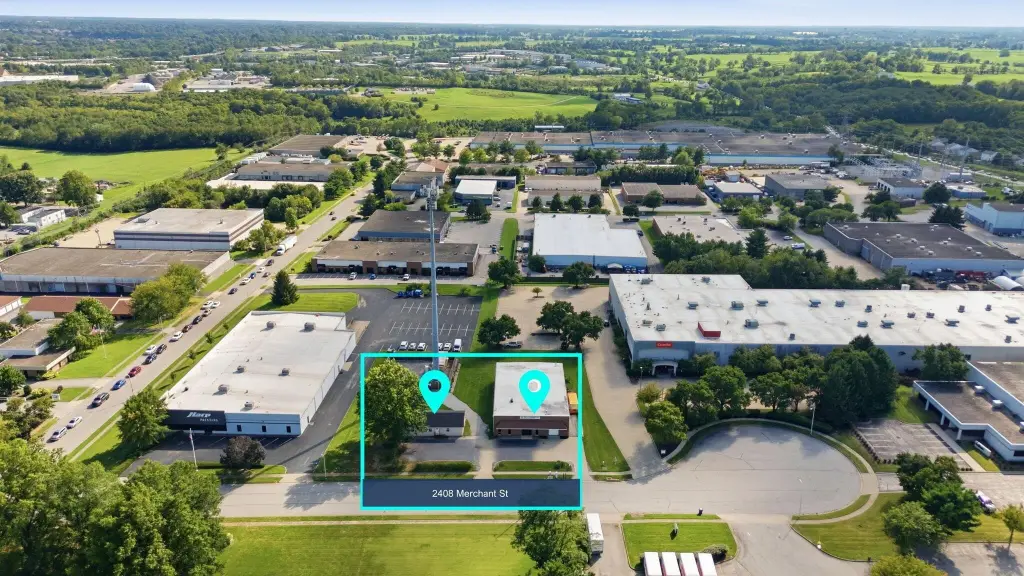
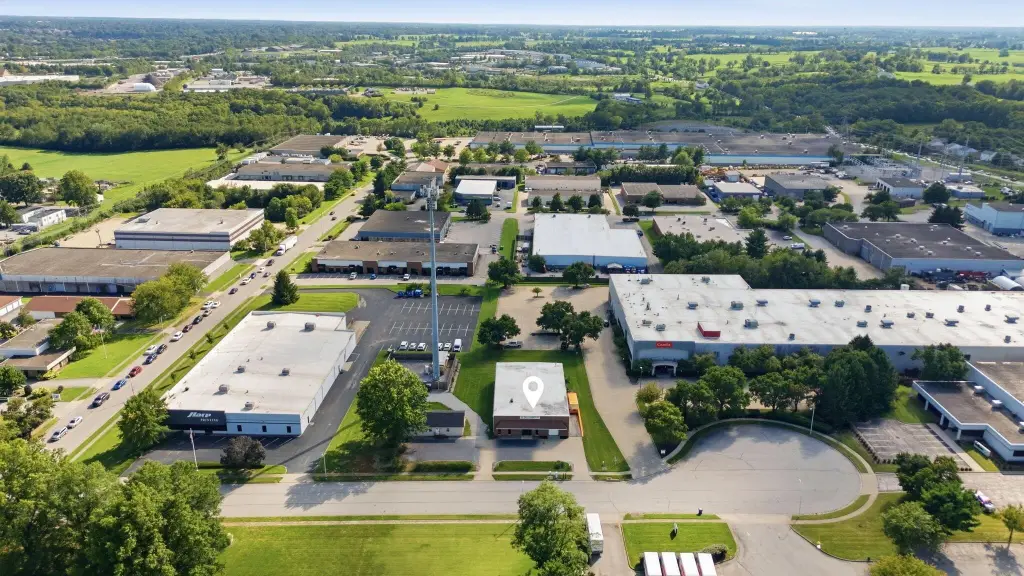
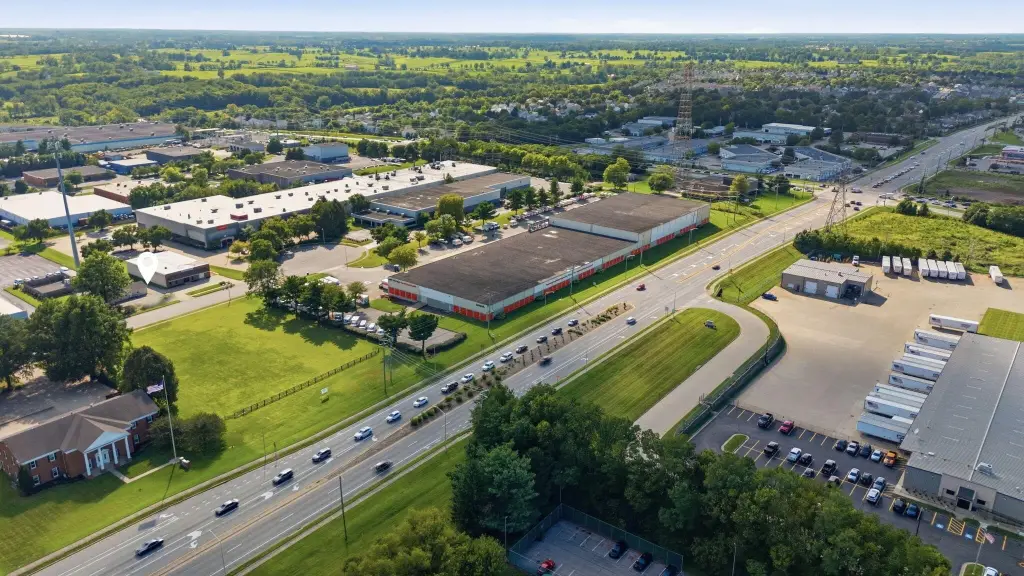
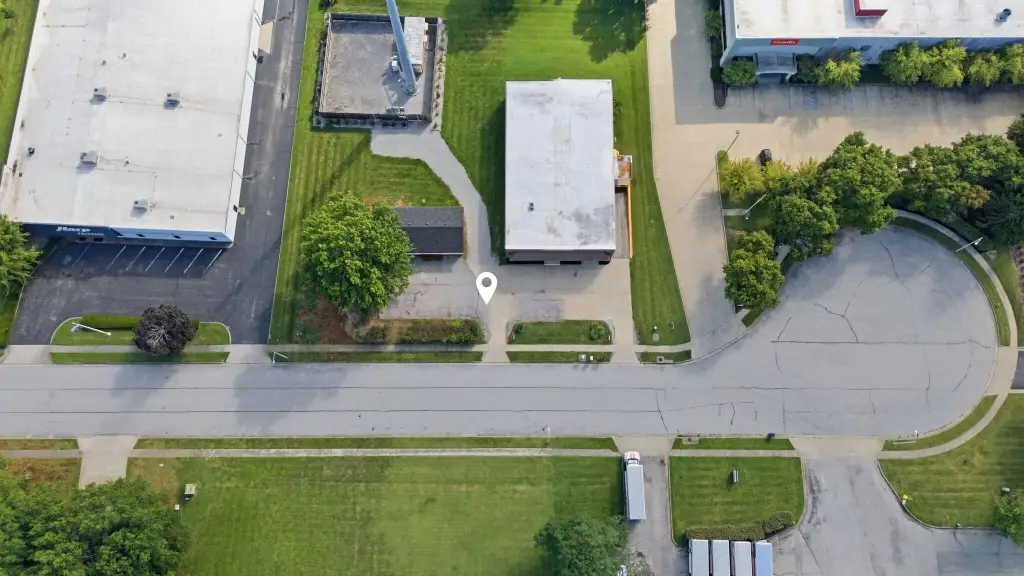
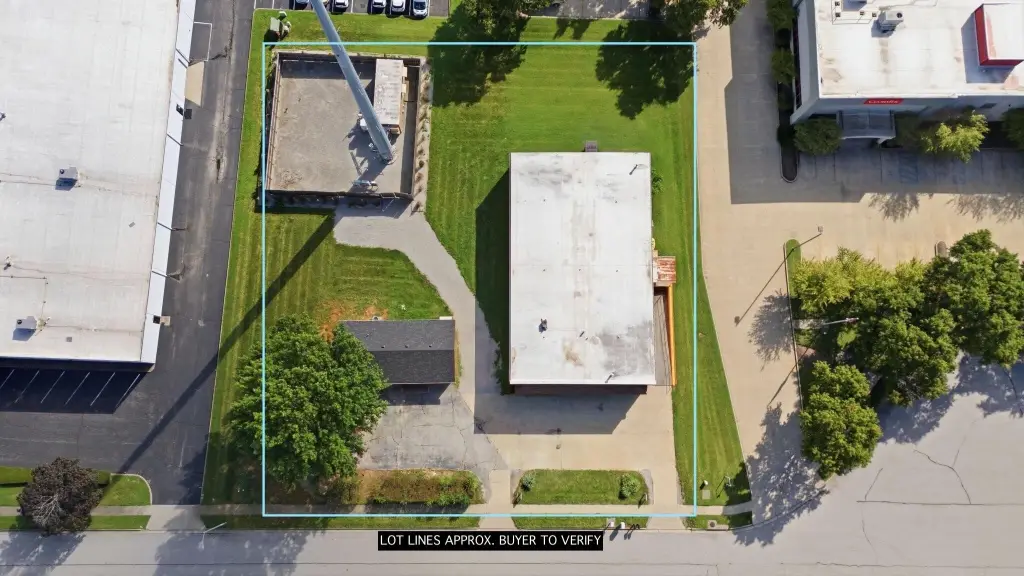
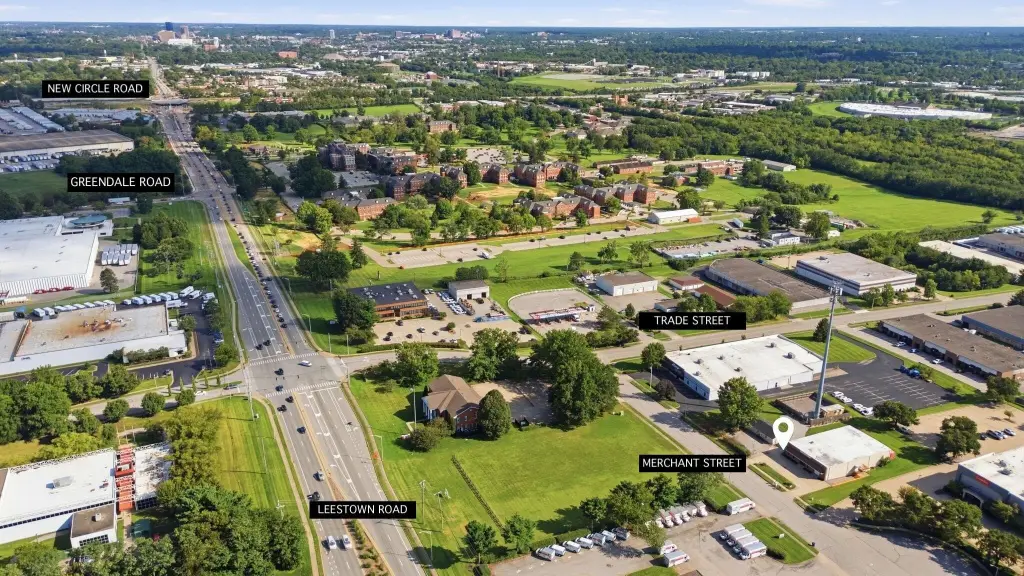
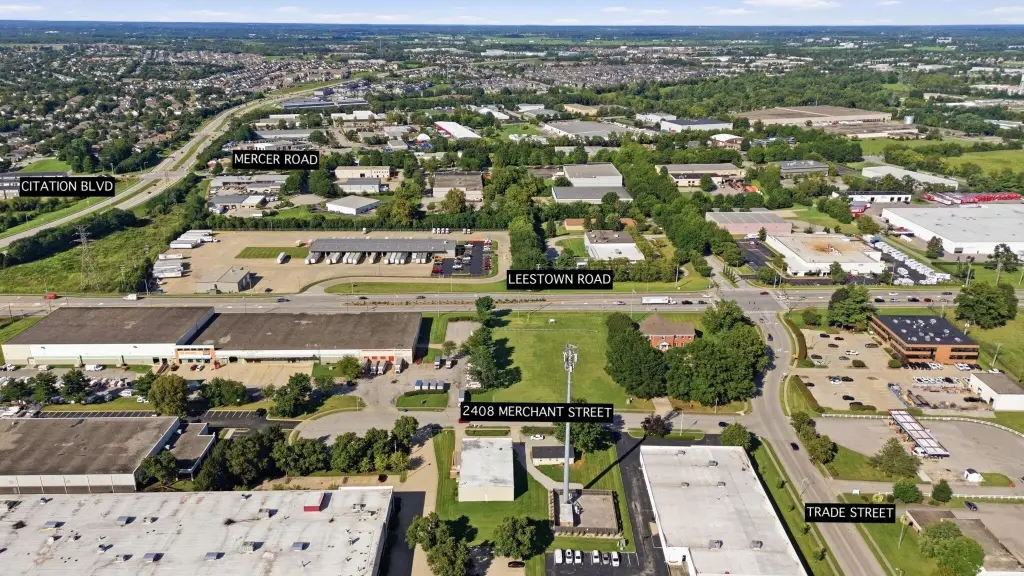
For Sale
$1,060,000
2408 Merchant Street, Lexington, KY 40510
Commercial Sale, Lexington, KY
Property Size7,152 SF
Lot Size1.00 Acre
Price / SF$148.21
Days on Market57
Property Features for 2408 Merchant Street
General Information
Property type
Commercial Sale
Property subtype
Other
Zoning description
I1- Light Industrial
Directions
From New circle, take Exit 7 onto Leestown Road, toward Frankfort, turn left on Trade, Right on Merchant
Subdivision
004 - Fayette County SW
Standard status
Active
APN
20008740
Size
7,152 SF
Lot size
1.00 Acre
Utilities
Sewer type
Public Sewer
Heating system
Natural Gas, Electric (Heating)
Cooling system
Ceiling Fan(s), Electric
Amenities
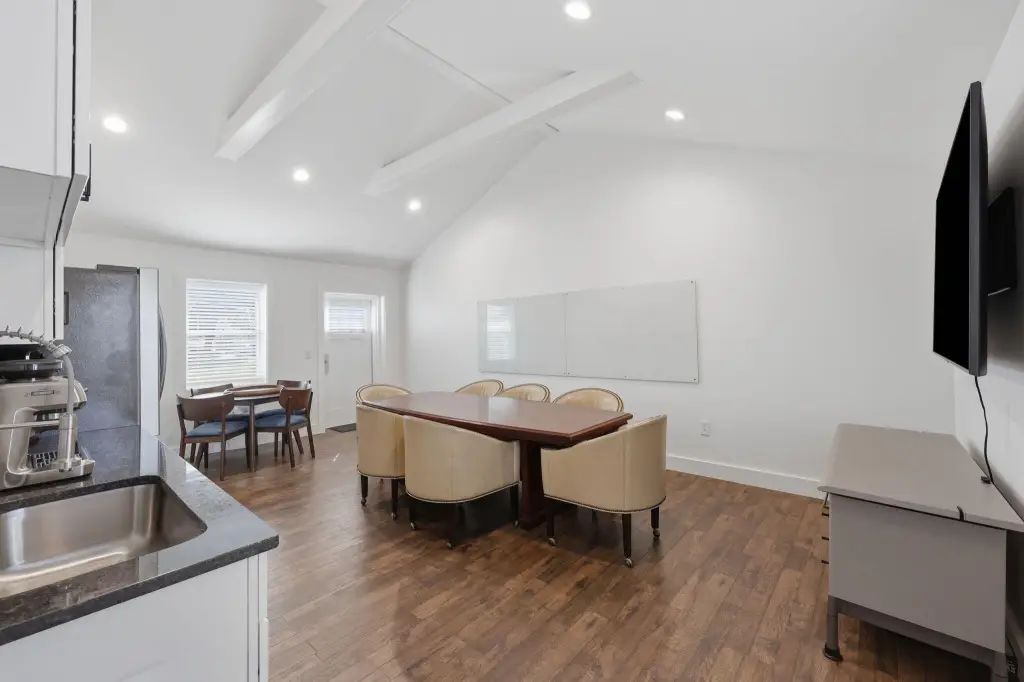
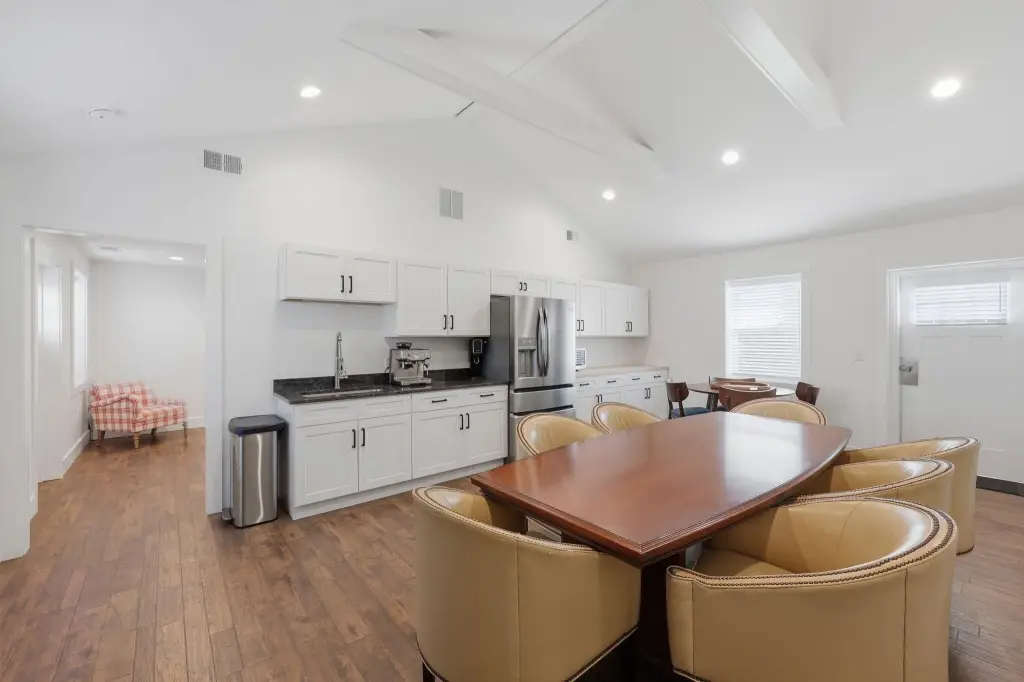
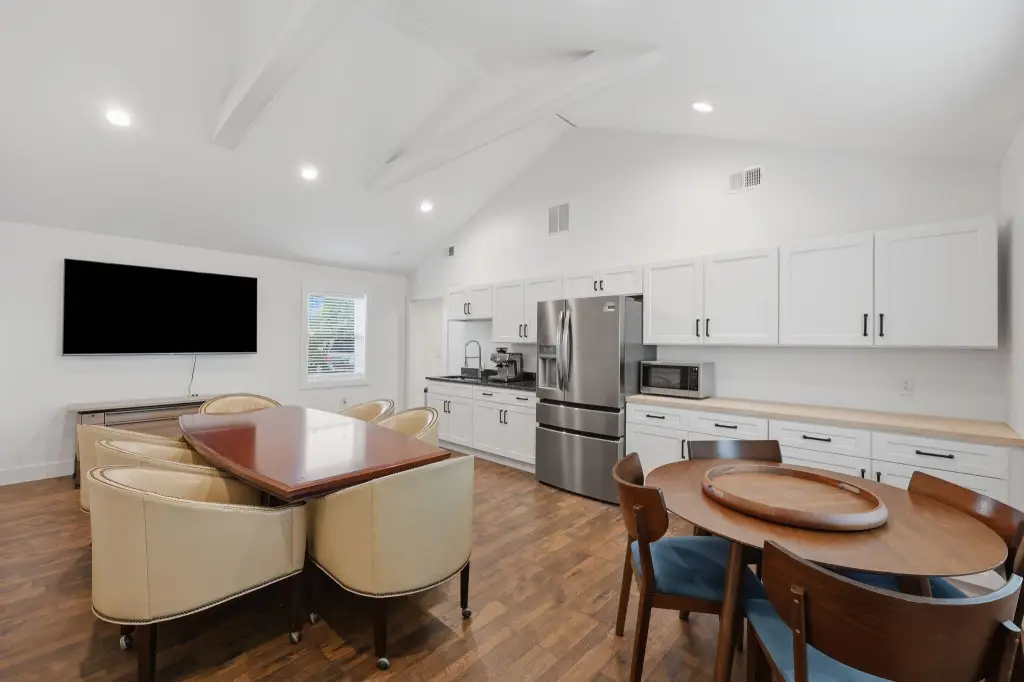
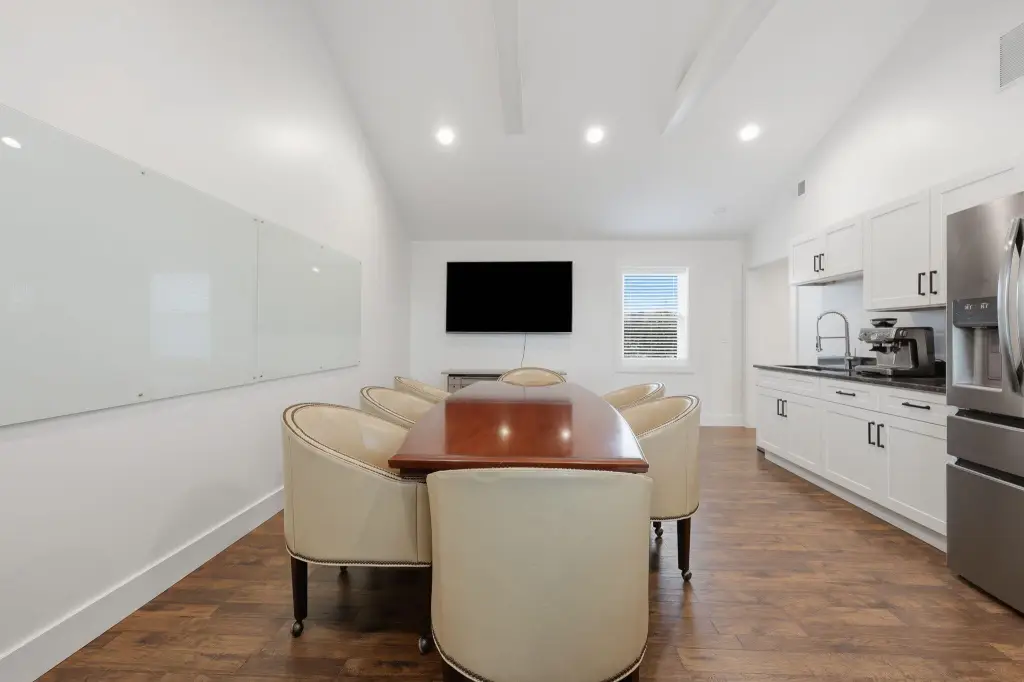
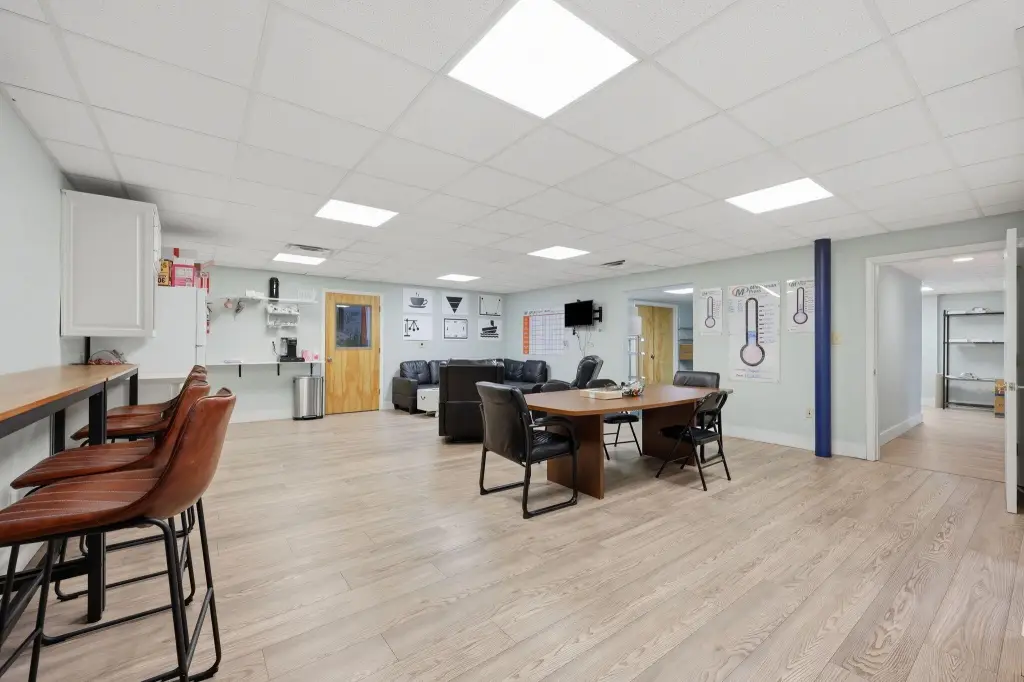
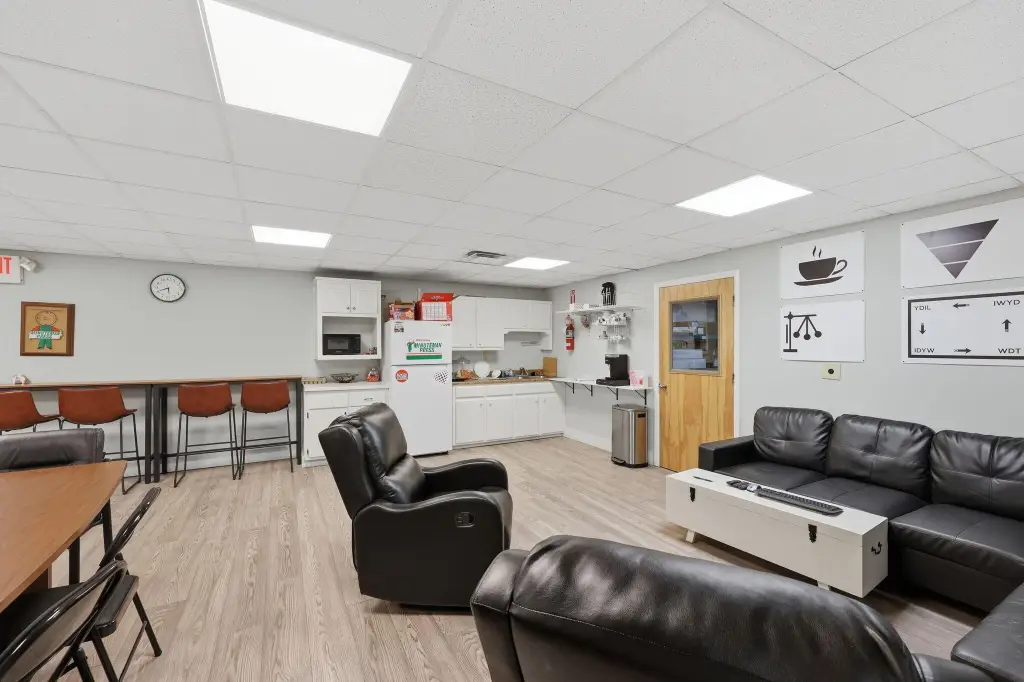
conference room
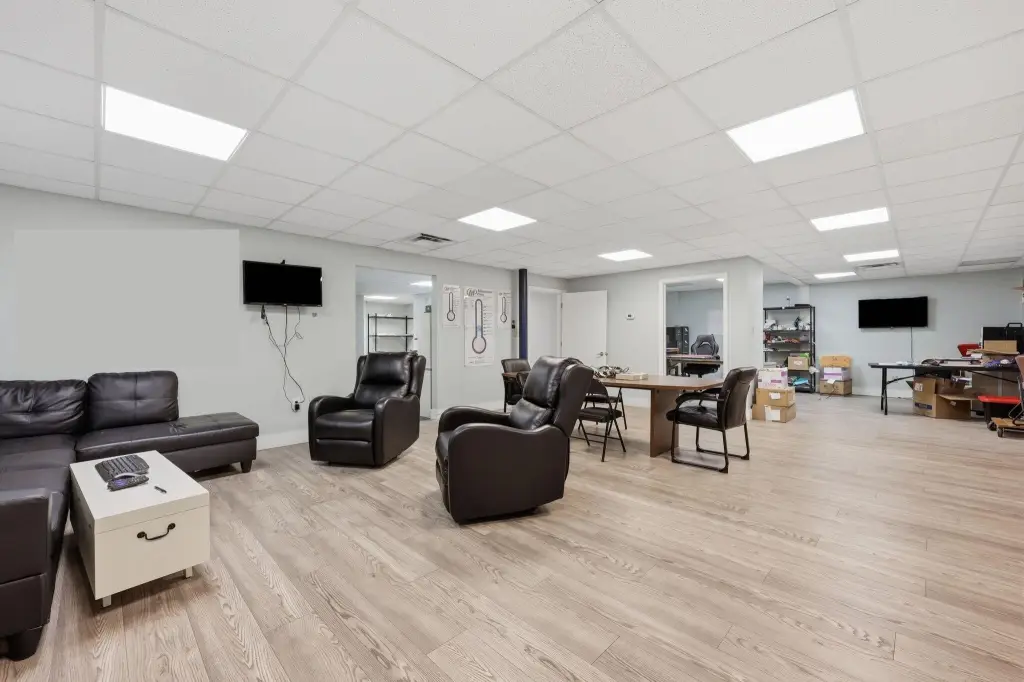
employee break area
kitchenette
Building Details
Year built
1989
Building materials
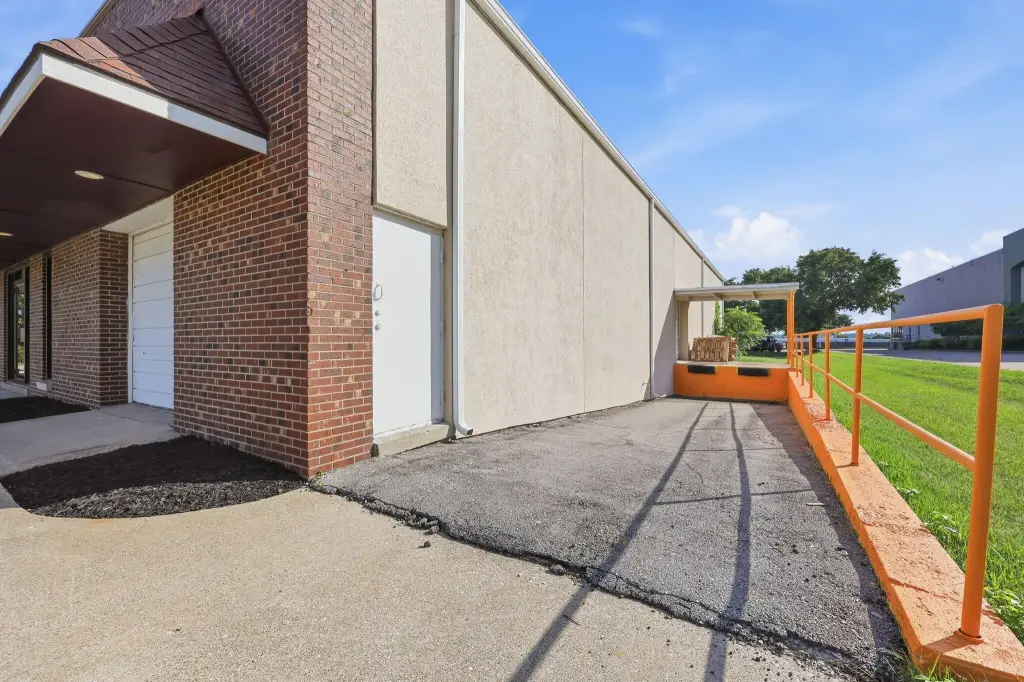
Block, Brick, Stucco
Roof type
Flat, Shingle
Listing Agency:
United Real Estate Bluegrass
(859) 800-7355
Listed By:
Lucy Martin Jenkins · License #244502
(859) 771-4088
Added: Aug 18
Changed: Oct 2
Last Checked: Oct 13 at 6:06AM
MLS# 26023392
Copyright © 2026 ImagineMLS. All rights reserved. All information provided by the listing agent/broker is deemed reliable but is not guaranteed and should be independently verified.
Investment Insights
Based on property information with market context.
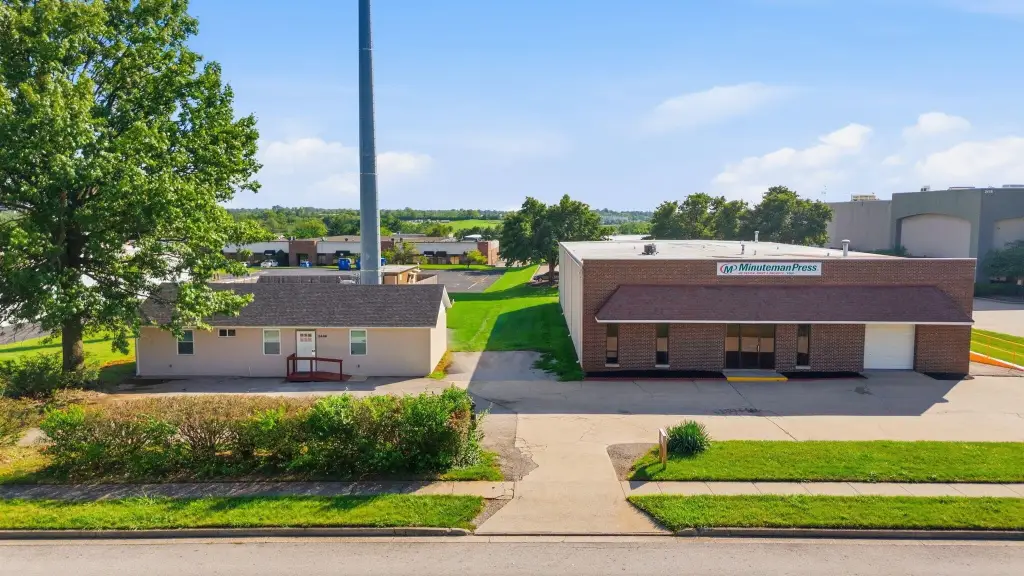
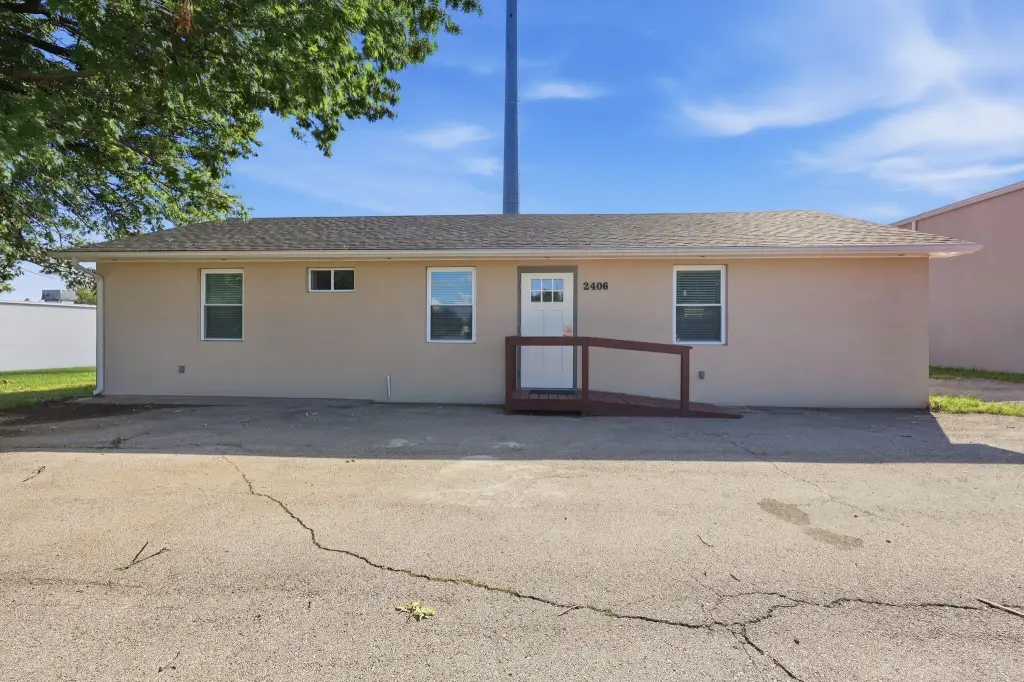
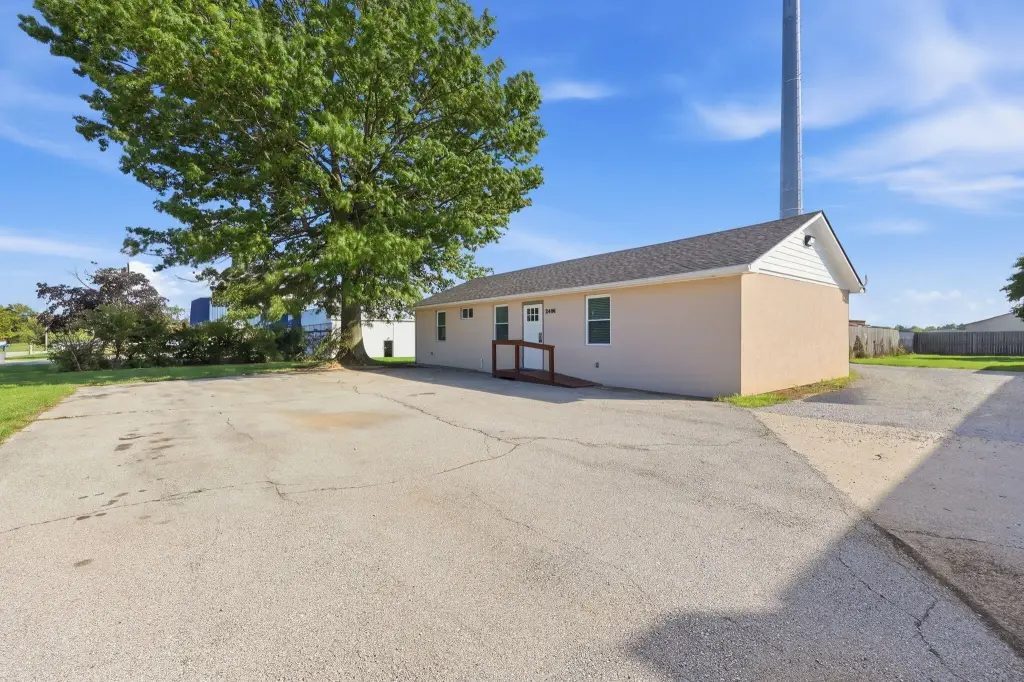
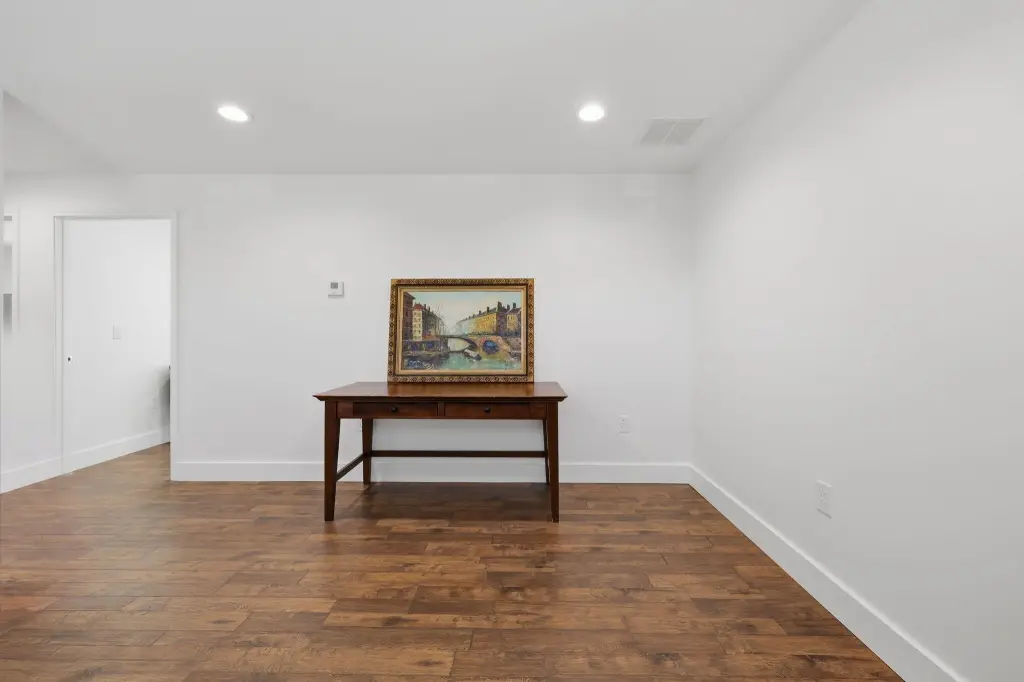
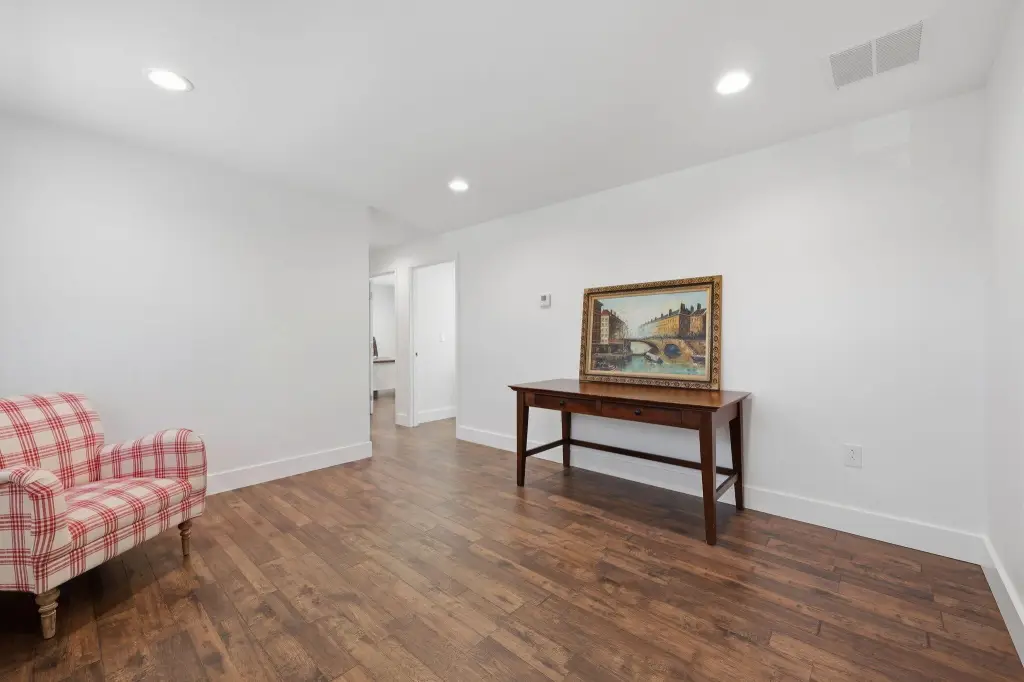
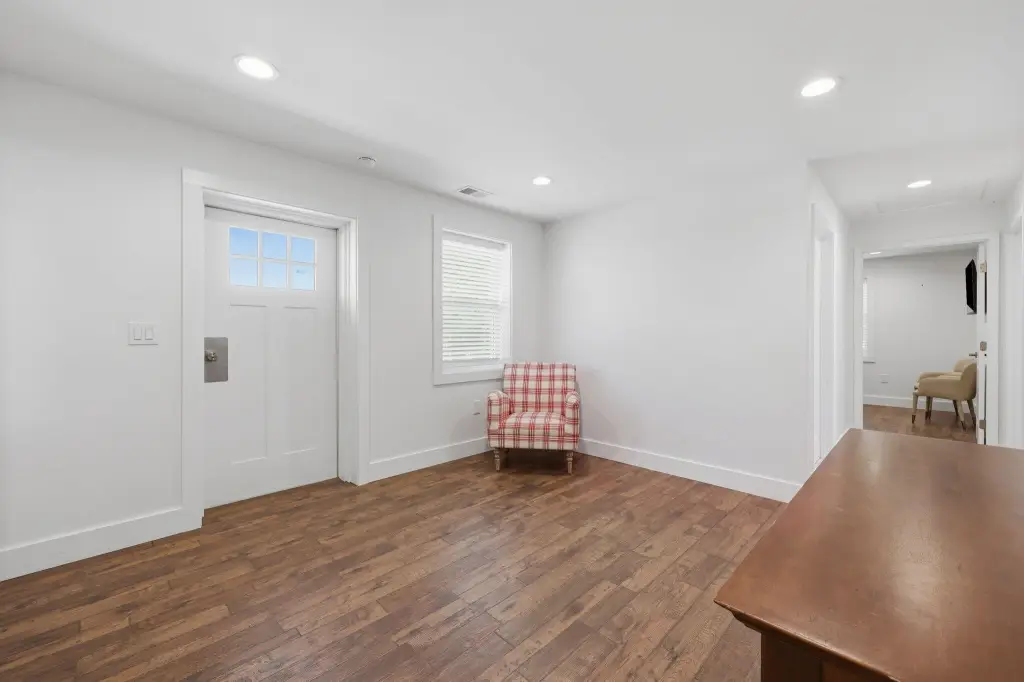
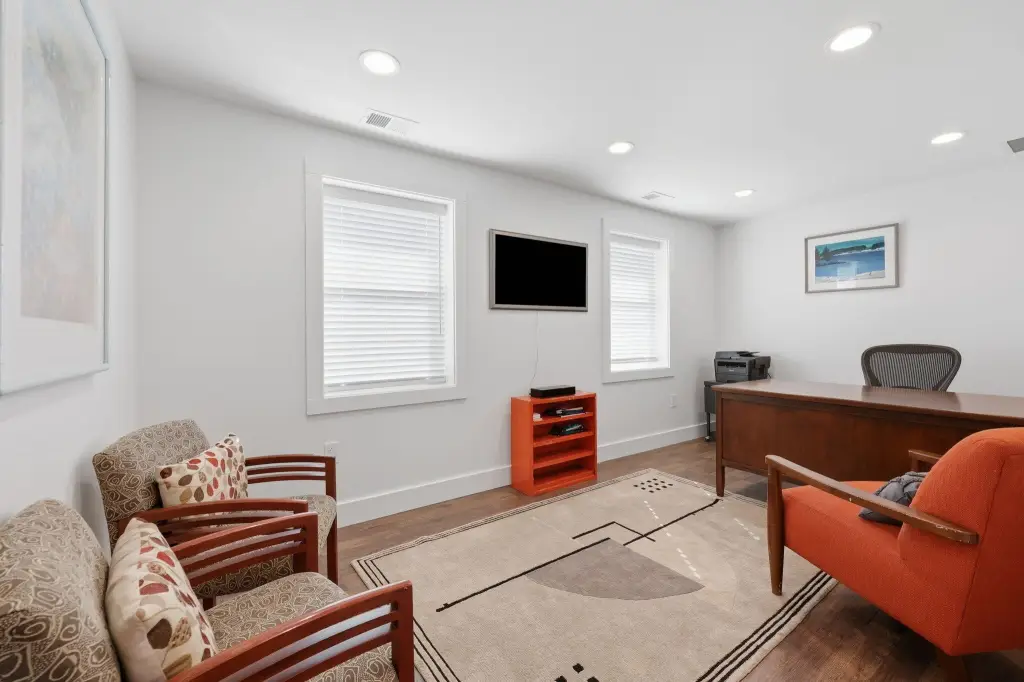
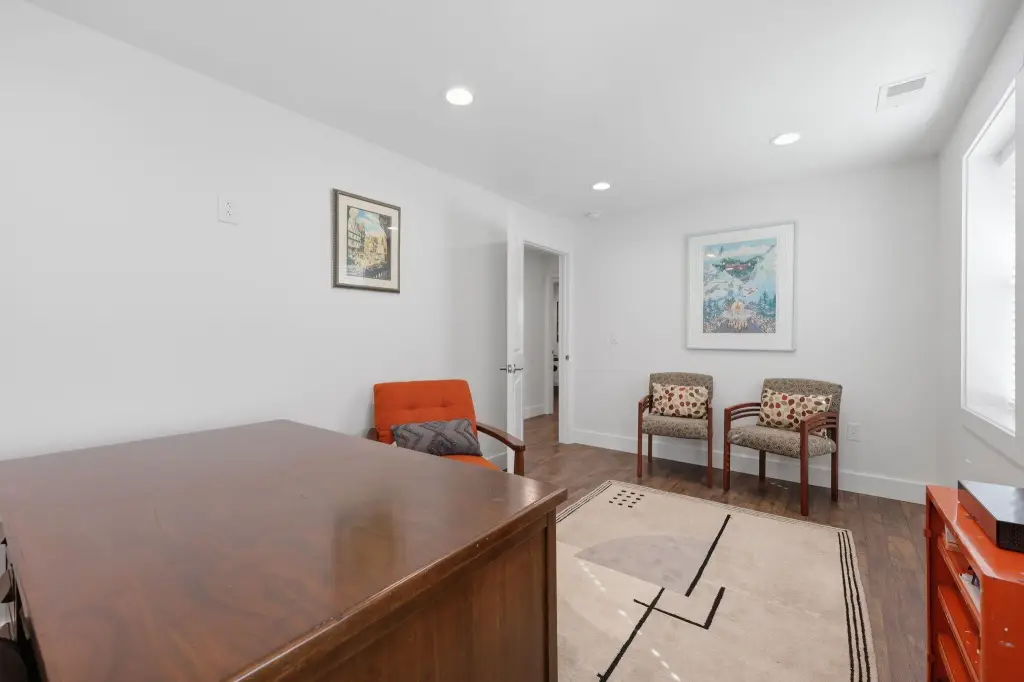
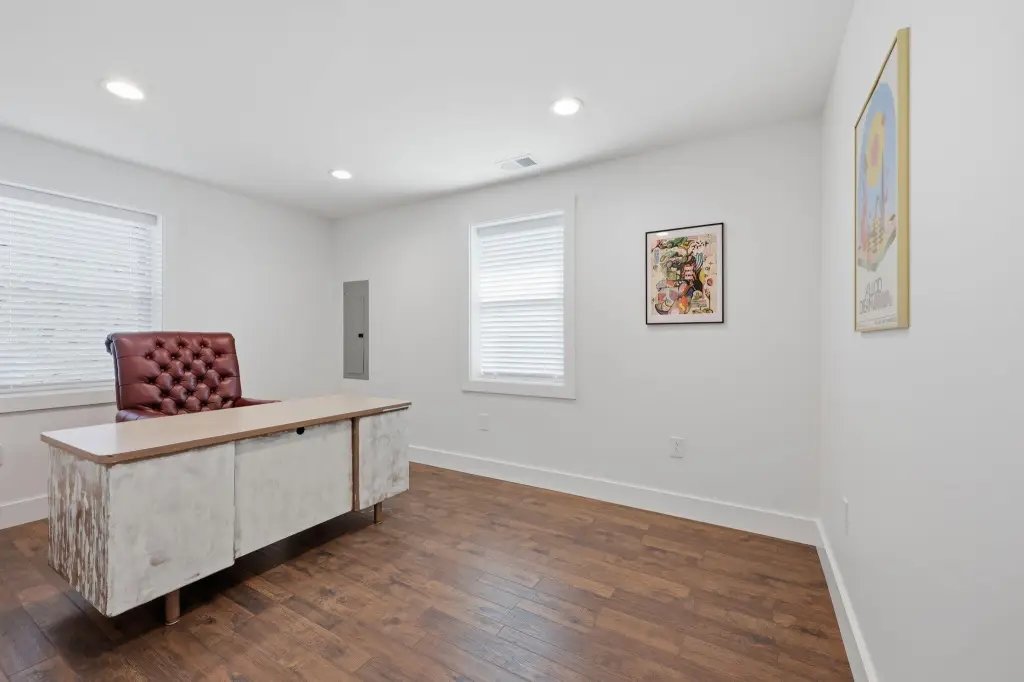
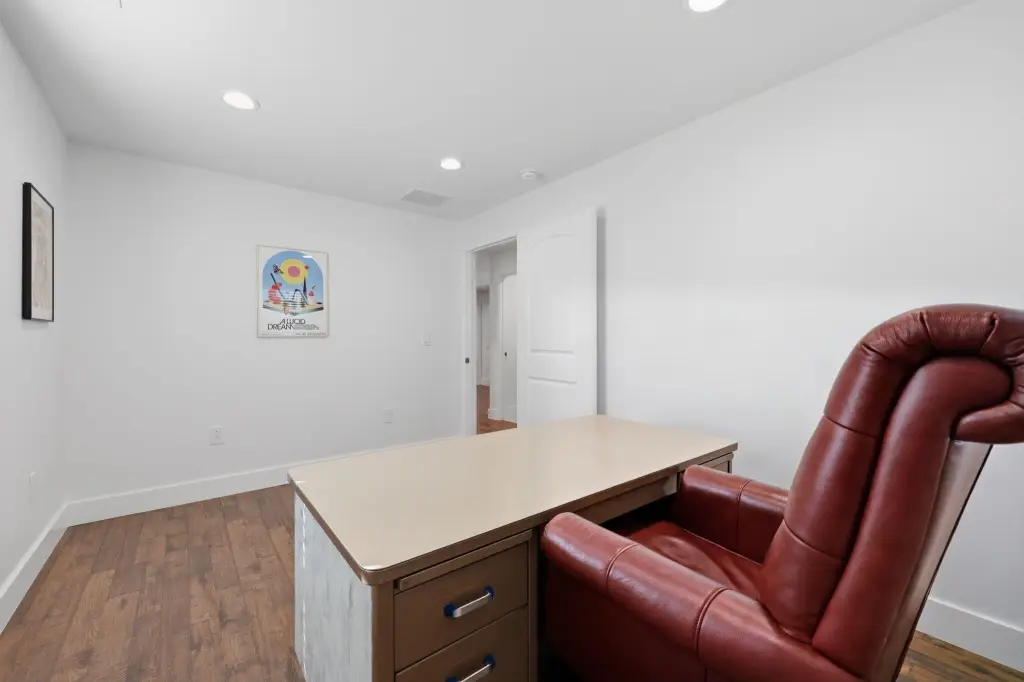
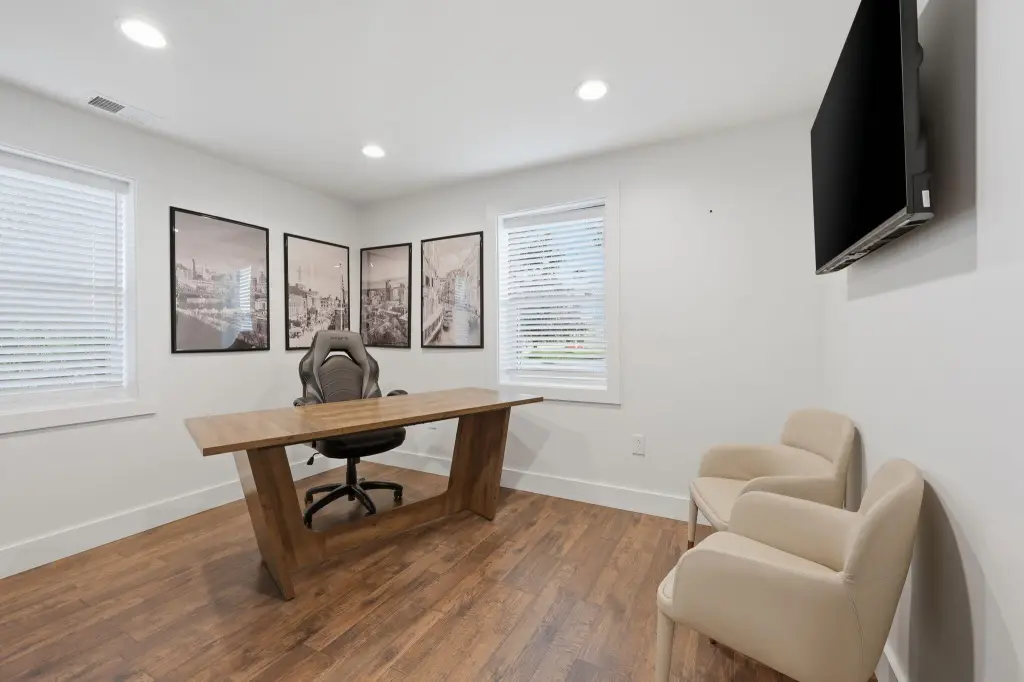
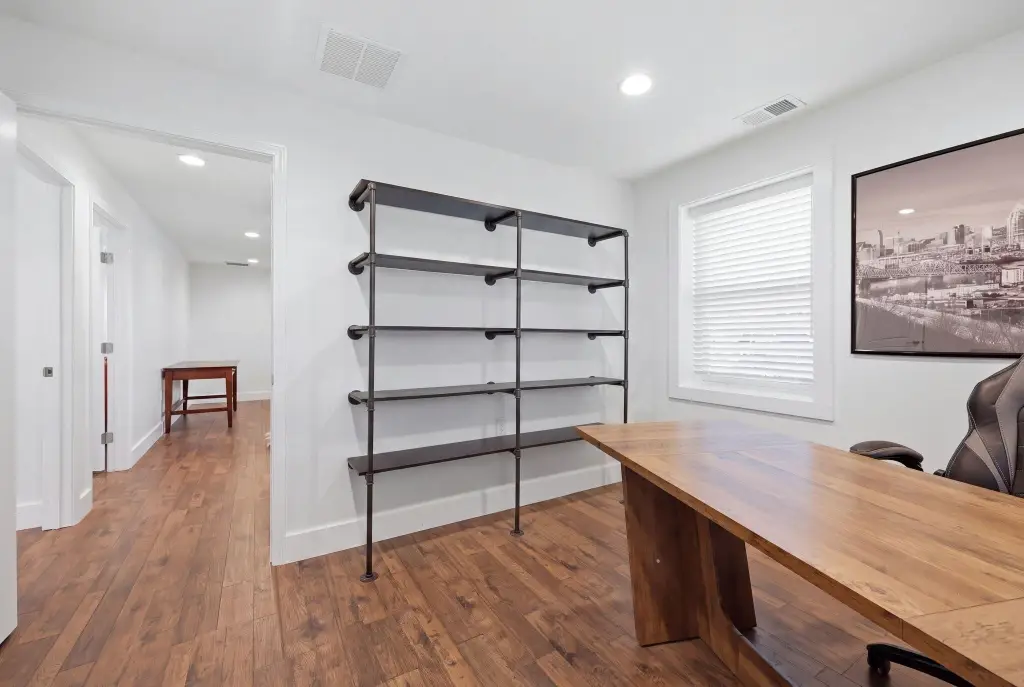
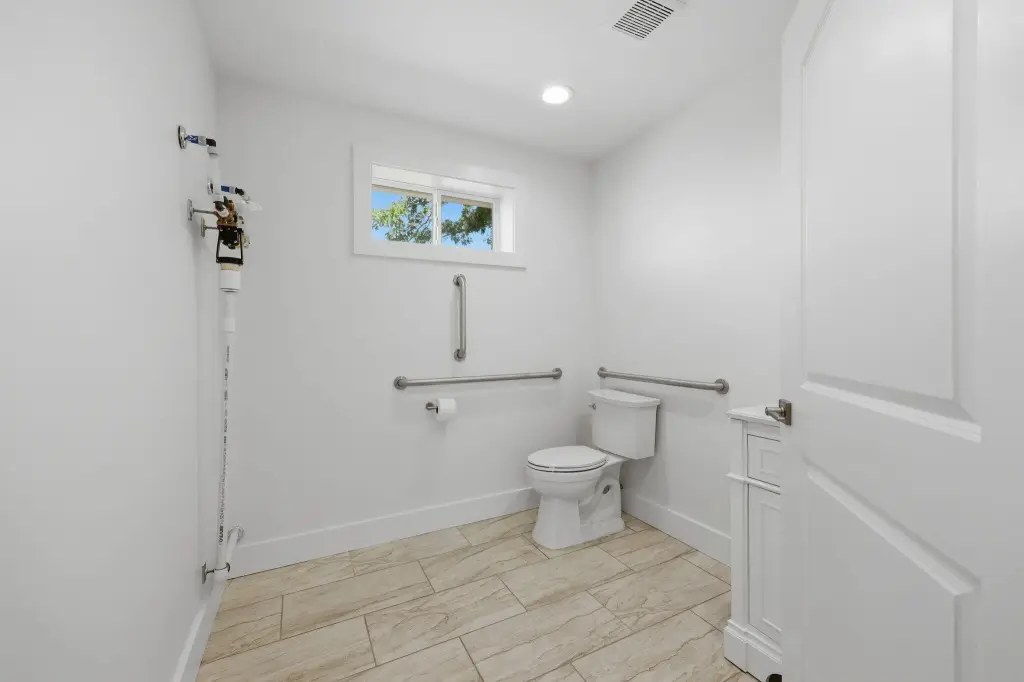
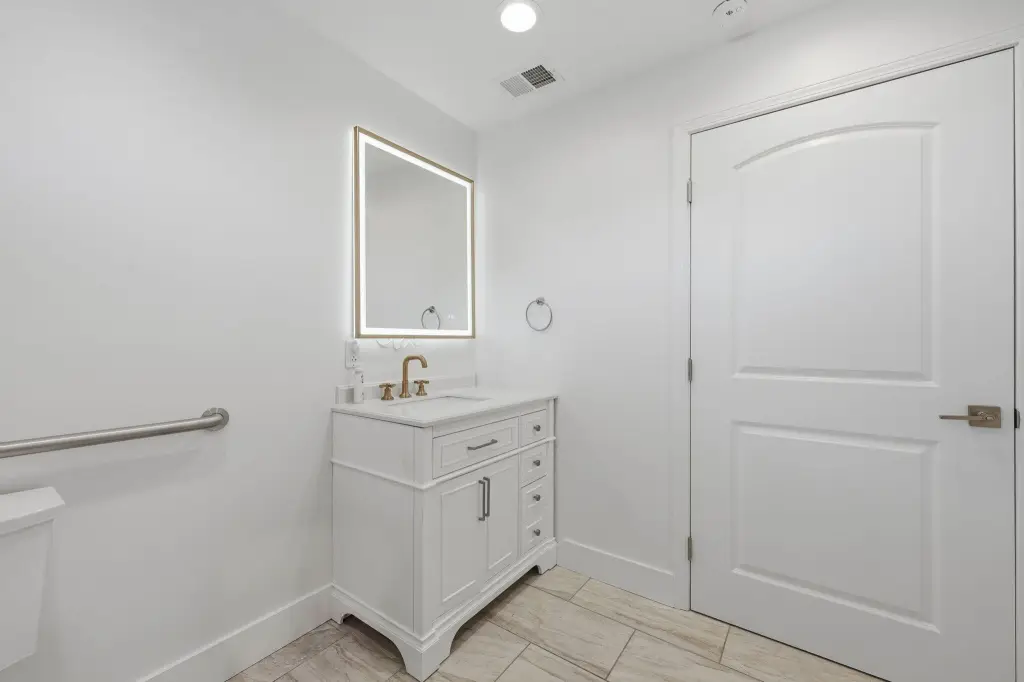
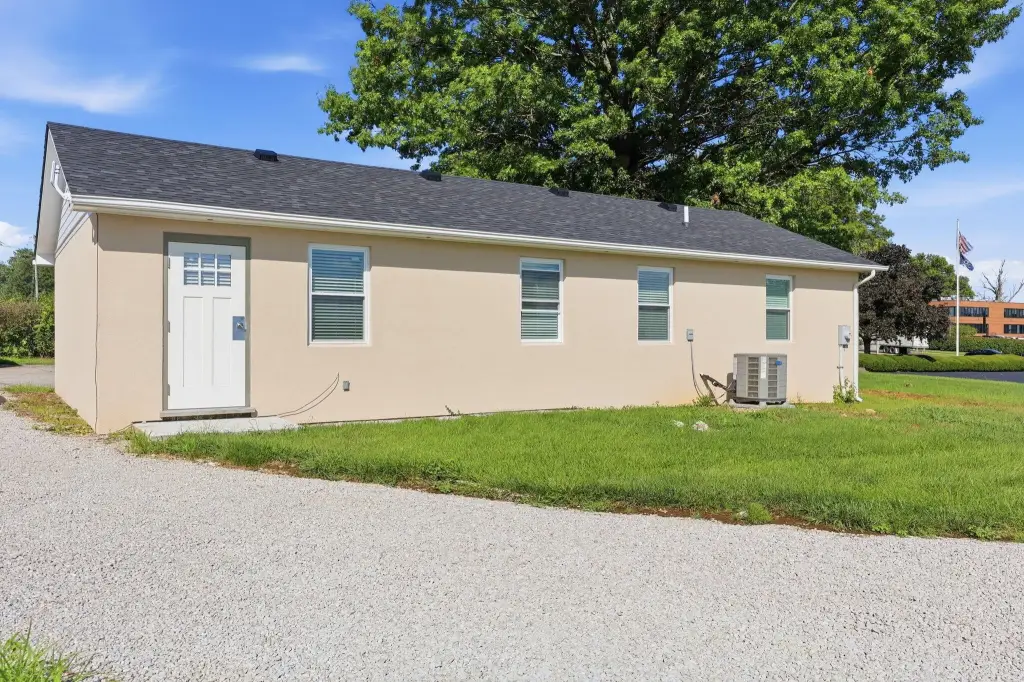
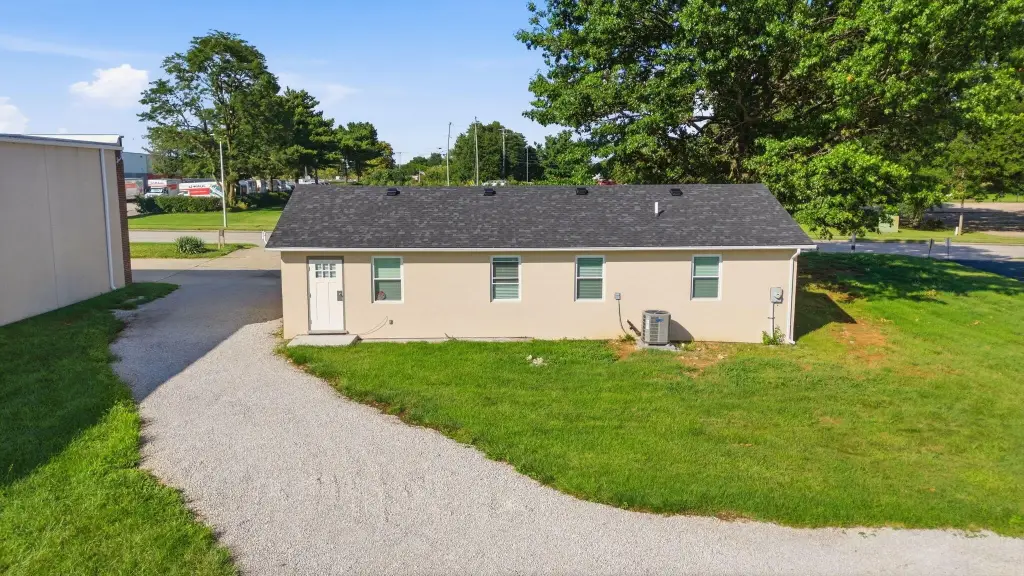
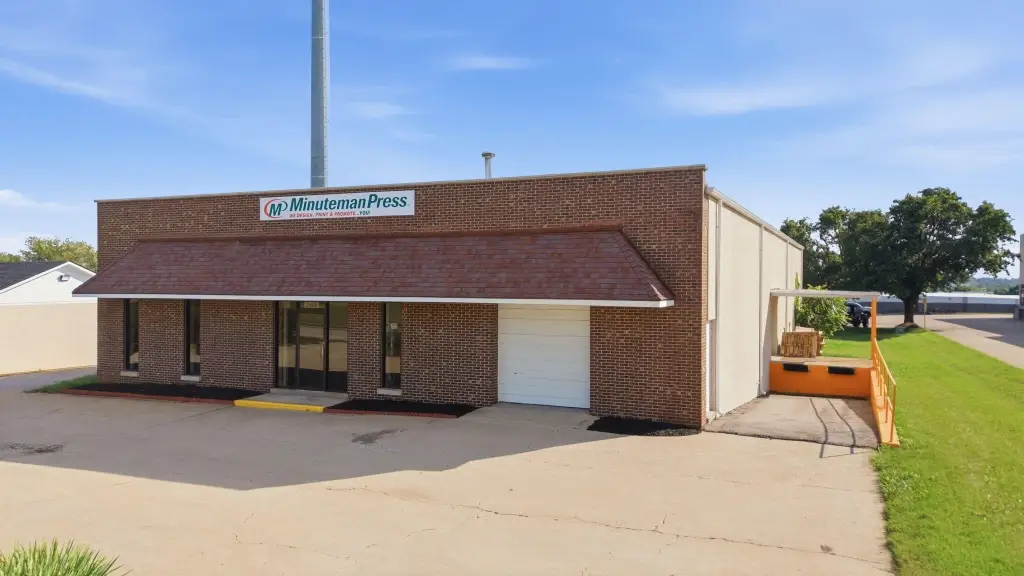
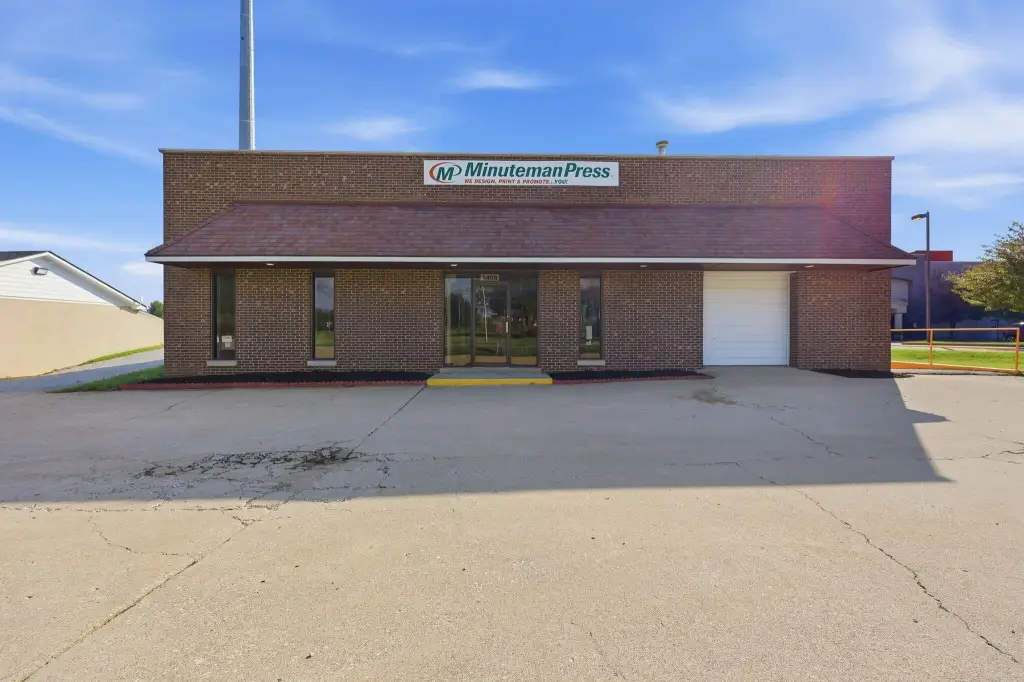
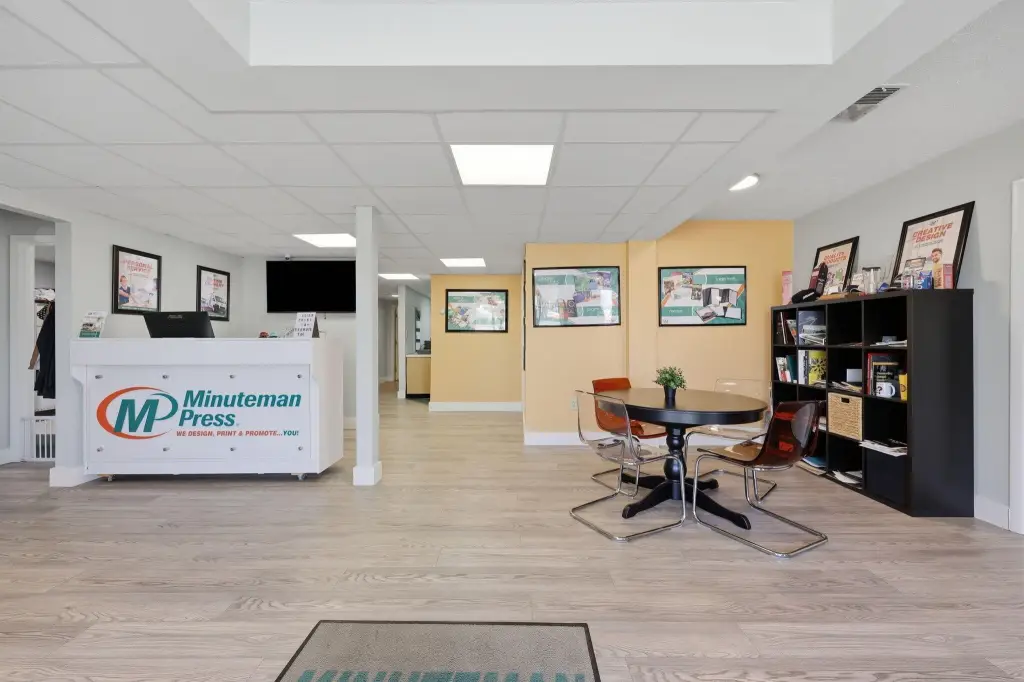
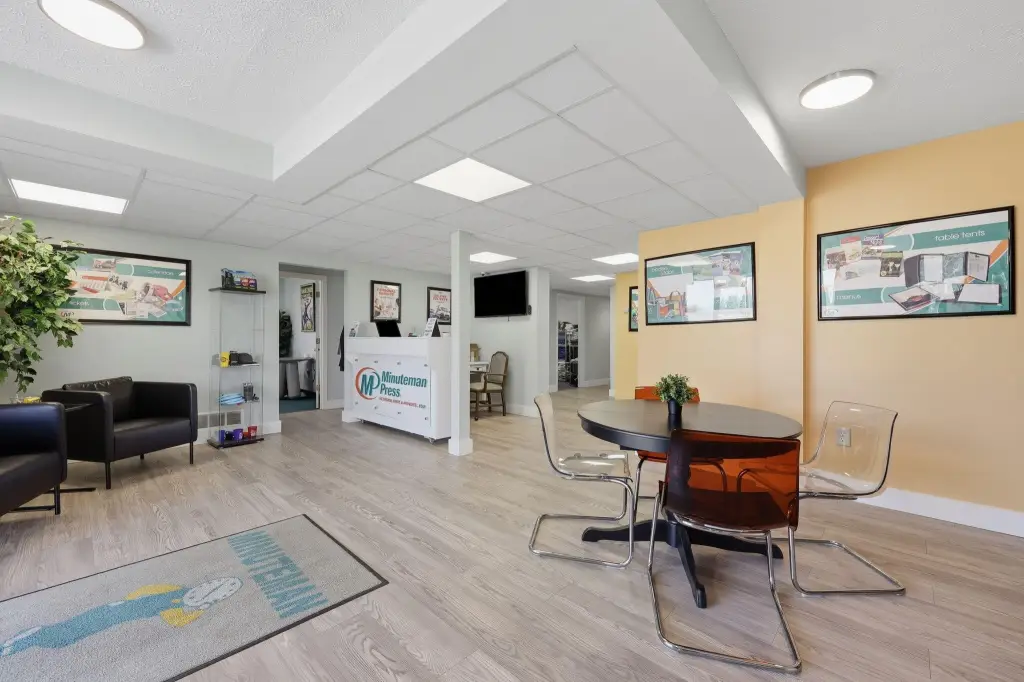
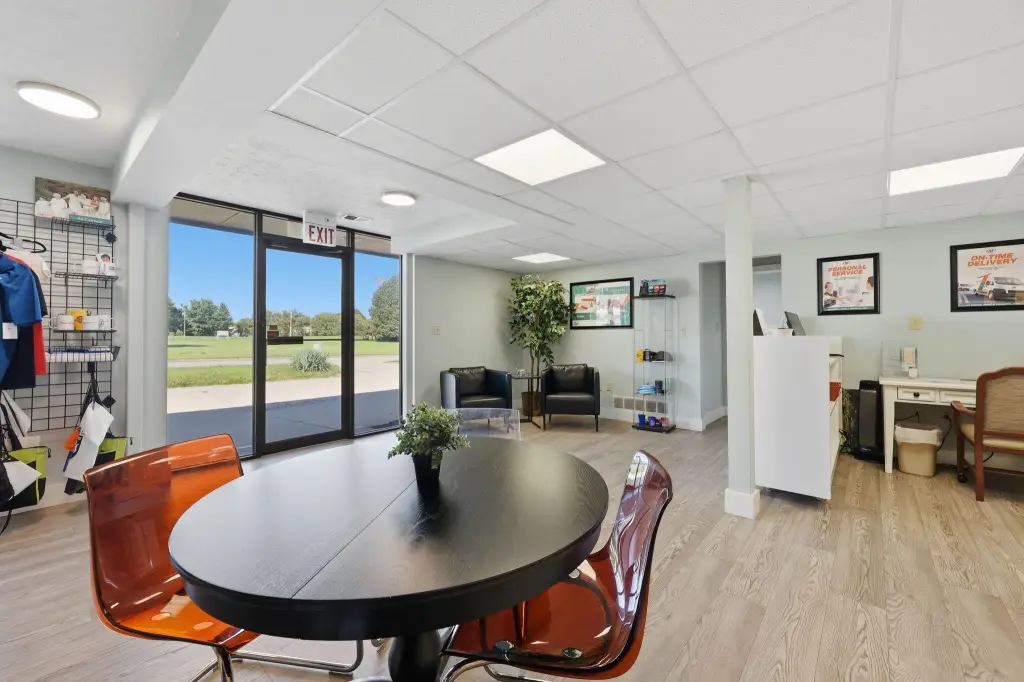
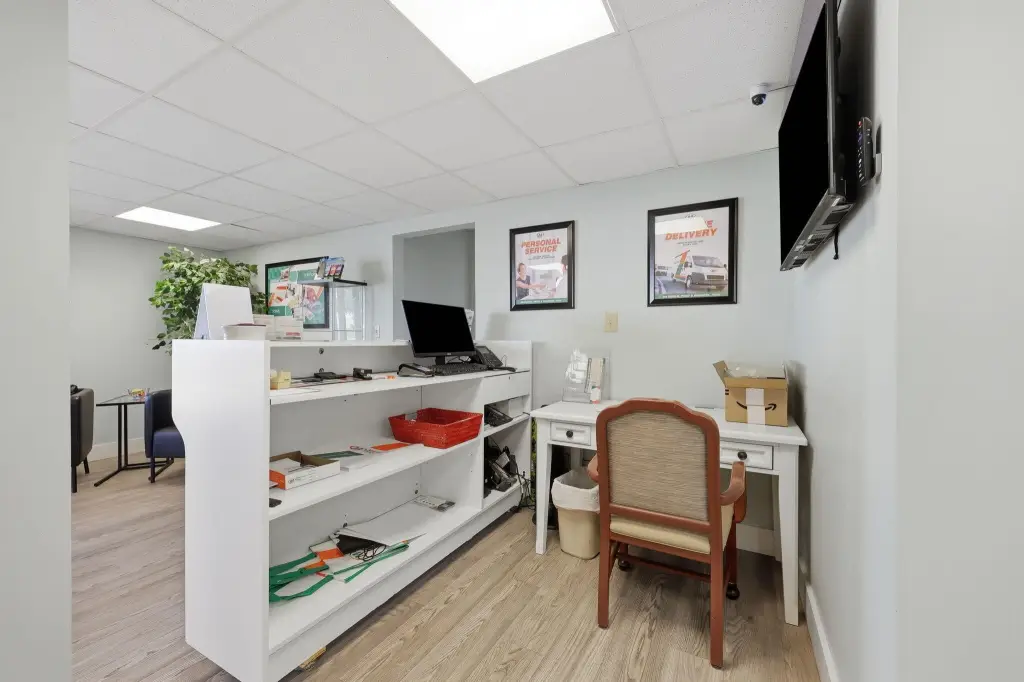
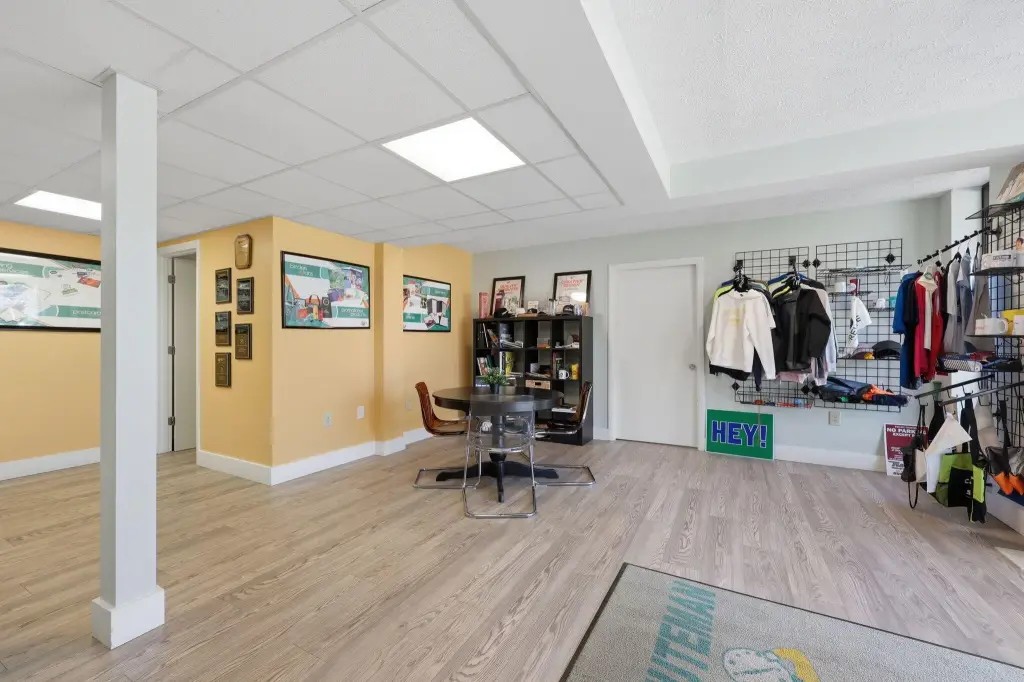
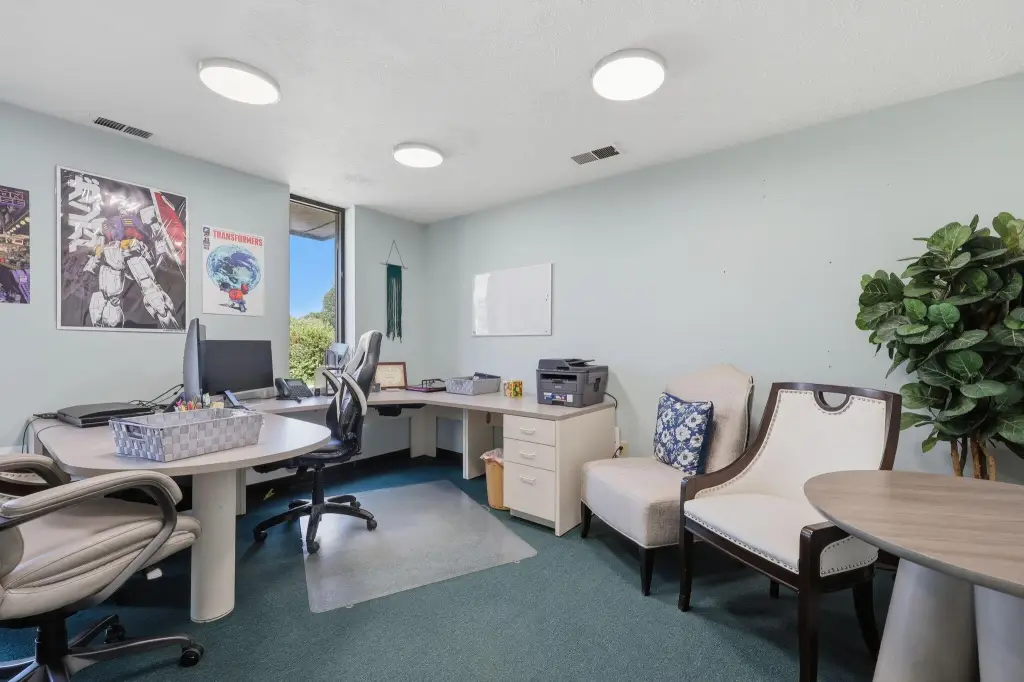
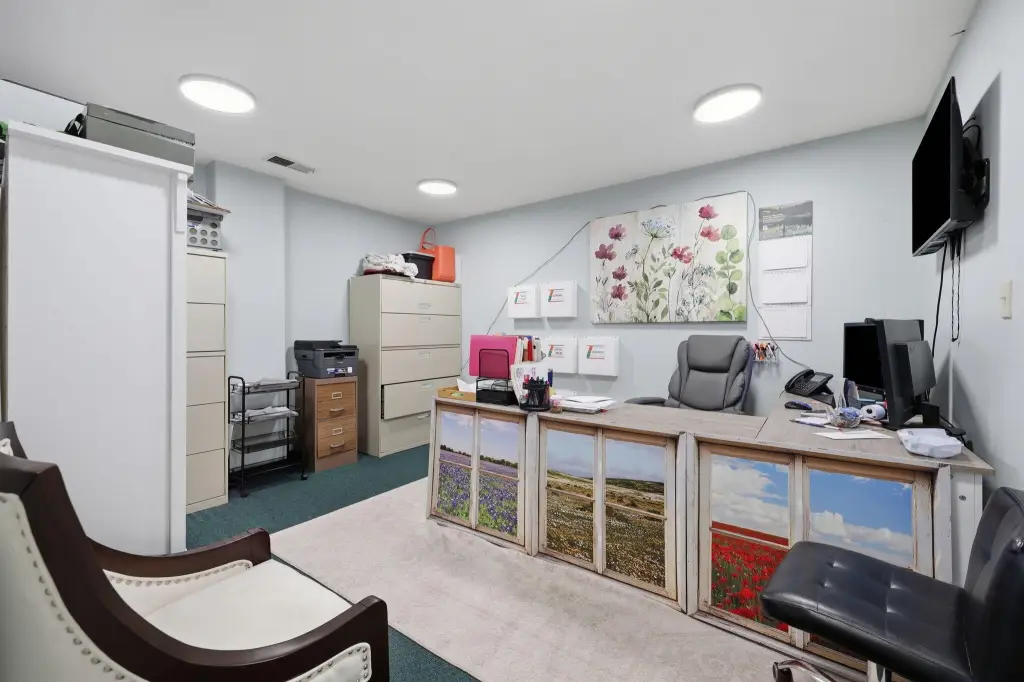
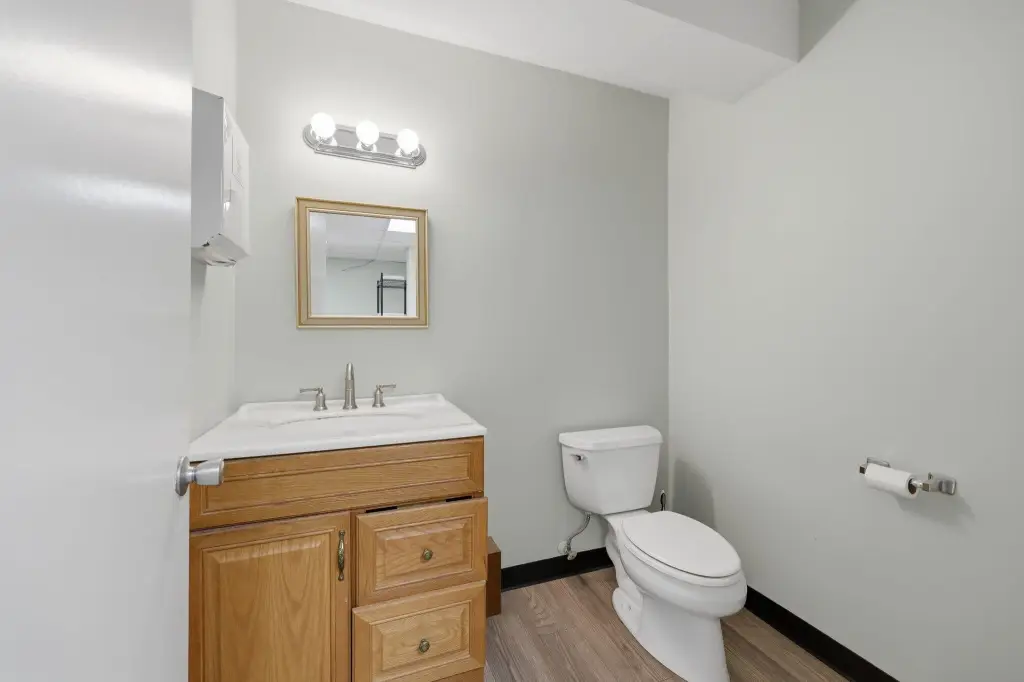
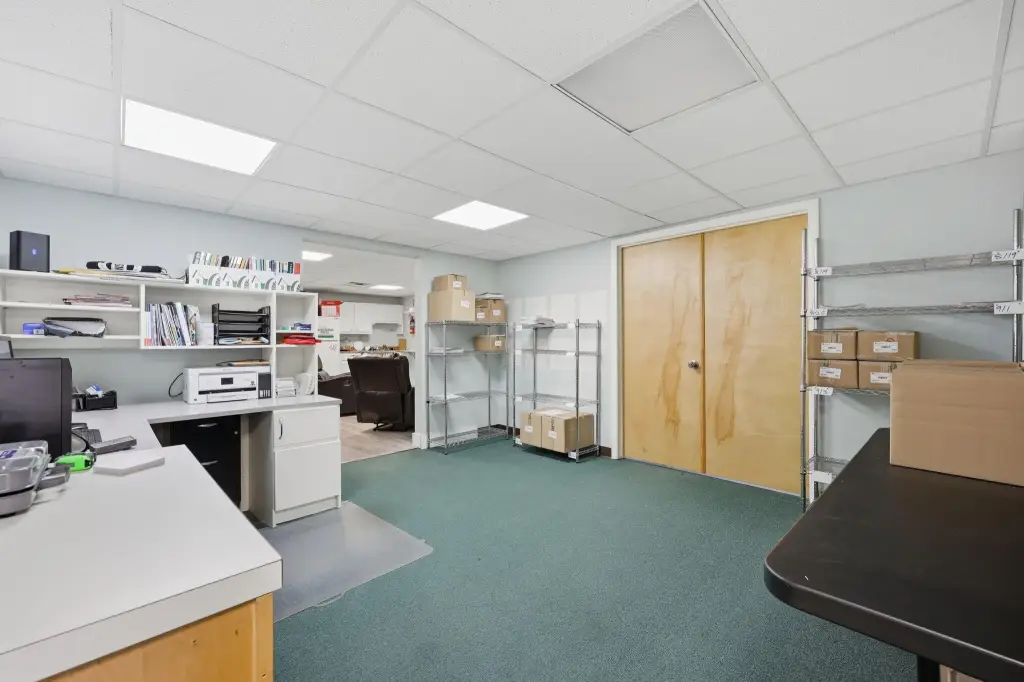
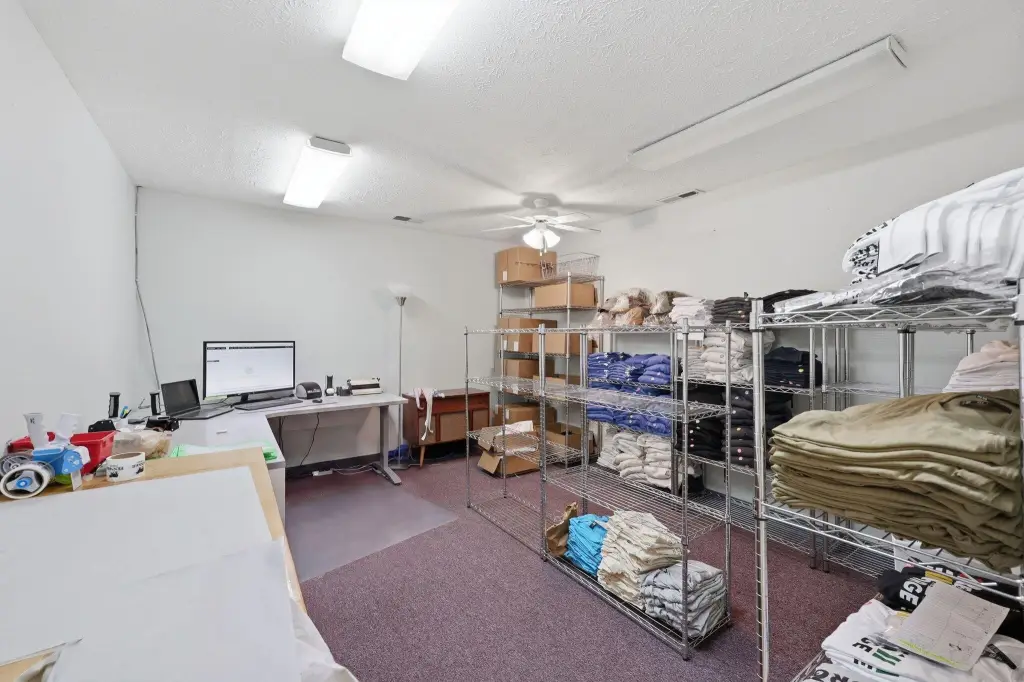
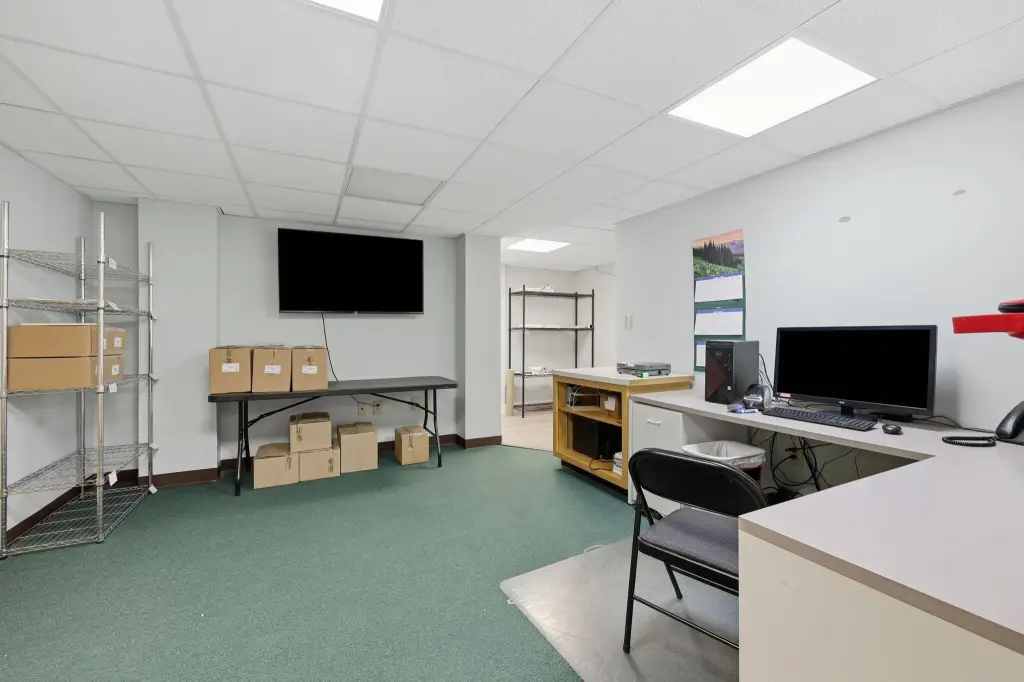
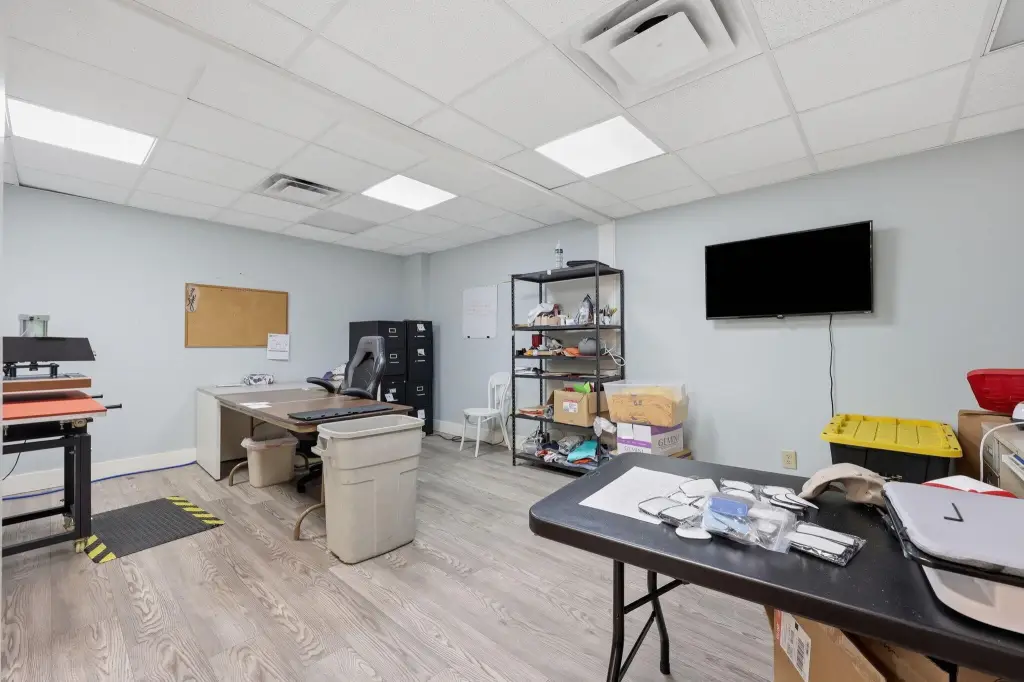
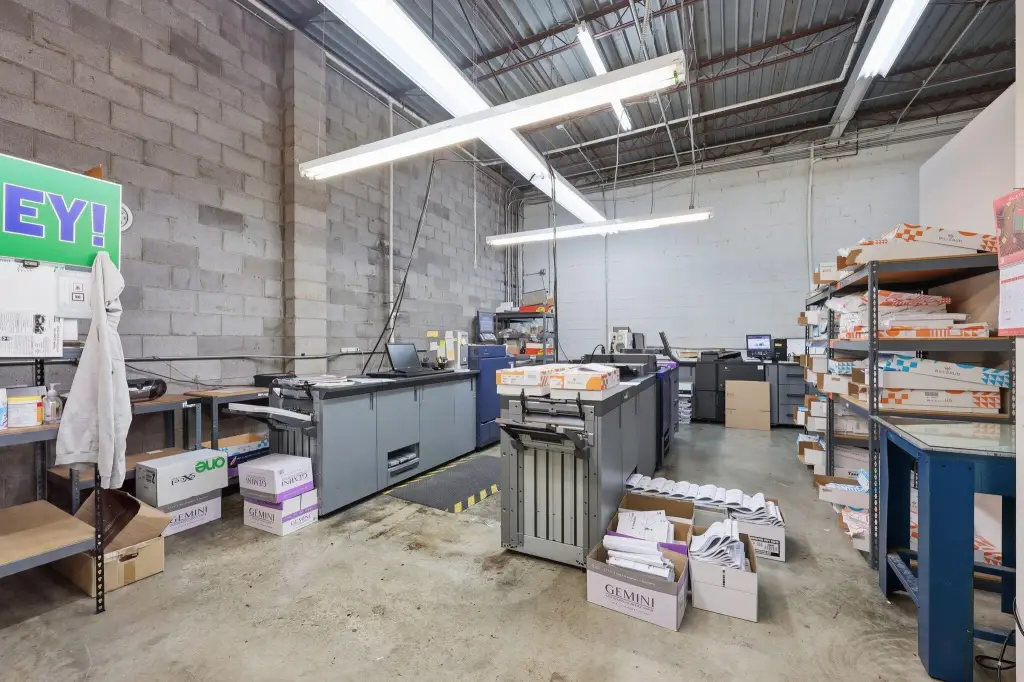
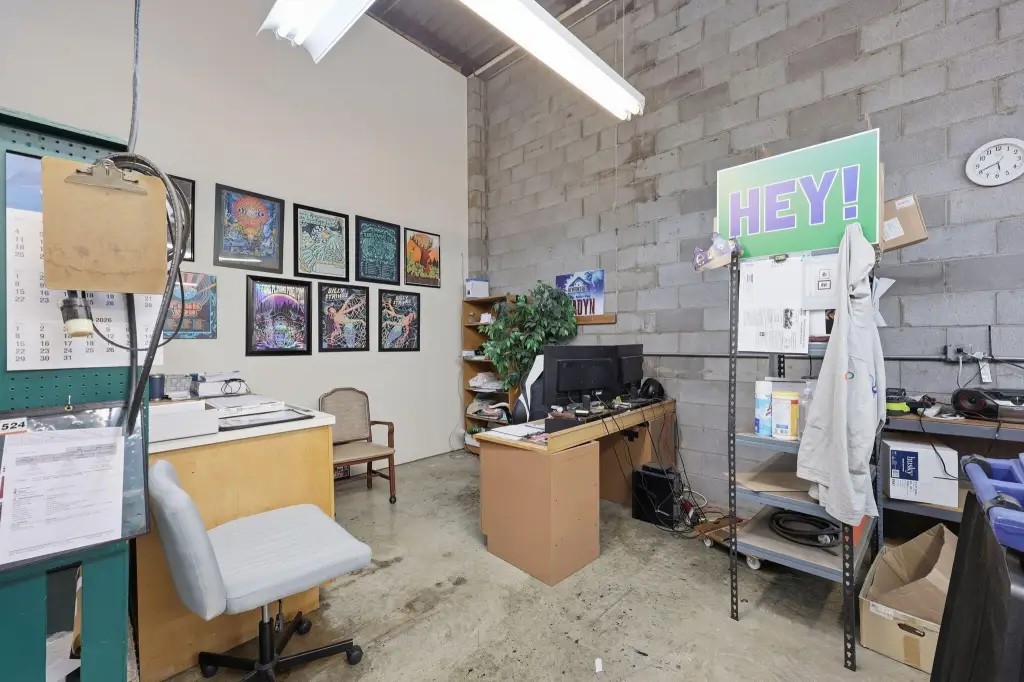
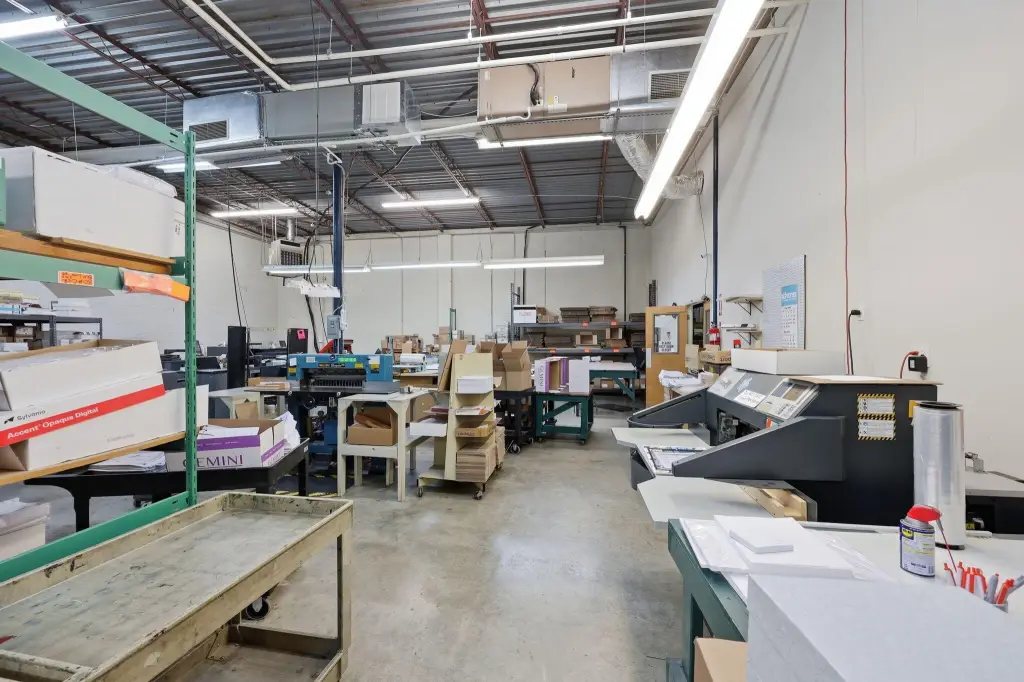
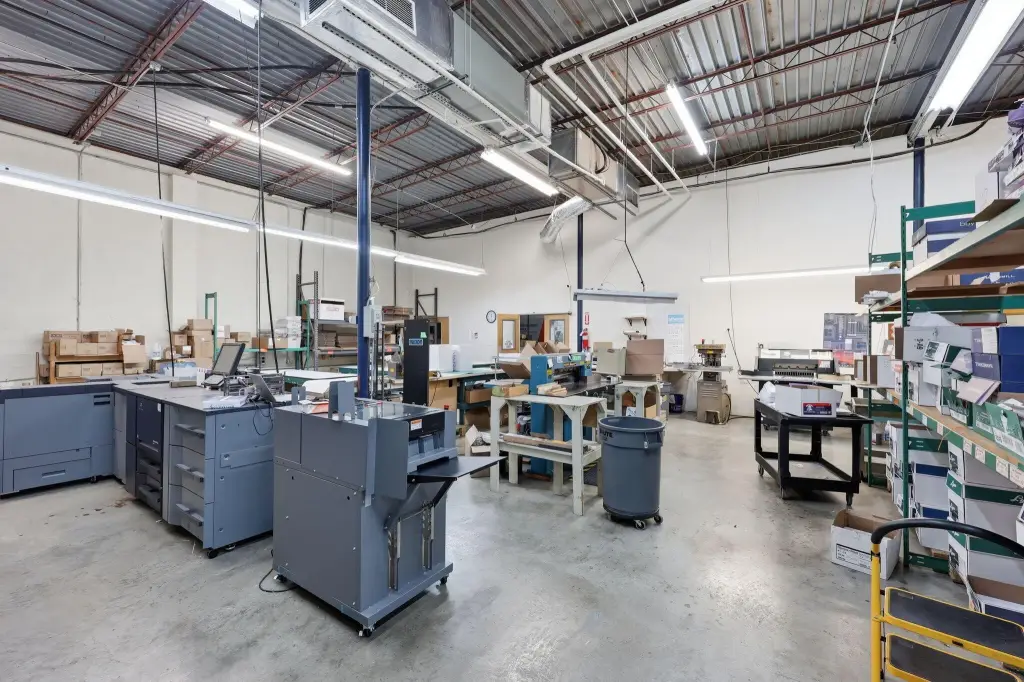
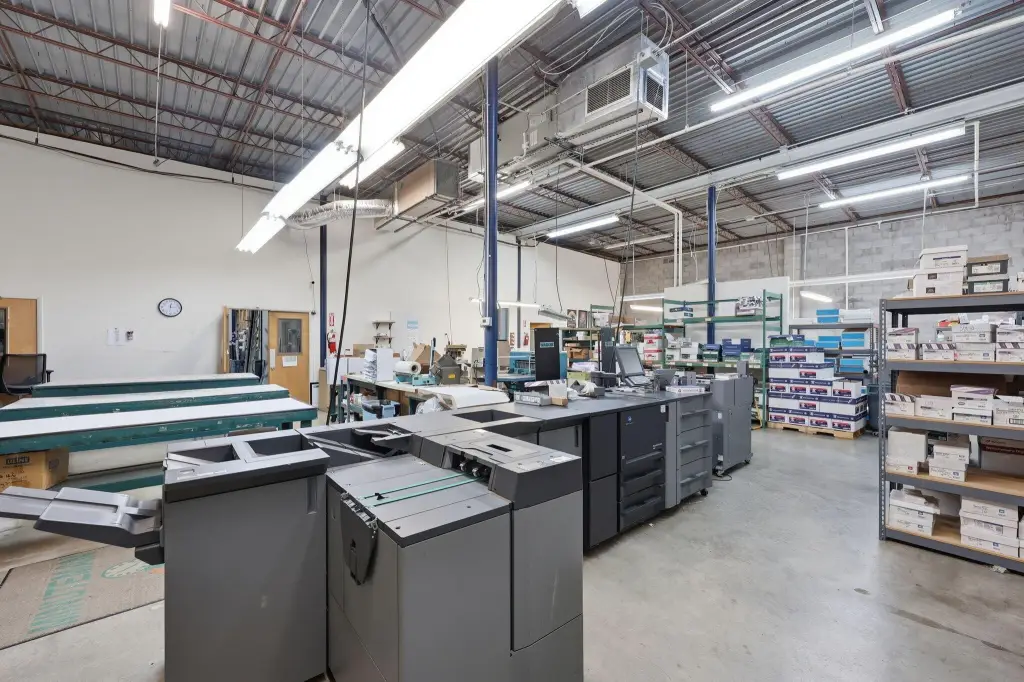
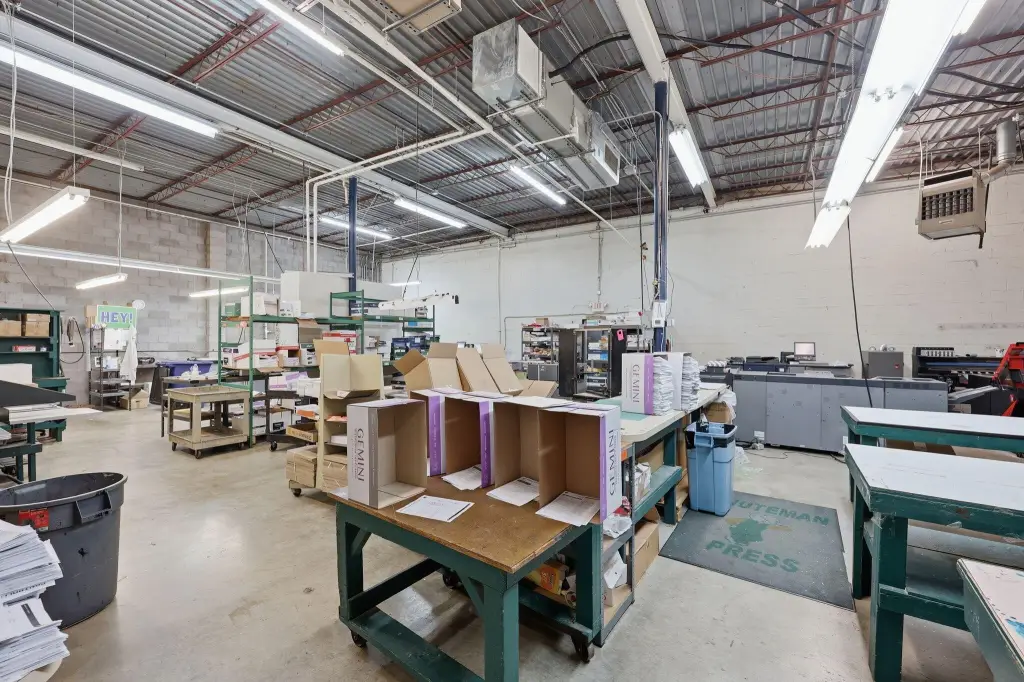
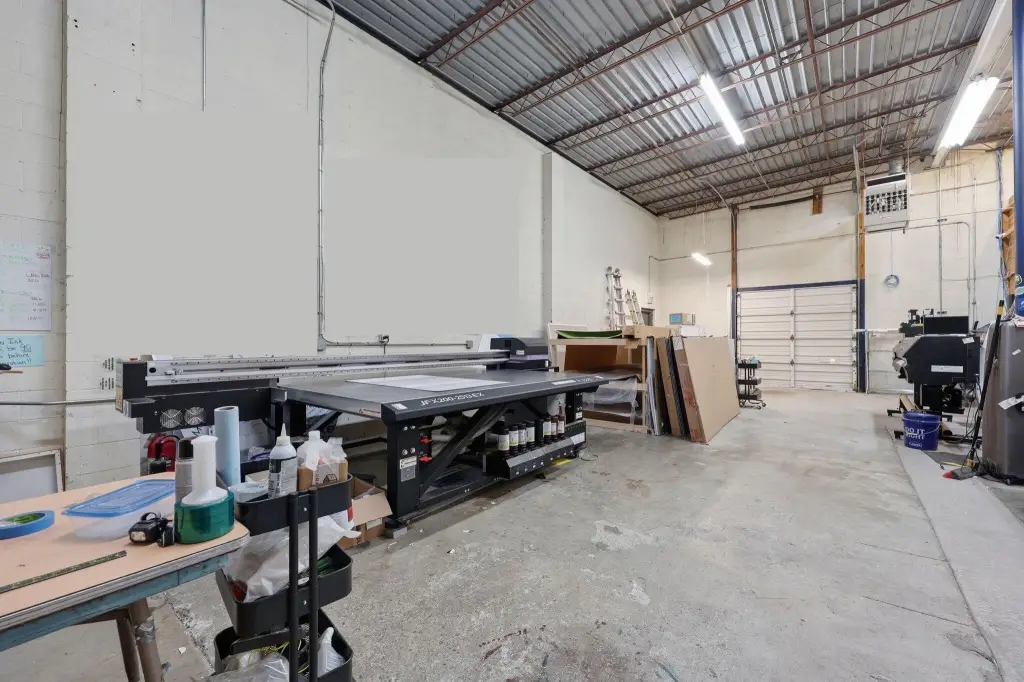
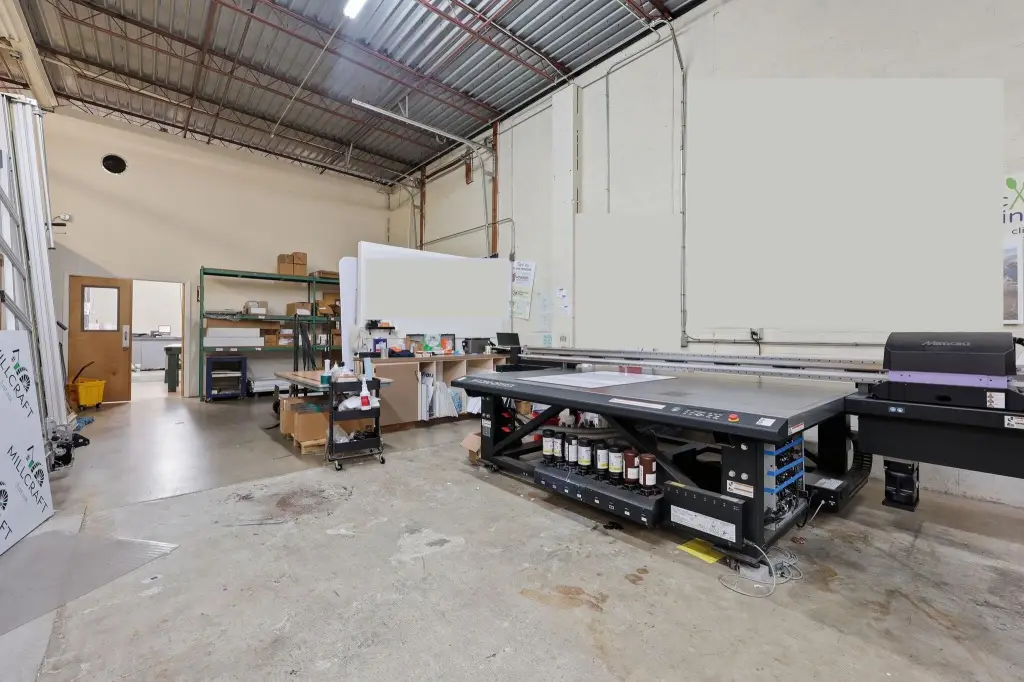
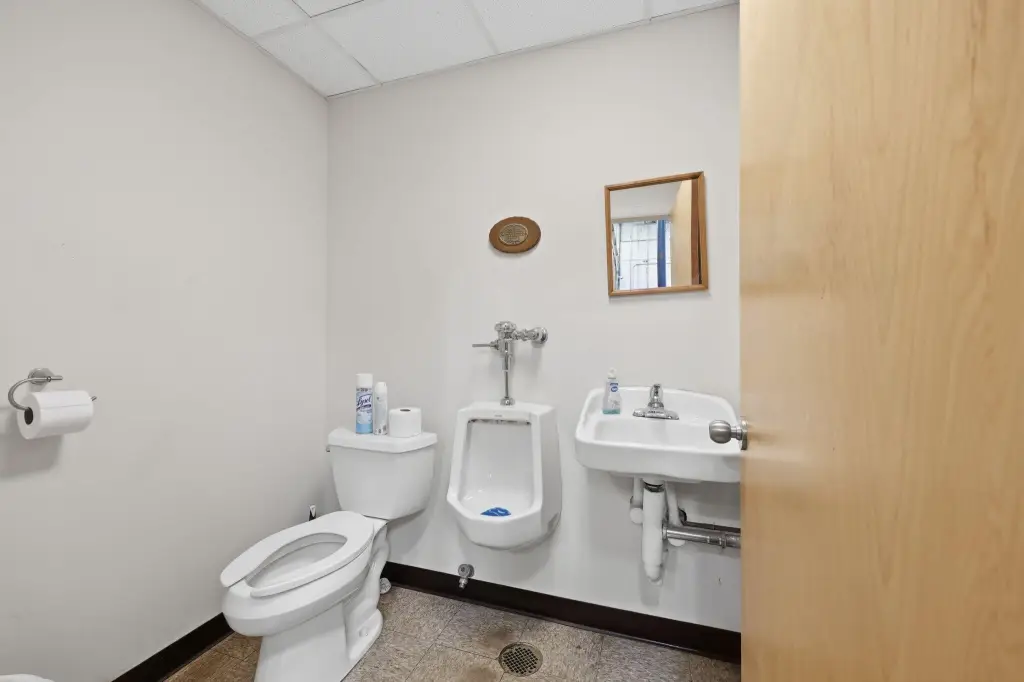
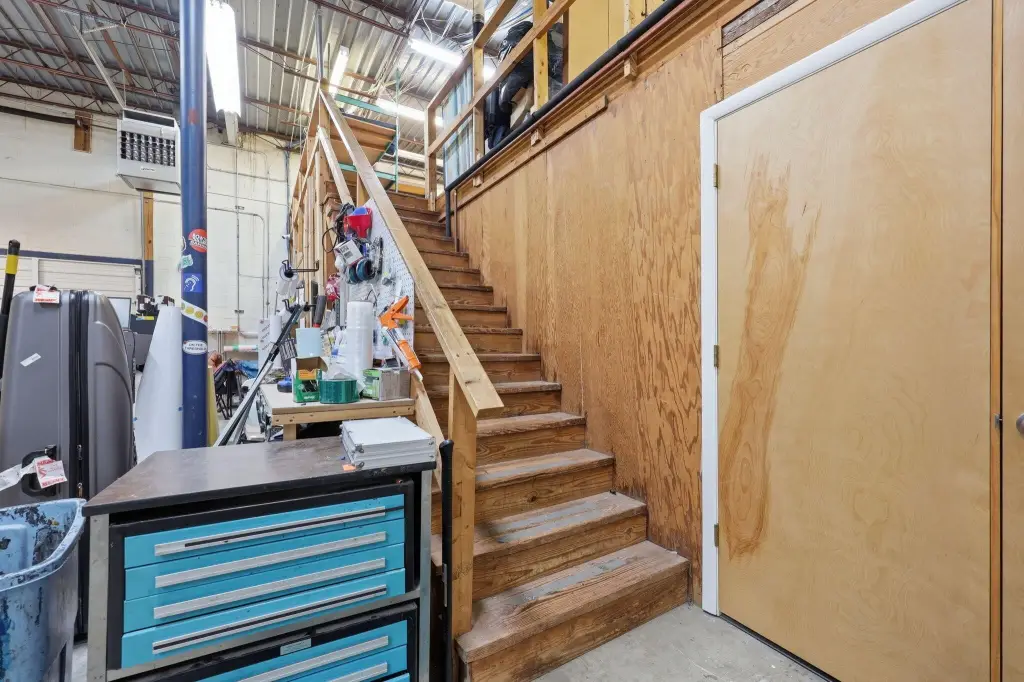
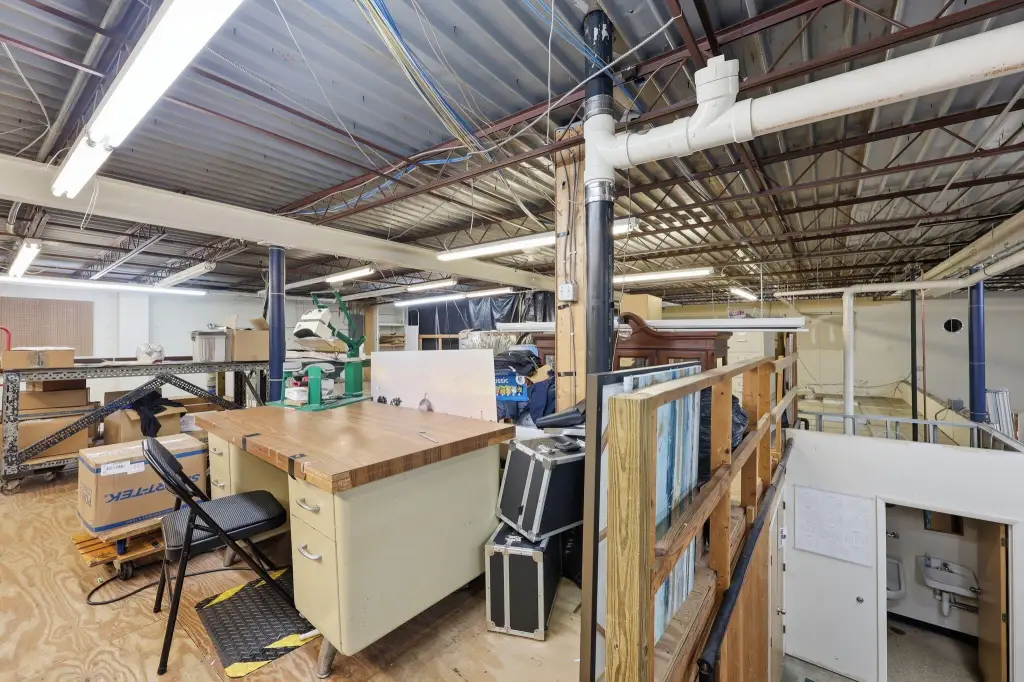
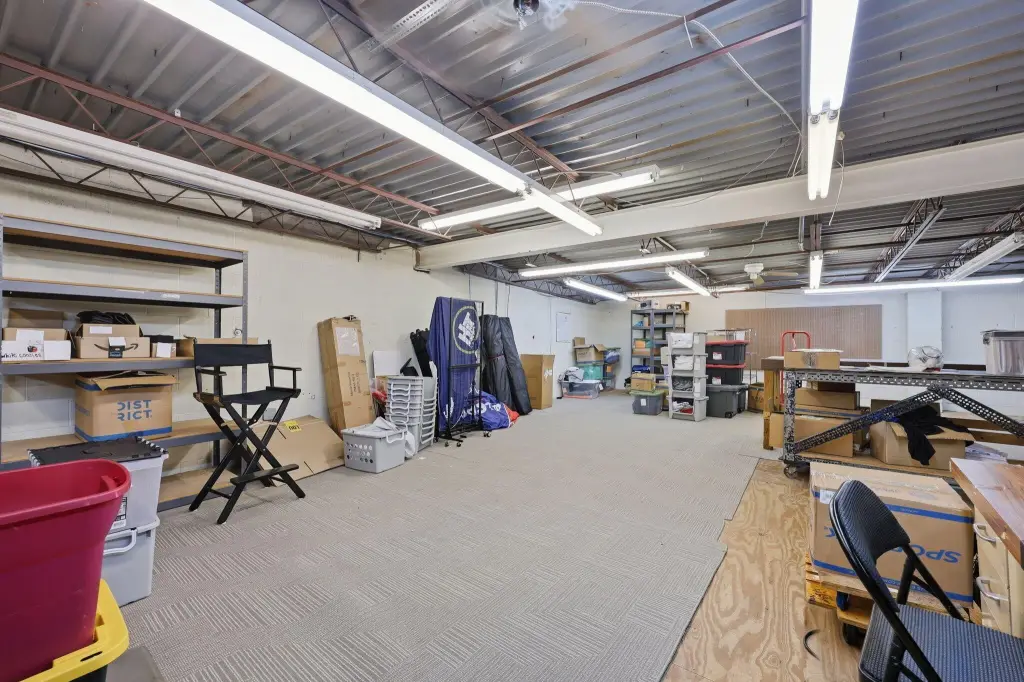
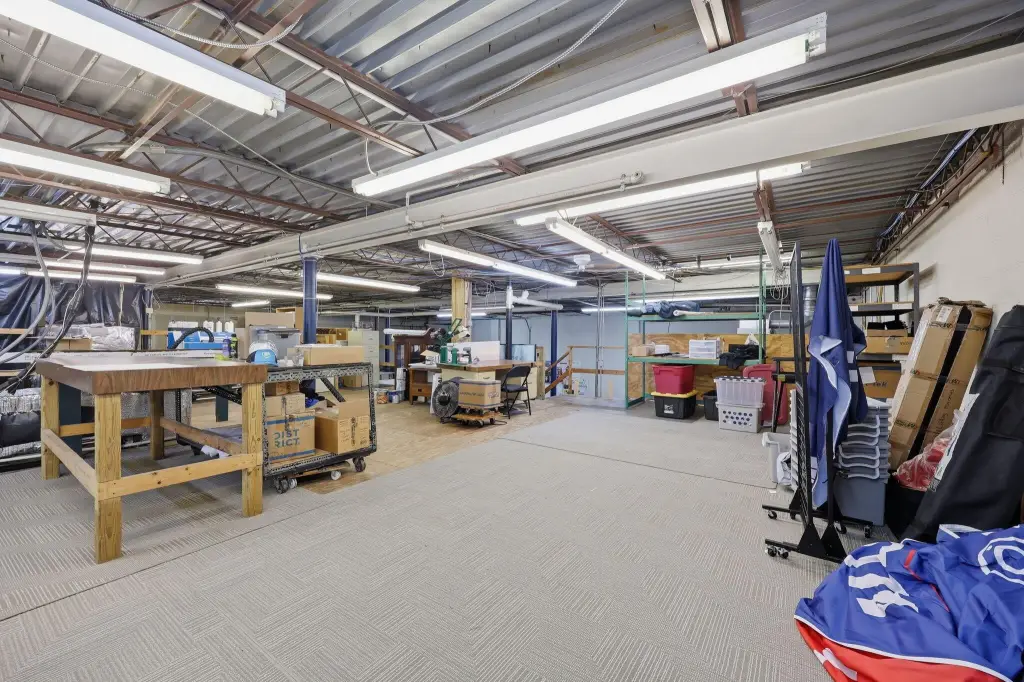
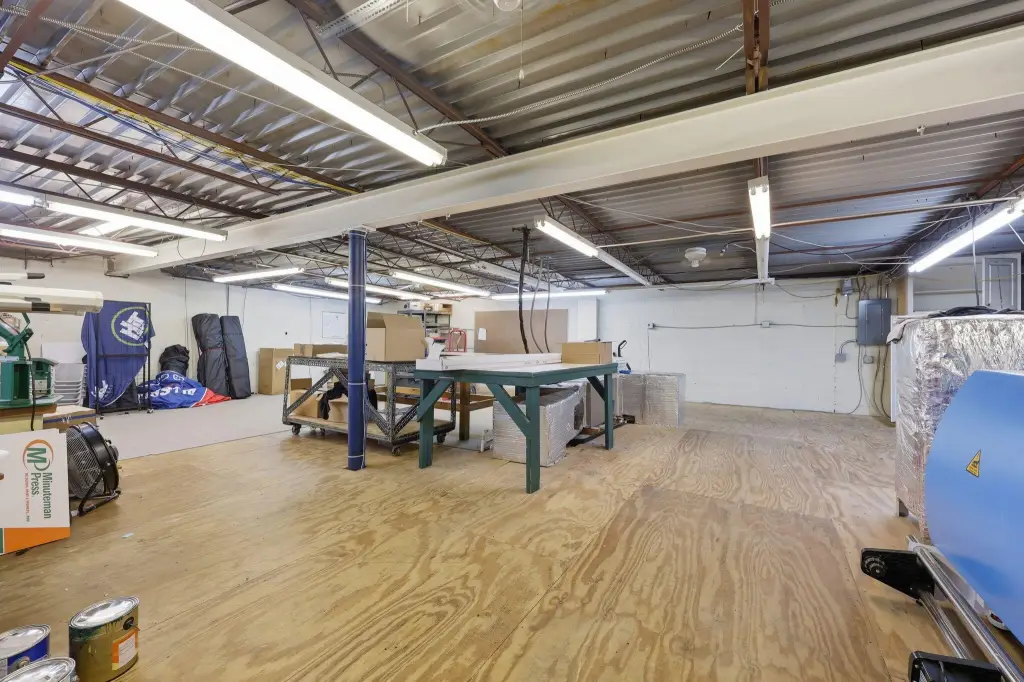
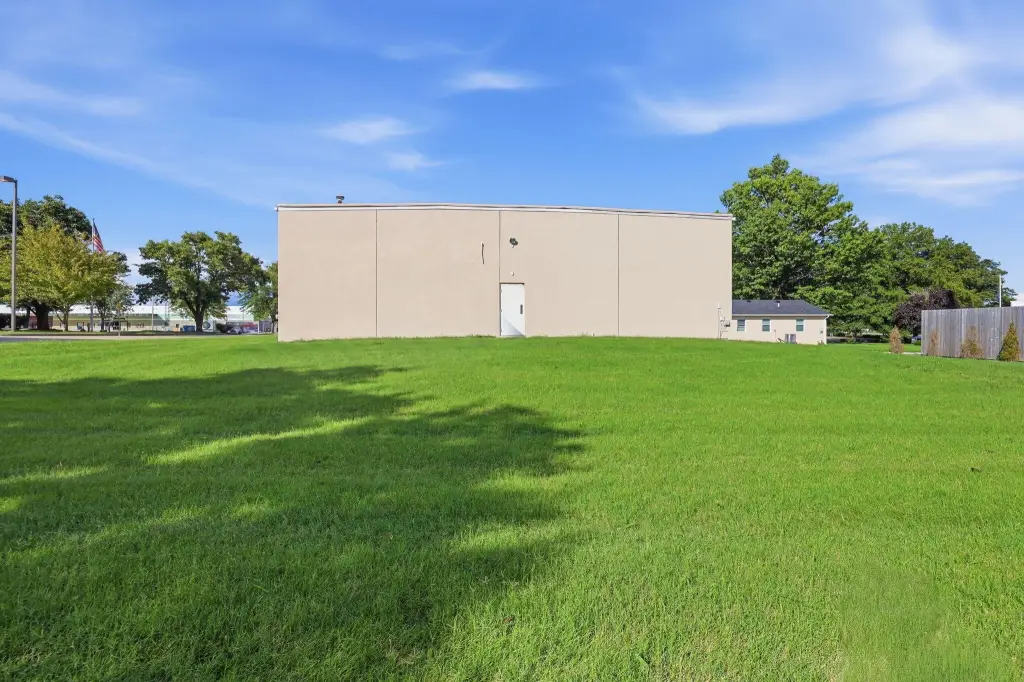
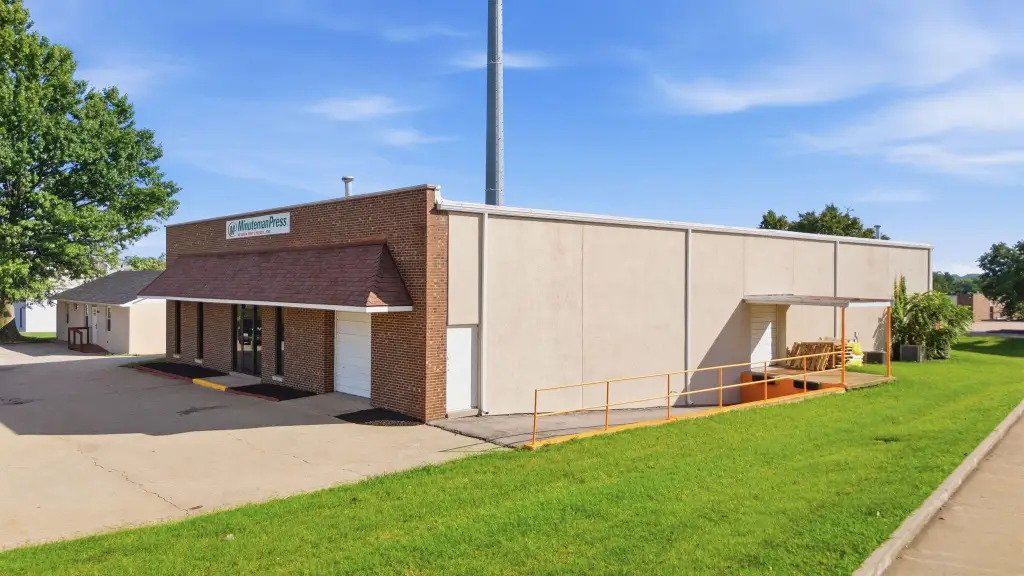
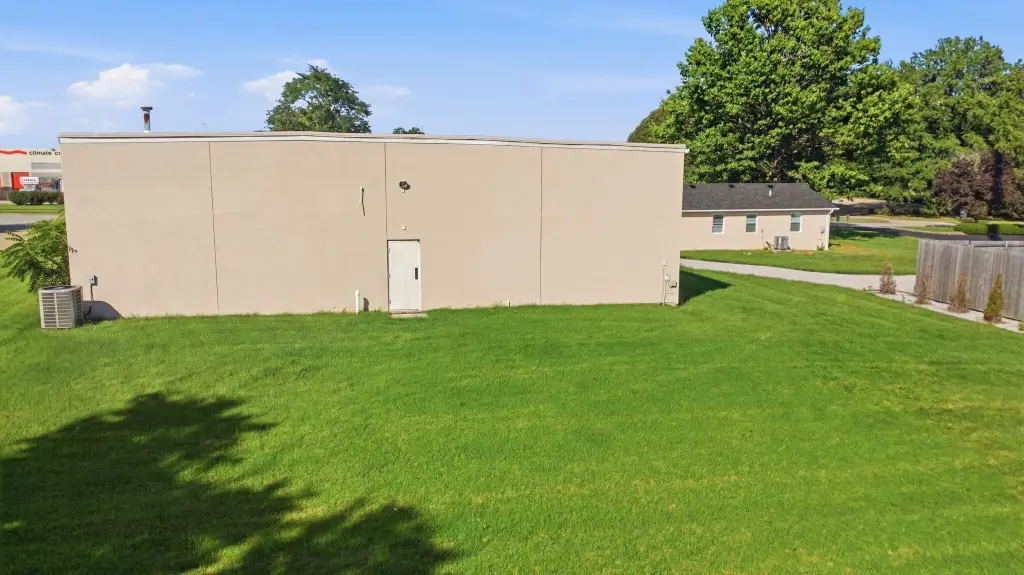
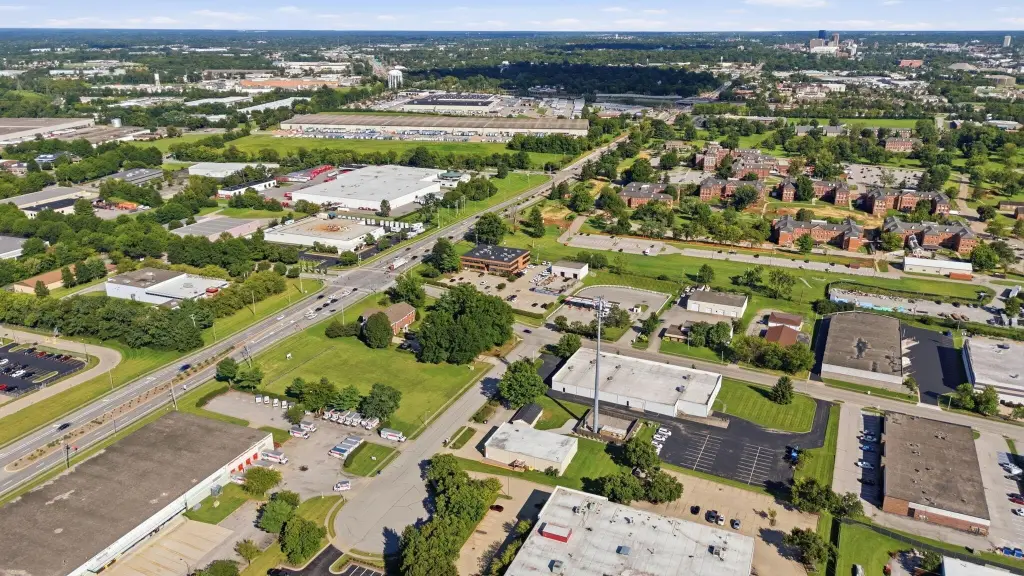
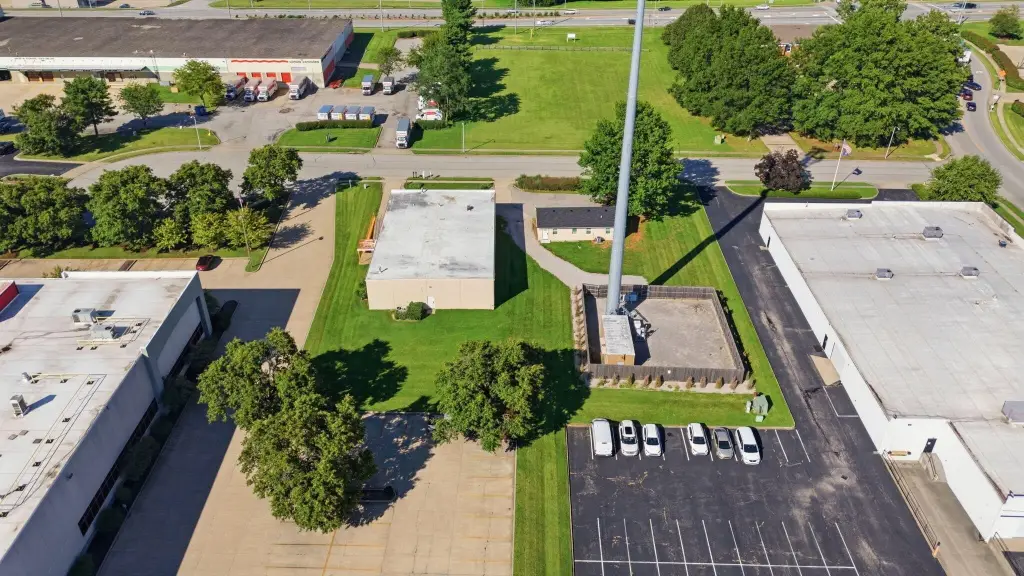
This flex property includes two separate buildings on a 1-acre parcel. The dedicated office building provides three private offices, a conference room, bathroom, and kitchenette. The adjacent approximately 6,000-square-foot facility combines reception and sales space with five offices, two bathrooms, an employee break area, and two workshop areas. A 1,363-square-foot mezzanine adds storage or operational space beyond the primary building area.
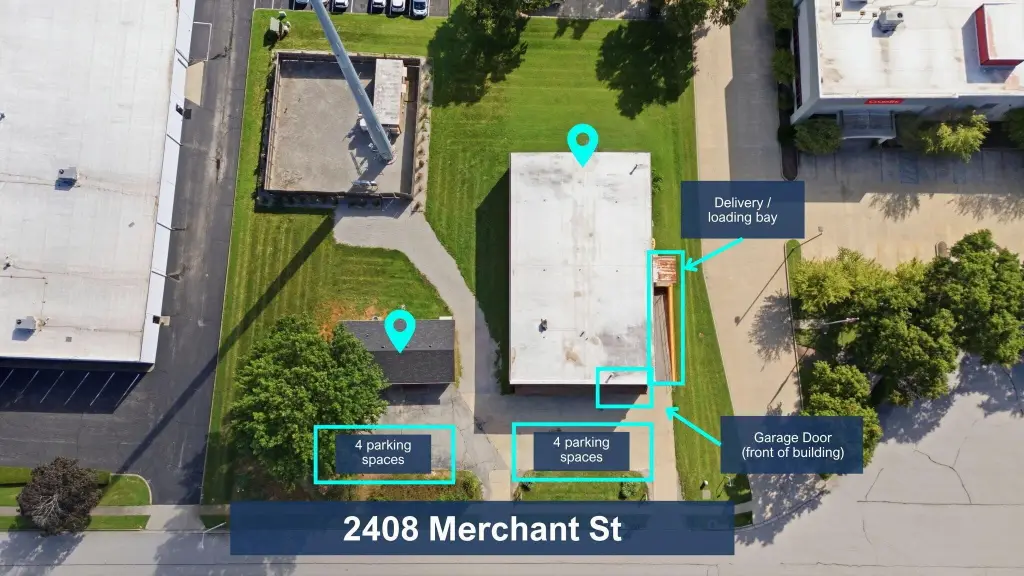
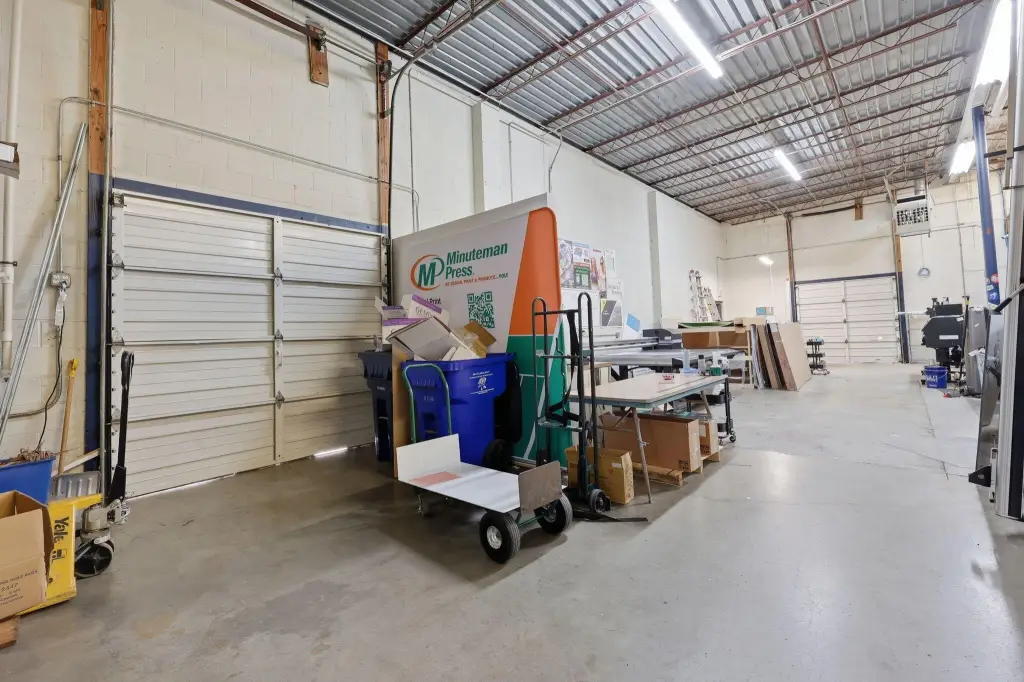
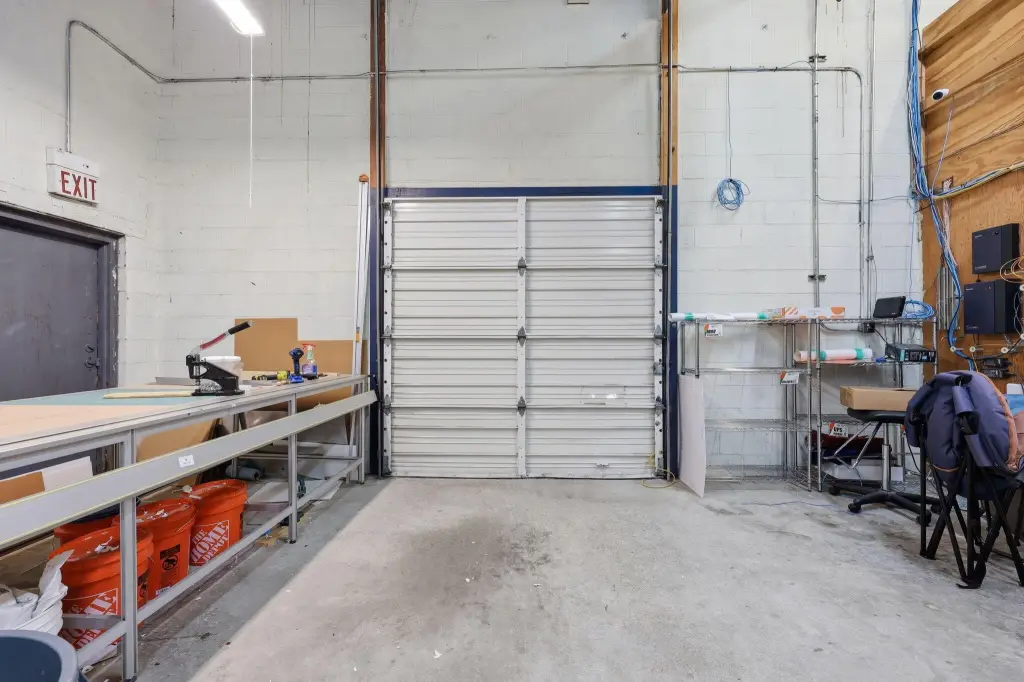
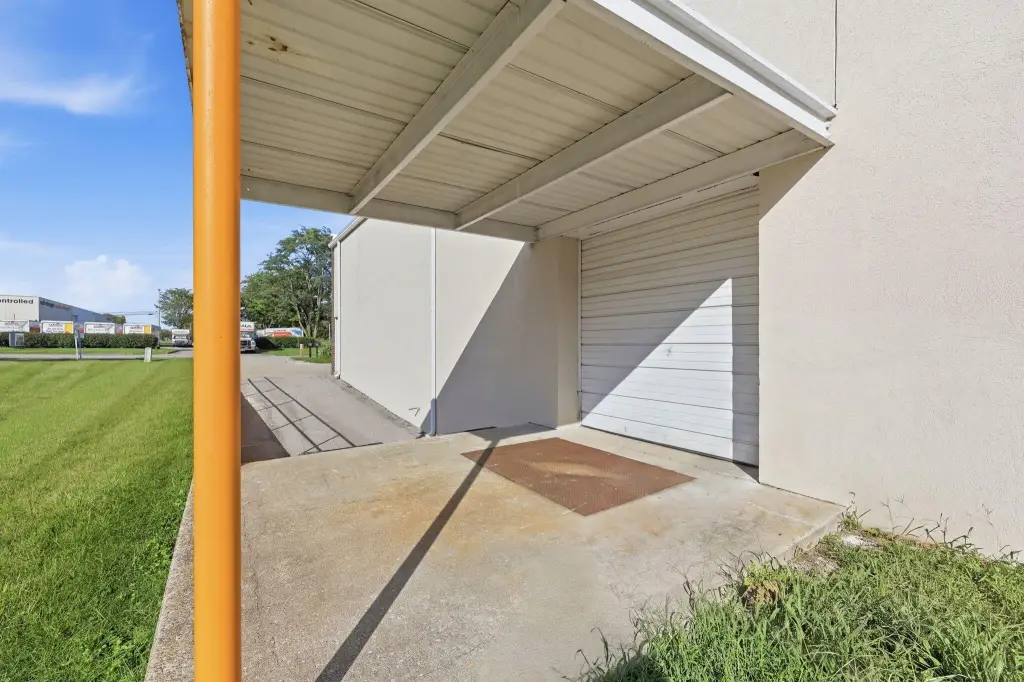
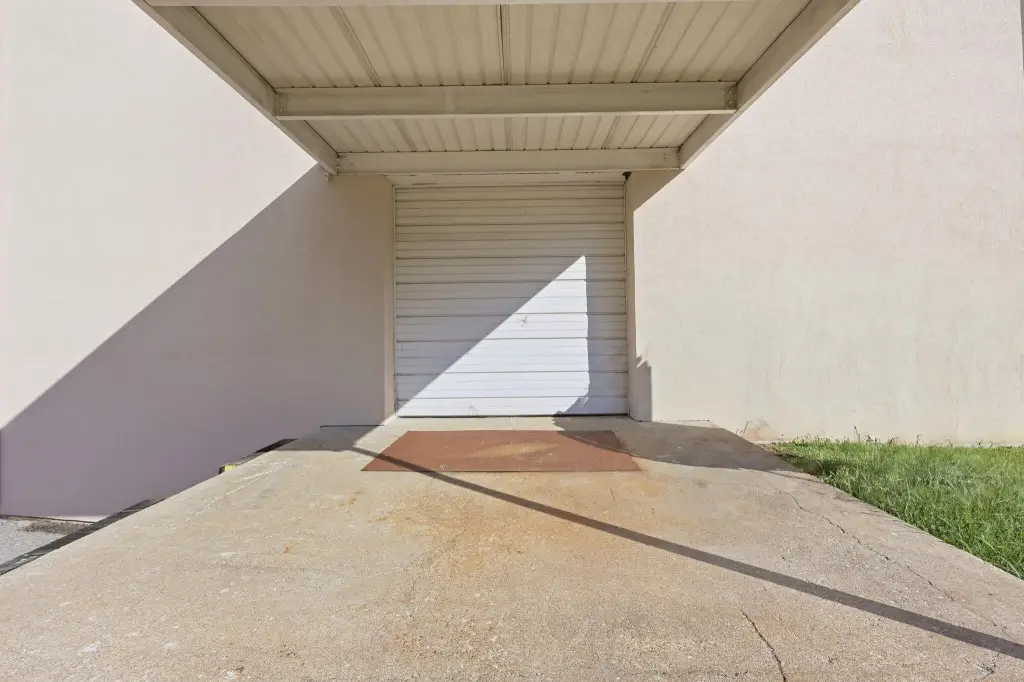
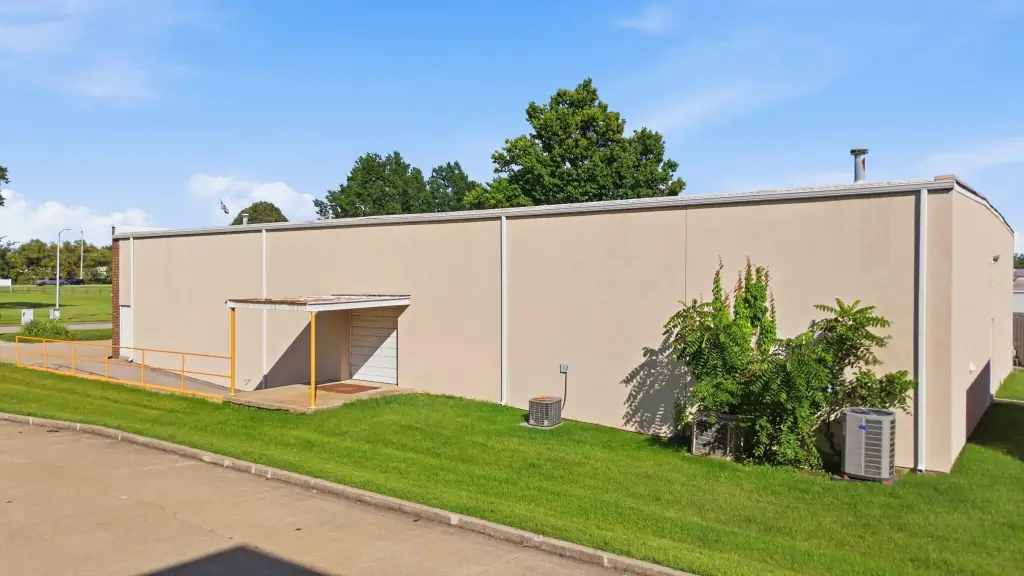
The larger workshop measures approximately 38'11" x 57'11" and has 17-foot ceilings. A second workshop measures approximately 59' x 26" and includes an 8-foot loading dock door plus an additional 8-foot garage door for drive-in access. The buildings were constructed in 1989 with block, brick, and stucco materials, and feature natural gas and electric heating, electric cooling, public sewer, and flat and shingle roofing.
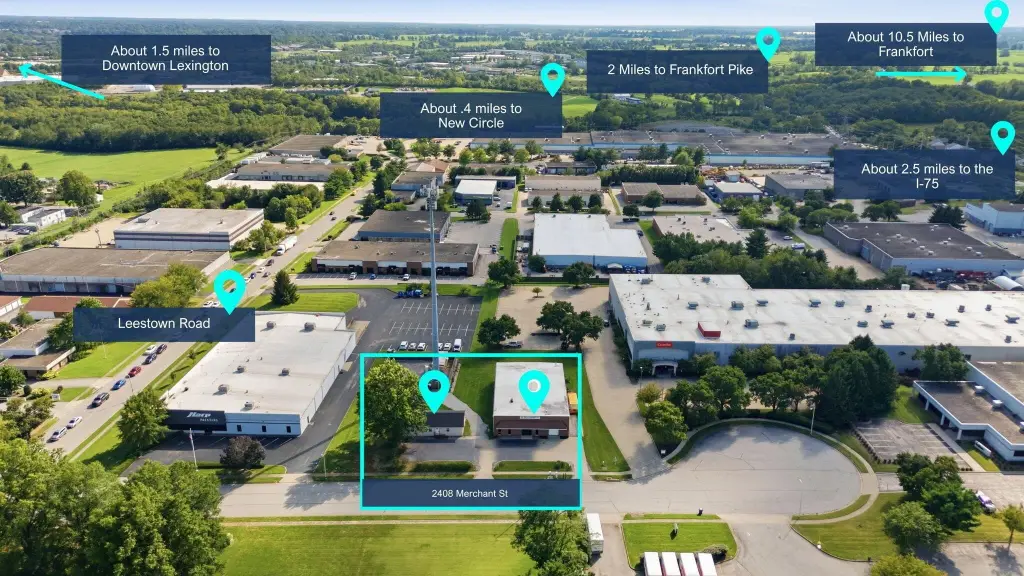
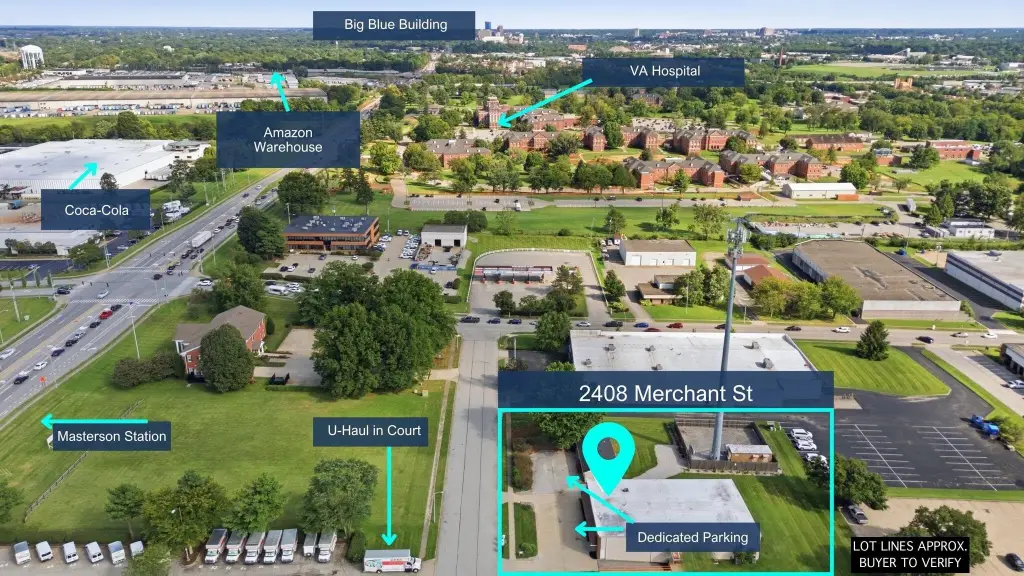
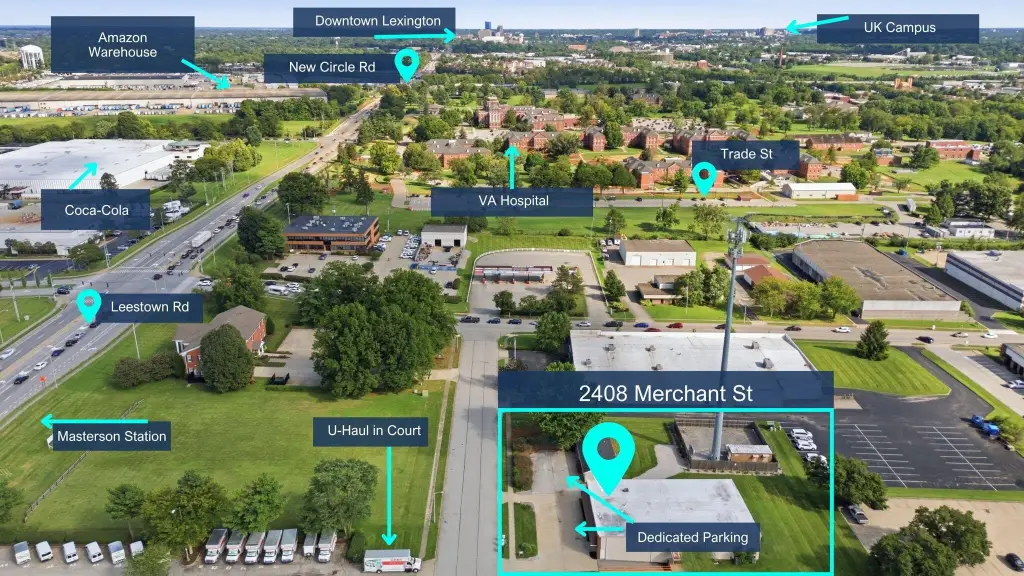
Located just off Leestown Road, the property is approximately 0.4 miles from New Circle Road, 1.5 miles from Downtown Lexington, 2 miles from Frankfort Pike, and 2.5 miles from I-75.
The larger workshop measures approximately 38'11" x 57'11" and has 17-foot ceilings. A second workshop measures approximately 59' x 26" and includes an 8-foot loading dock door plus an additional 8-foot garage door for drive-in access. The buildings were constructed in 1989 with block, brick, and stucco materials, and feature natural gas and electric heating, electric cooling, public sewer, and flat and shingle roofing.
Located just off Leestown Road, the property is approximately 0.4 miles from New Circle Road, 1.5 miles from Downtown Lexington, 2 miles from Frankfort Pike, and 2.5 miles from I-75.
Key Highlights
- Two‑building flex property on 1 acre
- Approximately 6,000 SF warehouse and office facility
- Dedicated office building with 3 private offices and conference room
Financial Insights
Estimated NOI and Cap Rate
NOI / Yr
$79,945
Cap Rate
7.54%
Suggested Prices Based on Cap Rates
Cap Rate 5%
$1,598,900
$1.6M
Cap Rate 7%
$1,142,071
$1.1M
Cap Rate 9%
$888,278
$888.3K
Market Conditions
NOI Build-Up for 7,152 SF
Gross rent
$128.7K $18.00/SF
− Vacancy
−$22.1K −$3.10/SF
EGI
$106.6K $14.90/SF
− OpEx
−$26.6K −$3.73/SF
NOI
$79.9K $11.18/SF
Area
Lexington, KY
Vacancy
17.20%
Lease Rate
$18.00 /SF/Yr
Expense Ratio
25.00%
Simulate Cap Rate and NOI
Suggested Prices Based on Cap Rates
Cap Rate 5%
$1,598,900
Cap Rate 7%
$1,142,071
Cap Rate 9%
$888,278
Alternative Uses
Best Use
Office B
$1.14M
$999.3K – $1.33M
NOI $79,945 @ 7.0% cap · market cap 7.54%
Second Best
Flex RnD
$815.3K
$713.4K – $951.2K
NOI $57,069 @ 7.0% cap · market cap 5.38%
Theoretical Best
Office A
$1.49M
$1.30M – $1.74M
NOI $104,307 @ 7.0% cap · market cap 9.84%
Zoning and permitted uses should be independently verified with authorities.
How Realmo checks its estimates
Property Analytics
Unlock full access to Insights
Subscribe to Realmo Intelligence
Open Analytics
Current Use
Lease Details
17 ft
Clear height
1
Dock-high doors
1
Drive-in doors
Yes
Highway access
Yes
Paved road access
Location Intelligence
Trade Area within ½ mile
321
Businesses Nearby
Balanced
Demand for This Use
Explore this area
Business Placement
Demographics for 40510, KY
1,562
Population
426
Households
3.7
Avg Household Size
38
Median Age
27%
College-Educated
82%
High-School Grad
22.7 sq mi
ZIP Area
69
Density / Sq Mi
$155,625
Median Household Income
$23,250
Median Earnings
$725,000
Median Home Value
Check the figures for this property
Cap Rate, Value Estimation, Potential NOI and more
View Realmo Analytics
Market
Vacancy Rate% for Office in South region

Questions? Ask Rey
Realmo’s AI knows this listing — price, zoning, demand, history. Ask anything.




Similar Off Market Nearby
- Firehouse Subs Leestown — 1781 Sharkey Way, Lexington, KY 40511
- Lexington KY Caterers-Smokin' Jax Grill BBQ Caterers — 2408 Merchant St, Lexington, KY 40511
Frequently Asked Questions
What type of property is this?
Flex space - Two-building commercial facility combining dedicated offices, warehouse space, workshops, and loading access.
Where is this flex space located?
The property is located at 2408 Merchant Street Lexington, KY.
What is the asking price?
The asking price for this property is $1,060,000.
What are key features of this property?
This property features: Two‑building flex property on 1 acre; Approximately 6,000 SF warehouse and office facility; Dedicated office building with 3 private offices and conference room