Operating Restaurant with Additional
For Sale
Contact for pricing
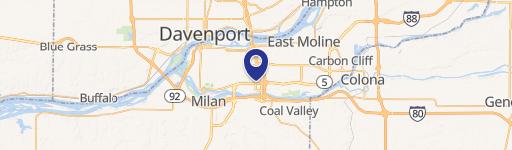
2404 16th St, Moline, IL 61265
Four-parcel commercial property combines an operating restaurant, secondary buildings, paved parking, and corner exposure for owner-user or redevelopment consideration.
Property Size4,084 SF
Lot Size1.04 Acres
Price / SF$190.74
Days on Market57
Property Features for 2404 16th St
General Information
Standard status
Active
Size
4,084 SF
Lot size
1.04 Acres
Property subtype
Retail
Zoning
Commercial
Investment Type
Owner/User
Site & Location
Road Frontage
230 ft
Road Access
Yes
Additional Details
Furnished
No
Land Use
restaurant
Equipment Included
No
Amenities
garage
Building Details
Year Built
2000
Buildings
3
Tenancy
Single
Listing Agency:
NAI Ruhl Commercial Company
Listed By:
Shawn Langan · License #475162291
(563) 355-4000
Source:
Crexi
Added: Aug 24
Changed: Oct 15
Last Checked: Oct 16 at 7:51AM
Displayed information is deemed reliable but is not guaranteed and should be independently verified. All listing content including descriptions, pricing, images are the copyrighted material of NAI Ruhl Commercial Company

Ask AI about this property
Review the available facts, identify missing information and prepare questions for the agent.
Investment Insights
Based on property information with market context.
This commercial restaurant property includes a 4,048-square-foot operating restaurant, a separate 3,360-square-foot building, and a 1,056-square-foot four-stall garage. The restaurant remains open during the sale process. Real estate only is included; the business name, operations, inventory, and FF&E are excluded, although FF&E may be available separately through negotiation. The property was built in 2000 and is zoned Commercial.
The offering comprises four parcels totaling approximately 1.04 acres. Combined frontage along 16th Street is approximately 230 feet, with corner exposure at 24th Avenue. Paved on-site parking and vacant land are included. The property is located at 2404 16th St, 2414 16th St, 2422 16th St, and 1618 24th Avenue in Moline, Illinois. Potential uses identified for the site include restaurant, retail, catering or commissary operations, storage, and redevelopment, subject to zoning and municipal approval.
The offering comprises four parcels totaling approximately 1.04 acres. Combined frontage along 16th Street is approximately 230 feet, with corner exposure at 24th Avenue. Paved on-site parking and vacant land are included. The property is located at 2404 16th St, 2414 16th St, 2422 16th St, and 1618 24th Avenue in Moline, Illinois. Potential uses identified for the site include restaurant, retail, catering or commissary operations, storage, and redevelopment, subject to zoning and municipal approval.
Key Highlights
- 4,048 SF operating restaurant remains open during the sale process
- Four‑parcel package totals approximately 1.04 acres
- Additional 3,360 SF building and 1,056 SF four‑stall garage included
Financial Insights
Estimated NOI and Cap Rate
NOI / Yr
$48,033
Cap Rate
6.17%
Suggested Prices Based on Cap Rates
Cap Rate 5%
$960,660
$960.7K
Cap Rate 7%
$686,186
$686.2K
Cap Rate 9%
$533,700
$533.7K
Market Conditions
NOI Build-Up for 4,084 SF
Gross rent
$66.2K $16.20/SF
− Vacancy
−$2.1K −$0.52/SF
EGI
$64.0K $15.68/SF
− OpEx
−$16.0K −$3.92/SF
NOI
$48.0K $11.76/SF
Area
Rock Island County, IL
Vacancy
3.20%
Lease Rate
$16.20 /SF/Yr
Expense Ratio
25.00%
Simulate Cap Rate and NOI
Suggested Prices Based on Cap Rates
Cap Rate 5%
$960,660
Cap Rate 7%
$686,186
Cap Rate 9%
$533,700
Alternative Uses
Best Use
Specialty Retail
$686.2K
$600.4K – $800.6K
NOI $48,033 @ 7.0% cap · market cap 6.17%
Second Best
—
—
no second resolved use
Theoretical Best
Healthcare Medical
$695.5K
$608.6K – $811.5K
NOI $48,687 @ 7.0% cap · market cap 6.25%
Zoning and permitted uses should be independently verified with authorities.
How Realmo checks its estimates
Property Analytics
Unlock full access to Insights
Subscribe to Realmo Intelligence
Open Analytics
Current Use
Lease Details
Yes
Paved road access
Location Intelligence
Trade Area within ½ mile
393
Businesses Nearby
39k
Monthly Visits Nearby
Under-served
Demand for This Use
Explore this area
Business Placement
Foot Traffic Nearby
Shops & Services 55%
Dining 35%
Home Improvements & Furnishings 9%
Electronics 1%
Hardee's
Dining
7,473 visits/mo
0.1 miles
BP
Shops & Services
5,818 visits/mo
0.4 miles
La Rancherita
Dining
4,801 visits/mo
0.1 miles
7-Eleven
Shops & Services
4,673 visits/mo
0.4 miles
Conoco
Shops & Services
3,721 visits/mo
0.3 miles
Demographics for 61265, IL
44,342
Population
20,396
Households
2.2
Avg Household Size
40
Median Age
28%
College-Educated
89%
High-School Grad
19.2 sq mi
ZIP Area
2,309
Density / Sq Mi
$63,910
Median Household Income
$38,960
Median Earnings
$890
Median Rent
$142,300
Median Home Value
Check the figures for this property
Cap Rate, Value Estimation, Potential NOI and more
View Realmo Analytics
Market
Vacancy Rate% for Retail in Midwest region



Frequently Asked Questions
What type of property is this?
Conventional restaurant - Four-parcel commercial property combines an operating restaurant, secondary buildings, paved parking, and corner exposure for owner-user or redevelopment consideration.
Where is this conventional restaurant located?
The property is located at 2404 16th St Moline, IL.
What is the asking price?
The asking price for this property is $779,000.
What are key features of this property?
This property features: 4,048 SF operating restaurant remains open during the sale process; Four‑parcel package totals approximately 1.04 acres; Additional 3,360 SF building and 1,056 SF four‑stall garage included


