End-Unit Residential Income
For Sale
$359,995
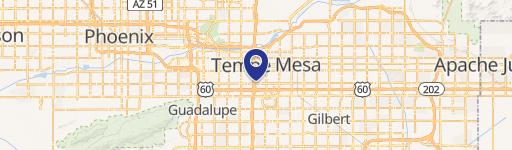
2401 E RIO SALADO Parkway 1022, Tempe, AZ 85288
Two-story townhome with updated interiors, private balconies, and an attached garage within a community amenity setting.
Property Size1,105 SF
Days on Market72
Property Features for 2401 E RIO SALADO Parkway 1022
General Information
Standard status
Active
Size
1,105 SF
Total Parking Spaces
1
Property subtype
Apartment
Units
Unit Mix
1 x 2BR/2BA
Multifamily Units
1
Additional Details
Highway Access
Yes
Taxes and HOA fees
Annual Taxes
$2,054
Amenities
pool
spa
BBQ area
Building Details
Building Size
1,105 SF
Year Built
2007
Listing Agency:
Property Management Real Estate
Listed By:
Aaron Michael Simpson
(480) 737-9781
Source:
Alexiabertsatos
Added: Aug 7
Changed: Oct 17
Last Checked: Oct 16 at 6:11PM
Displayed information is deemed reliable but is not guaranteed and should be independently verified. All listing content including descriptions, pricing, images are the copyrighted material of Property Management Real Estate

Ask AI about this property
Review the available facts, identify missing information and prepare questions for the agent.
Investment Insights
Based on property information with market context.
This two-story, 2-bedroom, 2-bathroom townhome is positioned as an end unit within the Villagio community. Interior features include wood-plank style tile flooring, a remodeled primary bathroom, spacious living areas, and an attached 1-car garage. Private balconies provide outdoor space, including direct access from the primary suite, which also offers extended vanity space and a large walk-in closet.
Community amenities include two pools, a spa, and a BBQ area. The property is directly across the street from the Chicago Cubs Spring Training Stadium and offers access to the 101, 202, and US-60 freeways. Built in 2007, the residence combines a defined two-story layout with updated primary-bath finishes and on-site recreational amenities.
Community amenities include two pools, a spa, and a BBQ area. The property is directly across the street from the Chicago Cubs Spring Training Stadium and offers access to the 101, 202, and US-60 freeways. Built in 2007, the residence combines a defined two-story layout with updated primary-bath finishes and on-site recreational amenities.
Key Highlights
- End‑unit townhome with 2 bedrooms and 2 bathrooms
- Two‑story floor plan with private balconies
- Remodeled primary bathroom and wood‑plank style tile flooring
Financial Insights
Estimated NOI and Cap Rate
NOI / Yr
$14,977
Cap Rate
4.16%
Suggested Prices Based on Cap Rates
Cap Rate 5%
$299,540
$299.5K
Cap Rate 7%
$213,957
$214.0K
Cap Rate 9%
$166,411
$166.4K
Market Conditions
NOI Build-Up for 1,105 SF
Gross rent
$28.9K $26.16/SF
− Vacancy
−$1.7K −$1.52/SF
EGI
$27.2K $24.64/SF
− OpEx
−$12.3K −$11.09/SF
NOI
$15.0K $13.55/SF
Area
Tempe, AZ
Vacancy
5.80%
Lease Rate
$26.16 /SF/Yr
Expense Ratio
45.00%
Simulate Cap Rate and NOI
Suggested Prices Based on Cap Rates
Cap Rate 5%
$299,540
Cap Rate 7%
$213,957
Cap Rate 9%
$166,411
Alternative Uses
Best Use
Apartment 5plus
$214.0K
$187.2K – $249.6K
NOI $14,977 @ 7.0% cap · market cap 4.16%
Second Best
—
—
no second resolved use
Theoretical Best
Office A
$347.5K
$304.1K – $405.4K
NOI $24,324 @ 7.0% cap · market cap 6.76%
Zoning and permitted uses should be independently verified with authorities.
How Realmo checks its estimates
Property Analytics
Current Use
Lease Details
1
Residential units
Yes
Highway access
Location Intelligence
Trade Area within ½ mile
555
Businesses Nearby
Explore this area
Business Placement




Frequently Asked Questions
What type of property is this?
Residential income property - Two-story townhome with updated interiors, private balconies, and an attached garage within a community amenity setting.
Where is this residential income property located?
The property is located at 2401 E RIO SALADO Parkway 1022 Tempe, AZ.
What is the asking price?
The asking price for this property is $359,995.
What are key features of this property?
This property features: End‑unit townhome with 2 bedrooms and 2 bathrooms; Two‑story floor plan with private balconies; Remodeled primary bathroom and wood‑plank style tile flooring


