Leased Mixed-Use
For Sale
$1,685,000
24 N MAIN Street, Pennington, NJ 08534
Commercial Sale, PENNINGTON, NJ
Property Size6,236 SF
Lot Size0.13 Acres
Price / SF$270.21
Days on Market263
Property Features for 24 N MAIN Street
General Information
Property type
Other
Property subtype
Office
Parking
2
Parking features
On Street, Parking Lot
Elementary school district
HOPEWELL VALLEY REGIONAL SCHOOLS
Middle school district
HOPEWELL VALLEY REGIONAL SCHOOLS
High school district
HOPEWELL VALLEY REGIONAL SCHOOLS
Standard status
Active
Lot size
0.13 Acres
Additional Details
Tenant in Place
Yes
Mixed-Use Components
retail, office
Property Use
Mixed-Use
Taxes and HOA fees
Tax Annual Amount
22282
Utilities
Heating system
Forced Air
Cooling system
Wall Unit(s), Central Air
Amenities
handicap accessible
hardwood floors
tall ceilings
large windows
natural light
pantry
Building Details
Year built
1900
Number of units
3
Building materials
Brick
Buildings
1
Listing Agency:
BHHS Fox & Roach Hopewell Valley
(609) 737-9100
Listed By:
Gough W Thompson III · License #900694
(609) 468-3838
Added: Feb 5
Changed: Oct 23
Last Checked: Oct 26 at 8:06PM
MLS# NJME2072436
Copyright © 2026 Bright MLS. All rights reserved. All information provided by the listing agent/broker is deemed reliable but is not guaranteed and should be independently verified.

Ask AI about this property
Review the available facts, identify missing information and prepare questions for the agent.
Investment Insights
Based on property information with market context.
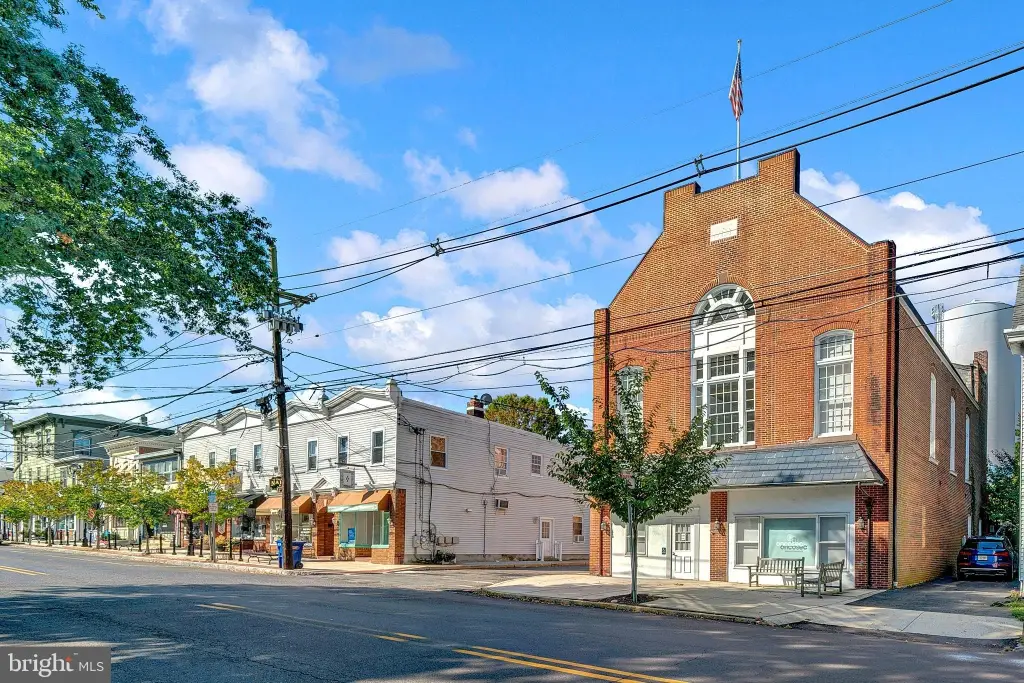
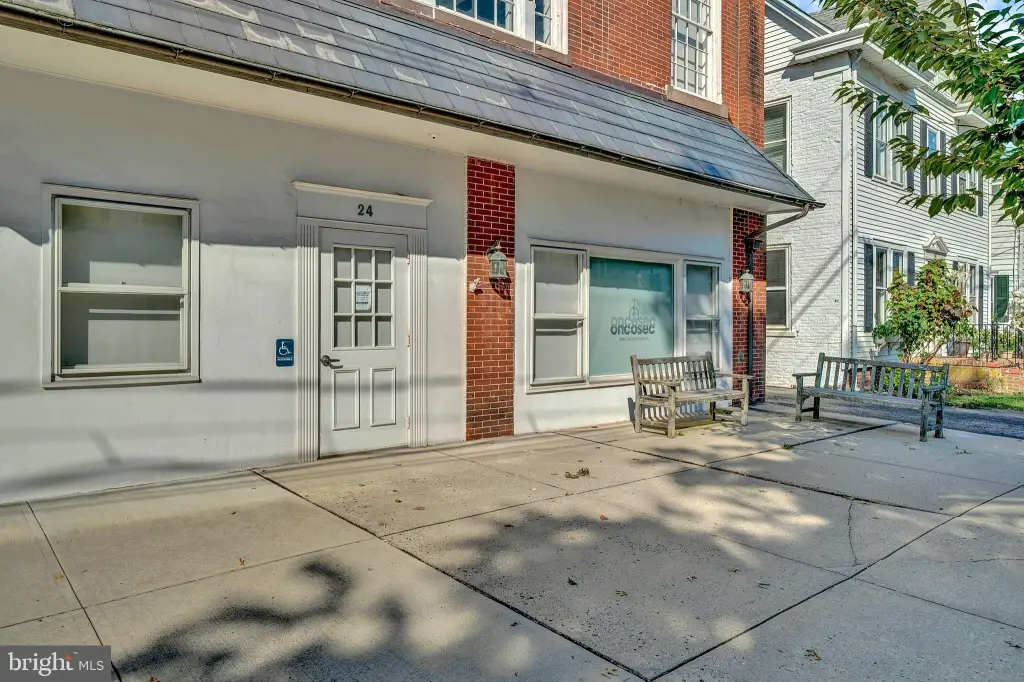
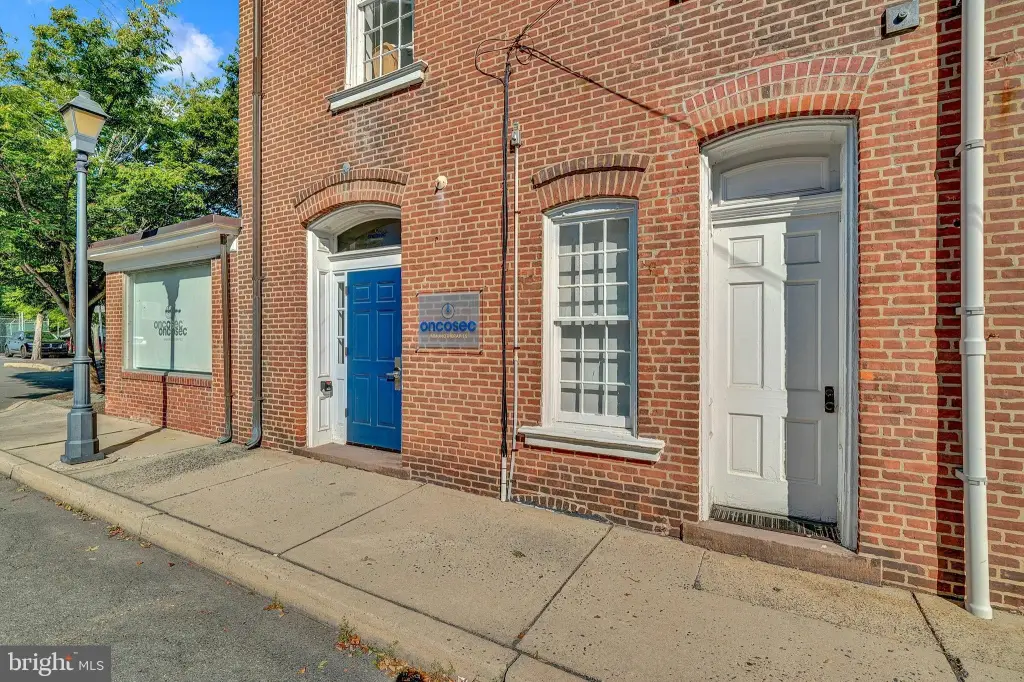
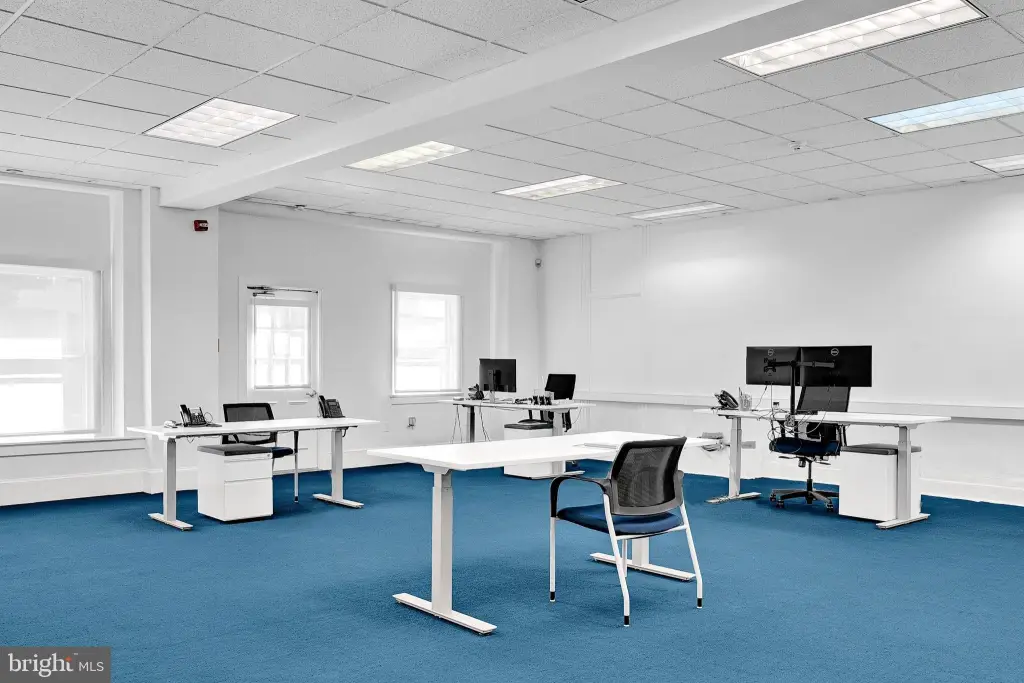
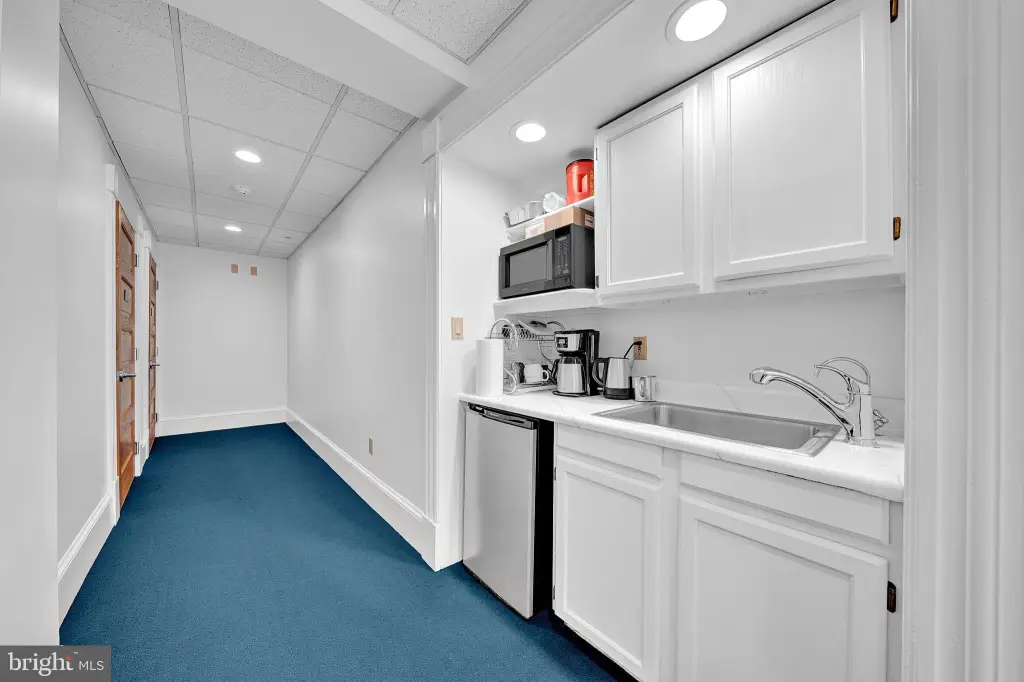
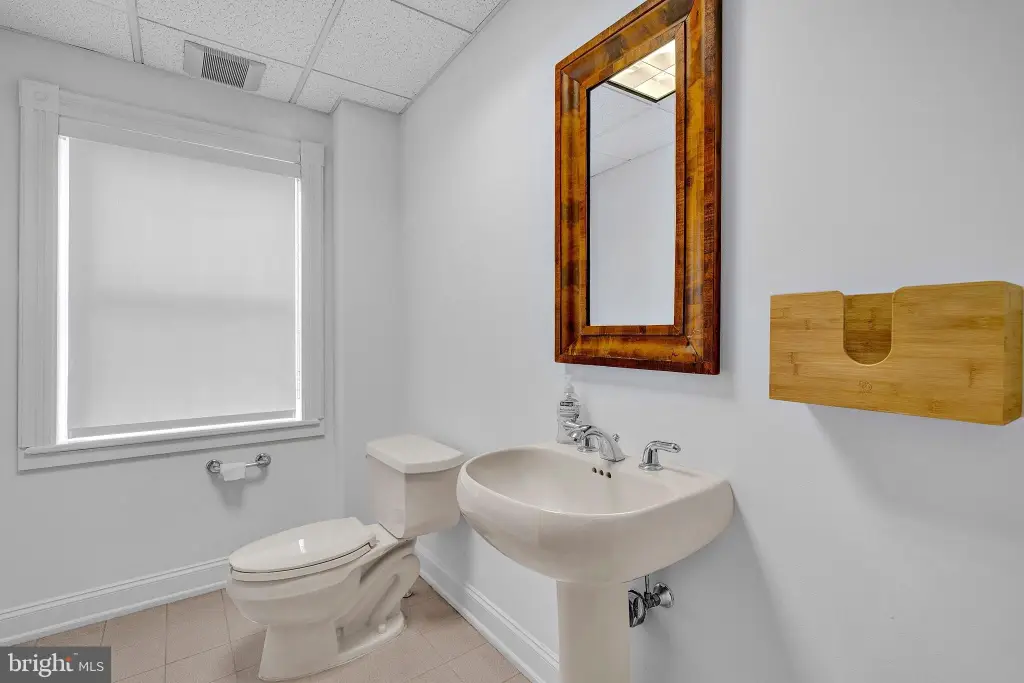
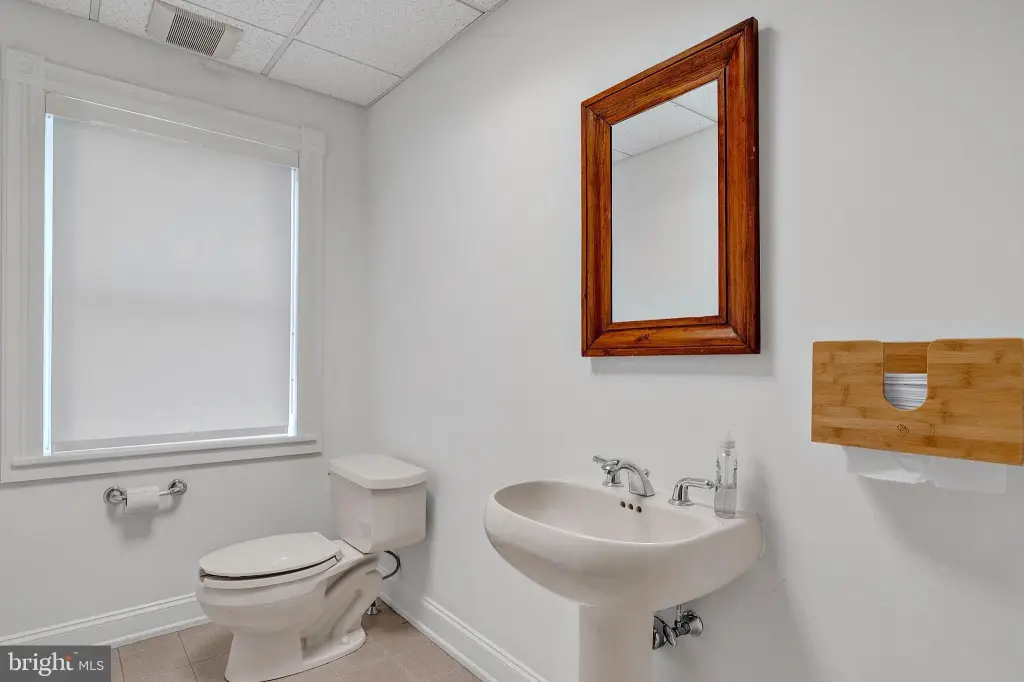
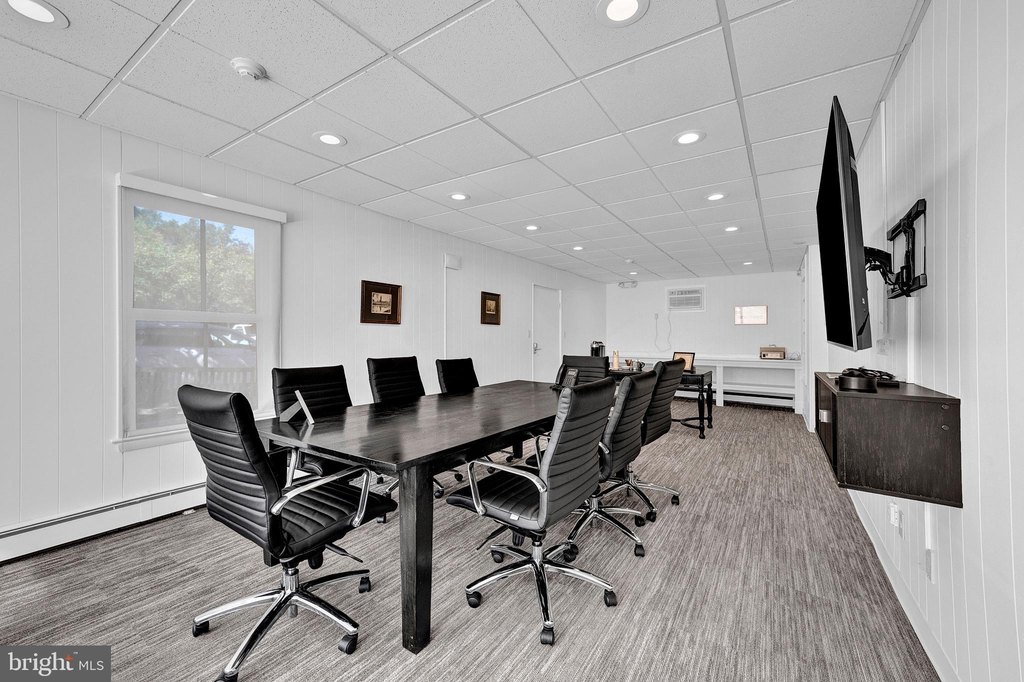
This brick mixed-use property at 24 N Main Street includes 6,236 SF across three levels. The 2,968 SF first floor is handicap accessible and divided into three suites with individual street entrances. One 1,207 SF suite is available for retail or office use, while the remaining first-floor spaces are leased to professional and office users. Shared amenities include two bathrooms and a pantry area.
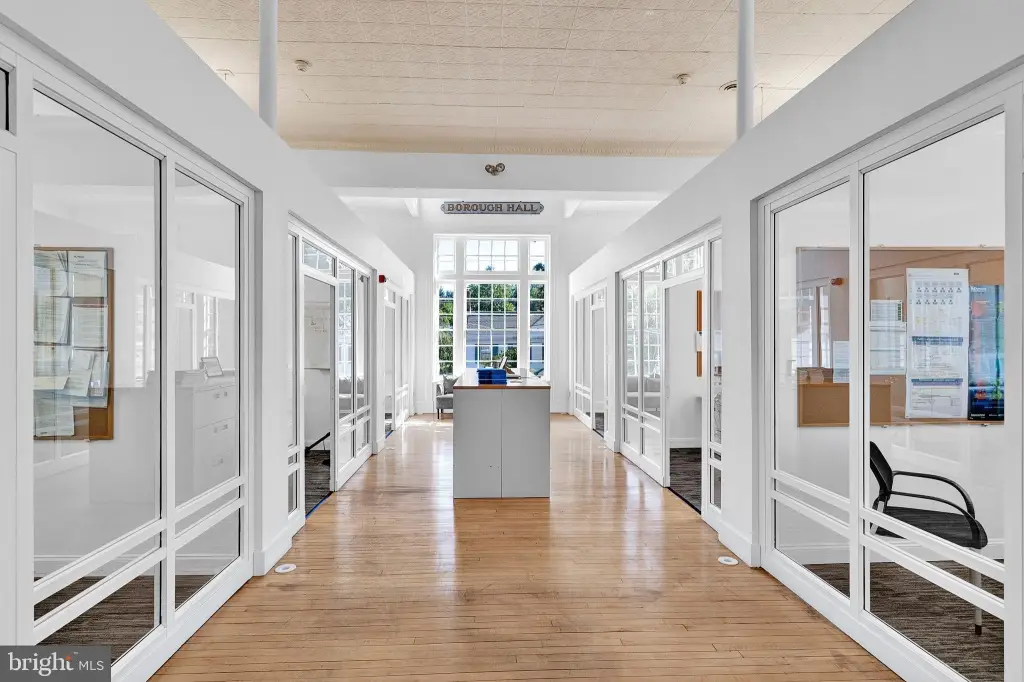
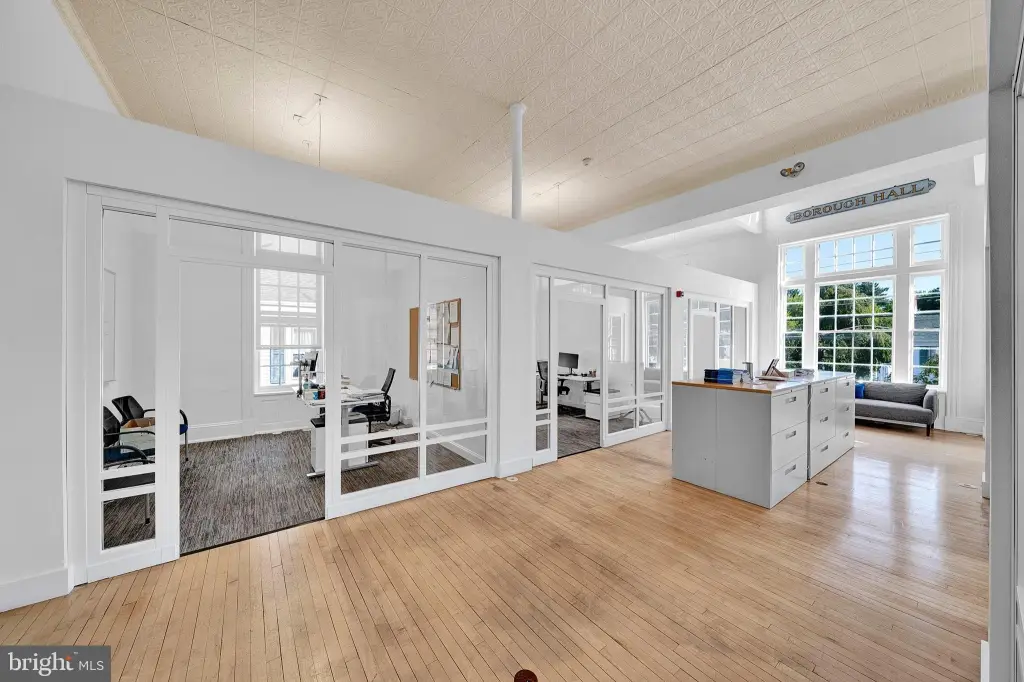
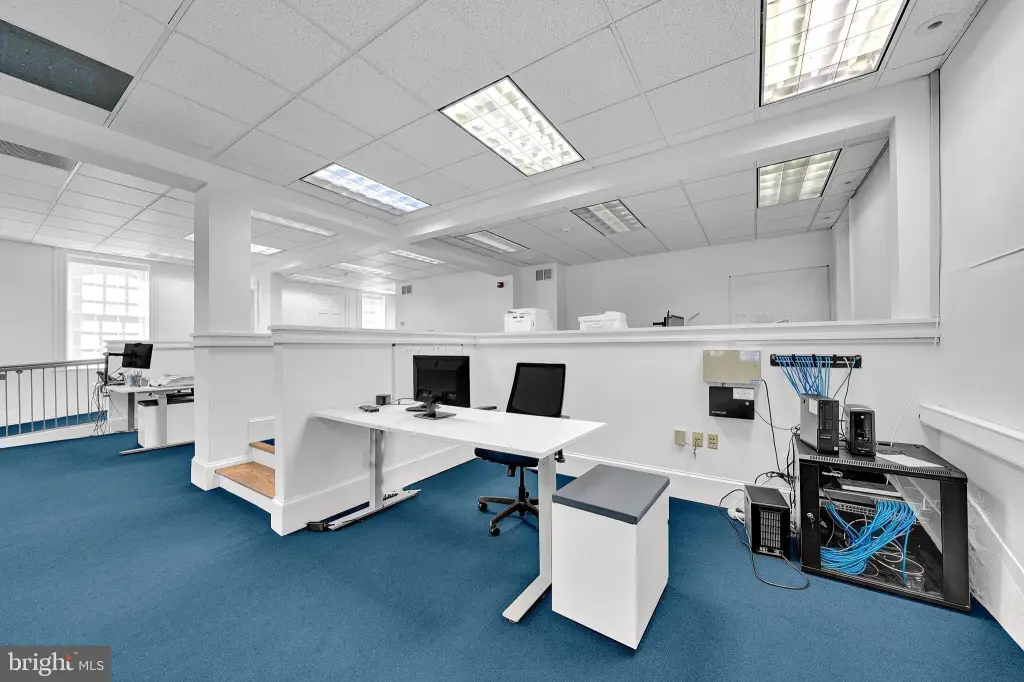
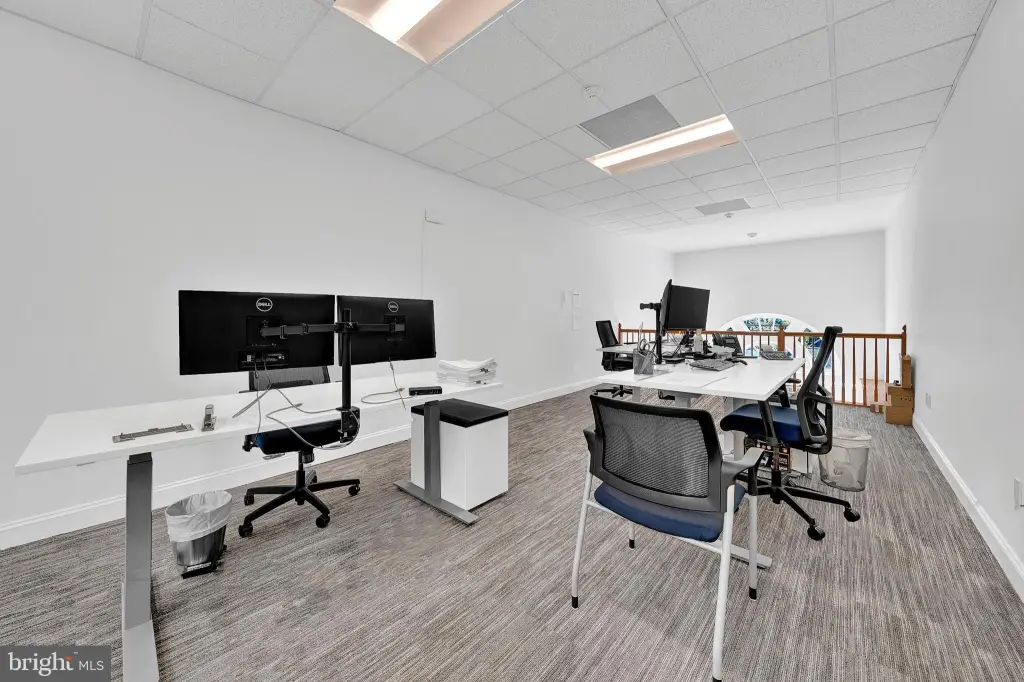
The second and third floors provide 3,268 SF leased to an architectural firm. Their layout includes private offices, shared work areas, hardwood flooring, tall ceilings, large windows, abundant natural light, and two additional bathrooms. The building was substantially updated in 1997, with flooring and paint refreshed in 2019. Two reserved on-site parking spaces supplement parking in the adjacent municipal lot and on the street. Central air, wall-unit cooling, and forced-air heating serve the property.
The second and third floors provide 3,268 SF leased to an architectural firm. Their layout includes private offices, shared work areas, hardwood flooring, tall ceilings, large windows, abundant natural light, and two additional bathrooms. The building was substantially updated in 1997, with flooring and paint refreshed in 2019. Two reserved on-site parking spaces supplement parking in the adjacent municipal lot and on the street. Central air, wall-unit cooling, and forced-air heating serve the property.
Key Highlights
- 6,236 SF mixed‑use building at 24 N Main Street, Pennington, NJ
- 2,968 SF handicap‑accessible first floor with three street‑level suites
- 1,207 SF retail suite available for office or retail use
Financial Insights
Estimated NOI and Cap Rate
NOI / Yr
$93,253
Cap Rate
5.53%
Suggested Prices Based on Cap Rates
Cap Rate 5%
$1,865,060
$1.9M
Cap Rate 7%
$1,332,186
$1.3M
Cap Rate 9%
$1,036,144
$1.0M
Market Conditions
NOI Build-Up for 6,236 SF
Gross rent
$139.9K $22.44/SF
− Vacancy
−$6.7K −$1.08/SF
EGI
$133.2K $21.36/SF
− OpEx
−$40.0K −$6.41/SF
NOI
$93.3K $14.95/SF
Area
Mercer County, NJ
Vacancy
4.80%
Lease Rate
$22.44 /SF/Yr
Expense Ratio
30.00%
Simulate Cap Rate and NOI
Suggested Prices Based on Cap Rates
Cap Rate 5%
$1,865,060
Cap Rate 7%
$1,332,186
Cap Rate 9%
$1,036,144
Alternative Uses
Best Use
Retail
$1.33M
$1.17M – $1.55M
NOI $93,253 @ 7.0% cap · market cap 5.53%
Second Best
Mixed Use
$1.18M
$1.03M – $1.37M
NOI $82,315 @ 7.0% cap · market cap 4.89%
Theoretical Best
Warehouse
$2.01M
$1.76M – $2.34M
NOI $140,445 @ 7.0% cap · market cap 8.34%
Zoning and permitted uses should be independently verified with authorities.
How Realmo checks its estimates
Property Analytics
Unlock full access to Insights
Subscribe to Realmo Intelligence
Open Analytics
Current Use
Lease Details
4
Office units
Multi-tenant
Tenancy
Location Intelligence
Trade Area within ½ mile
752
Businesses Nearby
Explore this area
Business Placement
Demographics for 08534, NJ
12,955
Population
5,107
Households
2.5
Avg Household Size
45
Median Age
72%
College-Educated
97%
High-School Grad
21.8 sq mi
ZIP Area
594
Density / Sq Mi
$180,491
Median Household Income
$94,154
Median Earnings
$2,106
Median Rent
$573,100
Median Home Value
Check the figures for this property
Cap Rate, Value Estimation, Potential NOI and more
View Realmo Analytics
Market
Vacancy Rate% for Office in Northeast region


Frequently Asked Questions
What type of property is this?
Mixed-use property - Street-level suites combine retail and office layouts, with upper floors occupied by a long-term architectural firm.
Where is this mixed-use property located?
The property is located at 24 N MAIN Street Pennington, NJ.
What is the asking price?
The asking price for this property is $1,685,000.
What are key features of this property?
This property features: 6,236 SF mixed‑use building at 24 N Main Street, Pennington, NJ; 2,968 SF handicap‑accessible first floor with three street‑level suites; 1,207 SF retail suite available for office or retail use



