Industrial Flex Facility for
For Sale
Contact for pricing
2333 Eric Ln, Burlington, NC 27215
A 1962-built, climate-controlled industrial flex facility zoned Light Industrial and fully leased.
Property Size146,905 SF
Price / SF$81.69
Days on Market203
Property Features for 2333 Eric Ln
General Information
Standard status
Active
Size
146,905 SF
Class
C
Total Parking Spaces
684
Property subtype
Industrial
Zoning
LI - Light Industrial
Occupancy
100%
Lease Type
NN
Investment Type
Net Lease
Net Operating Income
$935,550
Additional Details
Business Included
Yes
Highway Access
Yes
Building Details
Year Built
1962
Tenancy
Single
Listing Agency:
Vakos Real Estate Services
Listed By:
Chandler Cox · License #0225272902
(540) 847-9449
Source:
Crexi
Added: Apr 1
Changed: Oct 10
Last Checked: Oct 19 at 6:35AM
Displayed information is deemed reliable but is not guaranteed and should be independently verified. All listing content including descriptions, pricing, images are the copyrighted material of Vakos Real Estate Services

Ask AI about this property
Review the available facts, identify missing information and prepare questions for the agent.
Investment Insights
Based on property information with market context.
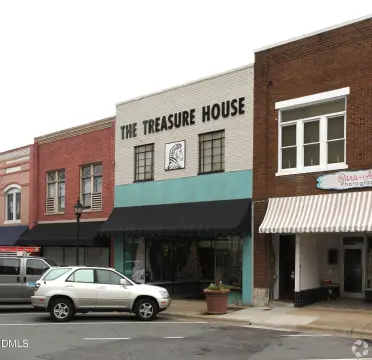
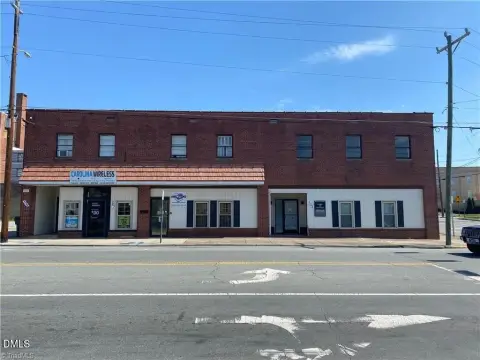
This for-sale industrial flex facility was originally constructed in 1962 and has been adapted to support modern operations. The property includes a substantial climate-controlled warehouse component designed for storage and distribution functions, along with retail components integrated into the overall layout. The asset is fully leased with 100% occupancy.
Zoned Light Industrial (LI), the facility is positioned in Burlington, North Carolina, within an active industrial corridor. It is described as being near major transportation routes and designed to support logistics-driven use.
For investors and operators seeking a functional hybrid industrial asset, the property offers in-place tenancy and a configuration that combines climate-controlled warehousing with operational flexibility.
Zoned Light Industrial (LI), the facility is positioned in Burlington, North Carolina, within an active industrial corridor. It is described as being near major transportation routes and designed to support logistics-driven use.
For investors and operators seeking a functional hybrid industrial asset, the property offers in-place tenancy and a configuration that combines climate-controlled warehousing with operational flexibility.
Key Highlights
- 146,905 SF mission‑critical industrial flex facility in Burlington, NC
- Fully leased with 100% occupancy and a tenant using the property as an operational facility
- Originally built in 1962 and adapted for modern operational demands
Financial Insights
Estimated NOI and Cap Rate
NOI / Yr
$578,274
Cap Rate
4.82%
Suggested Prices Based on Cap Rates
Cap Rate 5%
$11,565,480
$11.6M
Cap Rate 7%
$8,261,057
$8.3M
Cap Rate 9%
$6,425,267
$6.4M
Market Conditions
NOI Build-Up for 146,905 SF
Gross rent
$910.8K $6.20/SF
− Vacancy
−$84.7K −$0.58/SF
EGI
$826.1K $5.62/SF
− OpEx
−$247.8K −$1.69/SF
NOI
$578.3K $3.94/SF
Area
Alamance County, NC
Vacancy
9.30%
Lease Rate
$6.20 /SF/Yr
Expense Ratio
30.00%
Simulate Cap Rate and NOI
Suggested Prices Based on Cap Rates
Cap Rate 5%
$11,565,480
Cap Rate 7%
$8,261,057
Cap Rate 9%
$6,425,267
Alternative Uses
Best Use
Warehouse
$16.57M
$14.50M – $19.33M
NOI $1,159,781 @ 7.0% cap · market cap 9.66%
Second Best
Flex RnD
$16.18M
$14.16M – $18.88M
NOI $1,132,831 @ 7.0% cap · market cap 9.44%
Theoretical Best
Office A
$48.43M
$42.38M – $56.51M
NOI $3,390,386 @ 7.0% cap · market cap 28.25%
Zoning and permitted uses should be independently verified with authorities.
How Realmo checks its estimates
Property Analytics
Unlock full access to Insights
Subscribe to Realmo Intelligence
Open Analytics
Current Use
Lease Details
Turnkey business
Opportunity
Yes
Highway access
Location Intelligence
Trade Area within ½ mile
292
Businesses Nearby
Under-served
Demand for This Use
Explore this area
Business Placement
Demographics for 27215, NC
44,620
Population
21,854
Households
2
Avg Household Size
42
Median Age
37%
College-Educated
92%
High-School Grad
63.1 sq mi
ZIP Area
707
Density / Sq Mi
$66,669
Median Household Income
$45,267
Median Earnings
$1,112
Median Rent
$241,700
Median Home Value
Check the figures for this property
Cap Rate, Value Estimation, Potential NOI and more
View Realmo Analytics
Market
Vacancy Rate% for Industrial in South region







Frequently Asked Questions
What type of property is this?
Flex space - A 1962-built, climate-controlled industrial flex facility zoned Light Industrial and fully leased.
Where is this flex space located?
The property is located at 2333 Eric Ln Burlington, NC.
What is the asking price?
The asking price for this property is $12,000,000.
What are key features of this property?
This property features: 146,905 SF mission‑critical industrial flex facility in Burlington, NC; Fully leased with 100% occupancy and a tenant using the property as an operational facility; Originally built in 1962 and adapted for modern operational demands


