Renovated Duplex with Outdoor
For Sale
$750,000
233 Sheridan Ave, Seaside Heights, NJ 08751
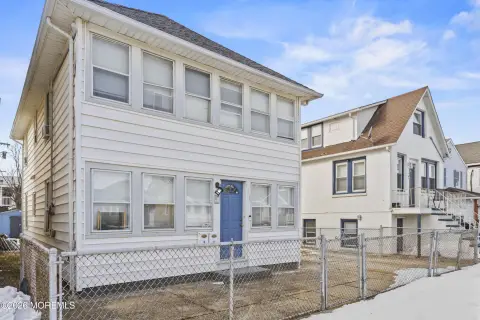
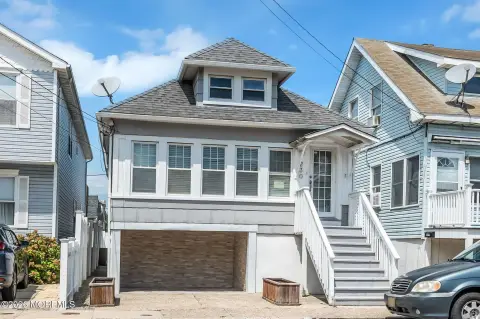
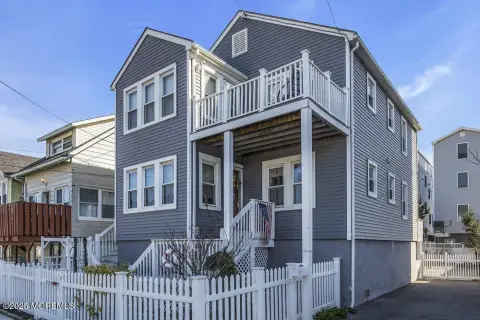
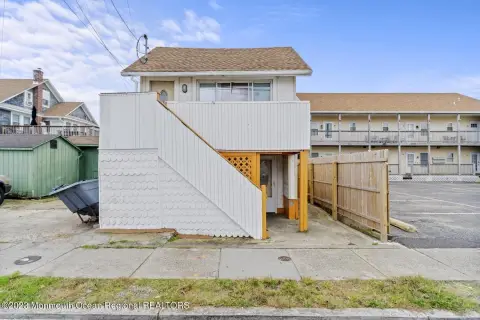
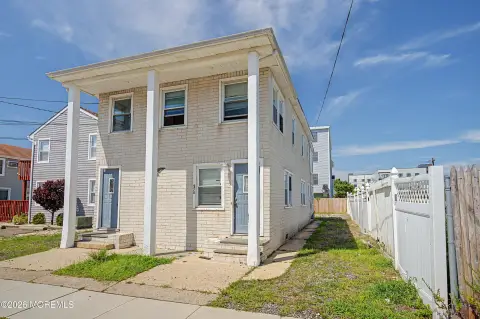
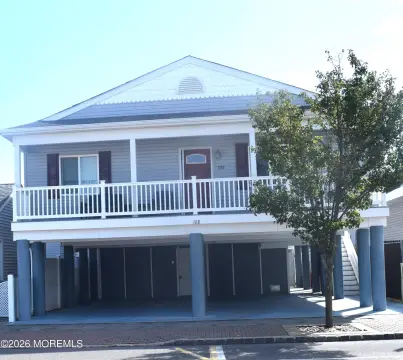
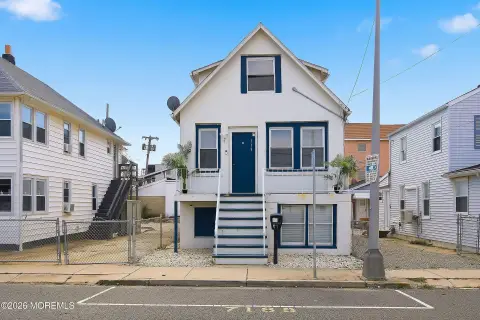
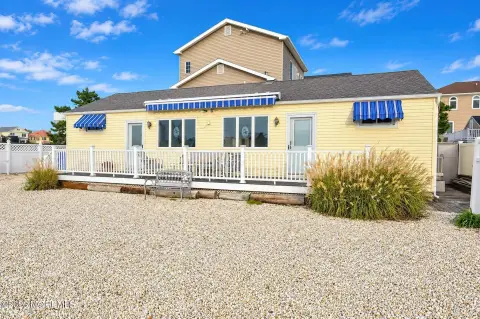
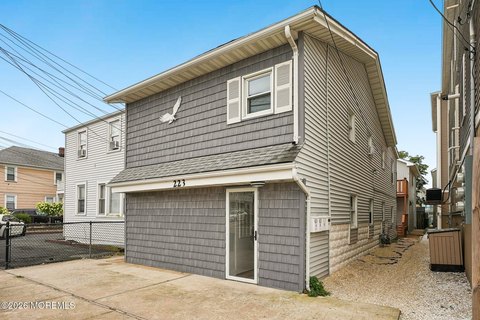
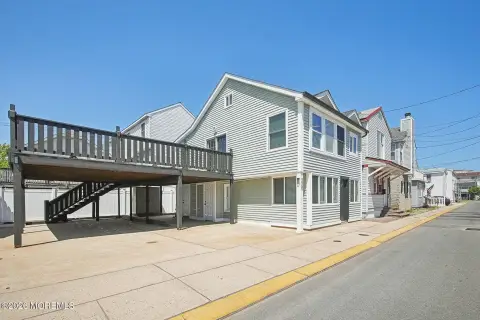
Two furnished units feature updated kitchens, designer finishes, and access to a landscaped backyard with deck and outdoor shower.
Property Size1,428 SF
Price / SF$525.21
Days on Market57
Property Features for 233 Sheridan Ave
General Information
Standard status
Active
Size
1,428 SF
Property subtype
Multi-Family
Financials
Cap Rate
11%
Business Included
Yes
Additional Details
Furnished
Yes
Multifamily Units
2
Amenities
backyard
deck
outdoor shower
off-street parking
security camera systems
Building Details
Year Built
1940
Buildings
1
Listing Agency:
RE/MAX Revolution
Listed By:
Kyle T Marcell · License #1540795
(908) 278-8825
Source:
Mynewjerseyrealestate
Added: Aug 19
Changed: Oct 12
Last Checked: Oct 7 at 2:55PM
Displayed information is deemed reliable but is not guaranteed and should be independently verified. All listing content including descriptions, pricing, images are the copyrighted material of RE/MAX Revolution
Investment Insights
Based on property information with market context.
This 1,428-square-foot duplex, built in 1940, contains two renovated units with coordinated coastal interiors, custom feature walls, white oak-style flooring, granite countertops, stainless steel appliances, and gold-accented fixtures. The property is offered furnished and includes a backyard with low-maintenance turf, a deck, an outdoor shower, and off-street parking.
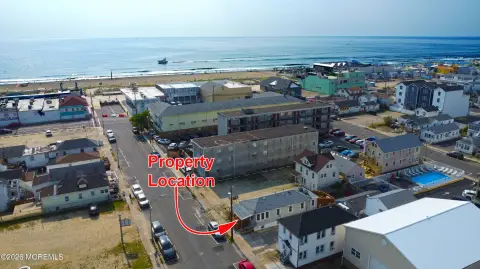
Located at 233 Sheridan Ave in Seaside Heights, the property sits two blocks from the beach and boardwalk. It is currently operated as a short-term rental business, with established Airbnb and VRBO Superhost accounts, security camera systems, and repeat clientele. The source information reports an 11% cap rate.
Located at 233 Sheridan Ave in Seaside Heights, the property sits two blocks from the beach and boardwalk. It is currently operated as a short-term rental business, with established Airbnb and VRBO Superhost accounts, security camera systems, and repeat clientele. The source information reports an 11% cap rate.
Key Highlights
- 1,428 SF duplex with two renovated units; built in 1940
- Two blocks from the Seaside Heights beach and boardwalk
- Furnished units with granite countertops and stainless steel appliances
Financial Insights
Estimated NOI and Cap Rate
NOI / Yr
$23,899
Cap Rate
3.19%
Suggested Prices Based on Cap Rates
Cap Rate 5%
$477,980
$478.0K
Cap Rate 7%
$341,414
$341.4K
Cap Rate 9%
$265,544
$265.5K
Market Conditions
NOI Build-Up for 1,428 SF
Gross rent
$36.5K $25.56/SF
− Vacancy
−$2.4K −$1.65/SF
EGI
$34.1K $23.91/SF
− OpEx
−$10.2K −$7.17/SF
NOI
$23.9K $16.74/SF
Area
Ocean County, NJ
Vacancy
6.46%
Lease Rate
$25.56 /SF/Yr
Expense Ratio
30.00%
Simulate Cap Rate and NOI
Suggested Prices Based on Cap Rates
Cap Rate 5%
$477,980
Cap Rate 7%
$341,414
Cap Rate 9%
$265,544
Alternative Uses
Best Use
Multifamily LT 5
$341.4K
$298.7K – $398.3K
NOI $23,899 @ 7.0% cap · market cap 3.19%
Second Best
Apartment 5plus
$313.7K
$274.5K – $366.0K
NOI $21,960 @ 7.0% cap · market cap 2.93%
Theoretical Best
Office A
$372.9K
$326.3K – $435.0K
NOI $26,102 @ 7.0% cap · market cap 3.48%
Zoning and permitted uses should be independently verified with authorities.
How Realmo checks its estimates
Property Analytics
Unlock full access to Insights
Subscribe to Realmo Intelligence
Open Analytics
Current Use
Lease Details
2
Residential units
Turnkey business
Opportunity
Location Intelligence
Trade Area within ½ mile
636
Businesses Nearby
Explore this area
Business Placement
Demographics for 08751, NJ
3,867
Population
5,319
Households
0.7
Avg Household Size
48
Median Age
39%
College-Educated
90%
High-School Grad
1.3 sq mi
ZIP Area
2,975
Density / Sq Mi
$75,000
Median Household Income
$52,273
Median Earnings
$1,437
Median Rent
$583,000
Median Home Value
Check the figures for this property
Cap Rate, Value Estimation, Potential NOI and more
View Realmo Analytics
Market
Vacancy Rate% for Multifamily in Northeast region

Questions? Ask Rey
Realmo’s AI knows this listing — price, zoning, demand, history. Ask anything.

Frequently Asked Questions
What type of property is this?
Duplex - Two furnished units feature updated kitchens, designer finishes, and access to a landscaped backyard with deck and outdoor shower.
Where is this duplex located?
The property is located at 233 Sheridan Ave Seaside Heights, NJ.
What is the asking price?
The asking price for this property is $750,000.
What are key features of this property?
This property features: 1,428 SF duplex with two renovated units; built in 1940; Two blocks from the Seaside Heights beach and boardwalk; Furnished units with granite countertops and stainless steel appliances


