Mixed-Use Property with Retail
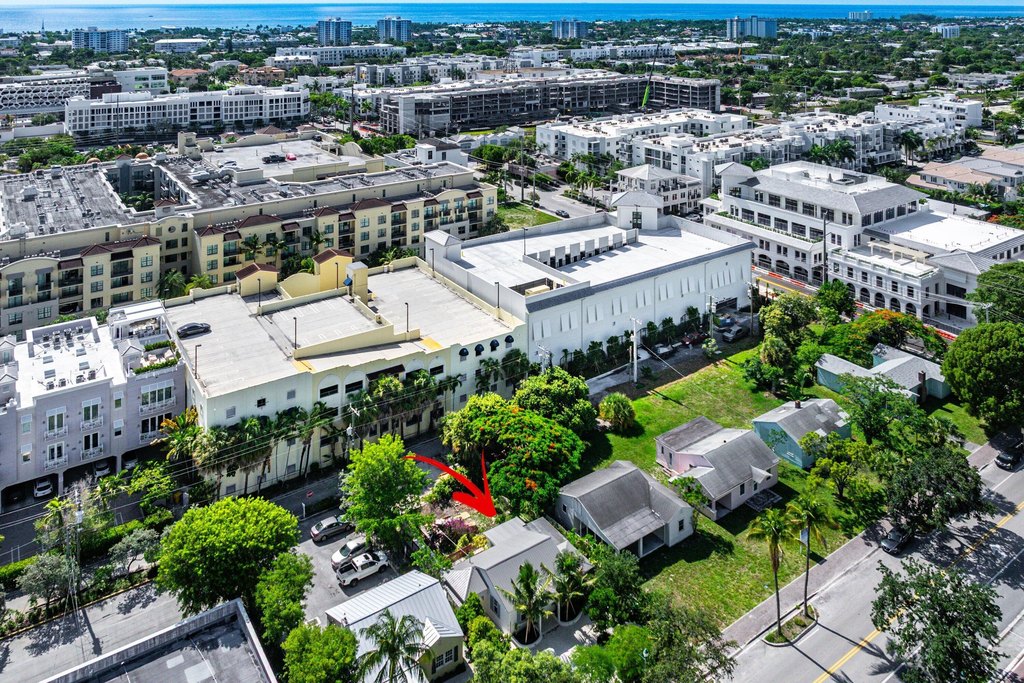
For Sale
$3,500,000
23 S Swinton Avenue, Delray Beach, FL 33444
Commercial Sale, Delray Beach, FL
Property Size3,296 SF
Lot Size0.15 Acres
Price / SF$1,061
Days on Market320
Property Features for 23 S Swinton Avenue
General Information
Property type
Residential
Property subtype
Retail
Zoning
OSSHAD
Bathrooms
1
Full bathrooms
1
Rooms
Bathroom 1
Directions
East Atlantic Ave go South on Swinton Ave
Subdivision
4370
Standard status
Active
APN
12434616010690100
Size
3,296 SF
Lot size
0.15 Acres
Taxes and HOA fees
Tax Year
2025
Tax Description
TOWN OF DELRAY LT 10 BLK 69 (OLD SCHOOL SQUARE HISTORIC DISTRICT)
Tax Annual Amount
17762
Legal Description
TOWN OF DELRAY LT 10 BLK 69 (OLD SCHOOL SQUARE HISTORIC DISTRICT)
Utilities
Utilities
Cable Available
Sewer type
Public Sewer
Heating system
Central
Cooling system
Central Air
Water source
Public
Building Details
Year built
1937
Floors in Building
2
Number of units
1
Flooring type
Vinyl, Tile
Roof type
Metal
Listing Agency:
Sutter & Nugent LLC
(561) 249-7266
Listed By:
Kyle Retamar · License #3421319
(561) 400-6673
Added: Nov 21, 2025
Changed: Oct 2
Last Checked: Oct 7 at 1:06AM
MLS# R11142674
Copyright © 2026 BeachesMLS. All rights reserved. All information provided by the listing agent/broker is deemed reliable but is not guaranteed and should be independently verified.
Investment Insights
Based on property information with market context.
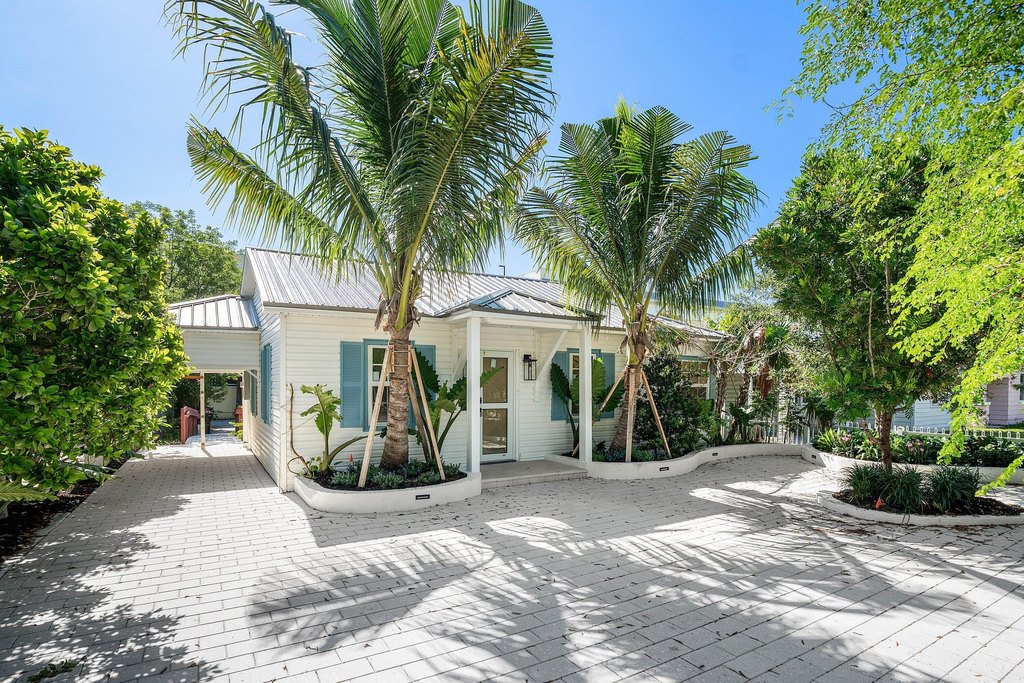
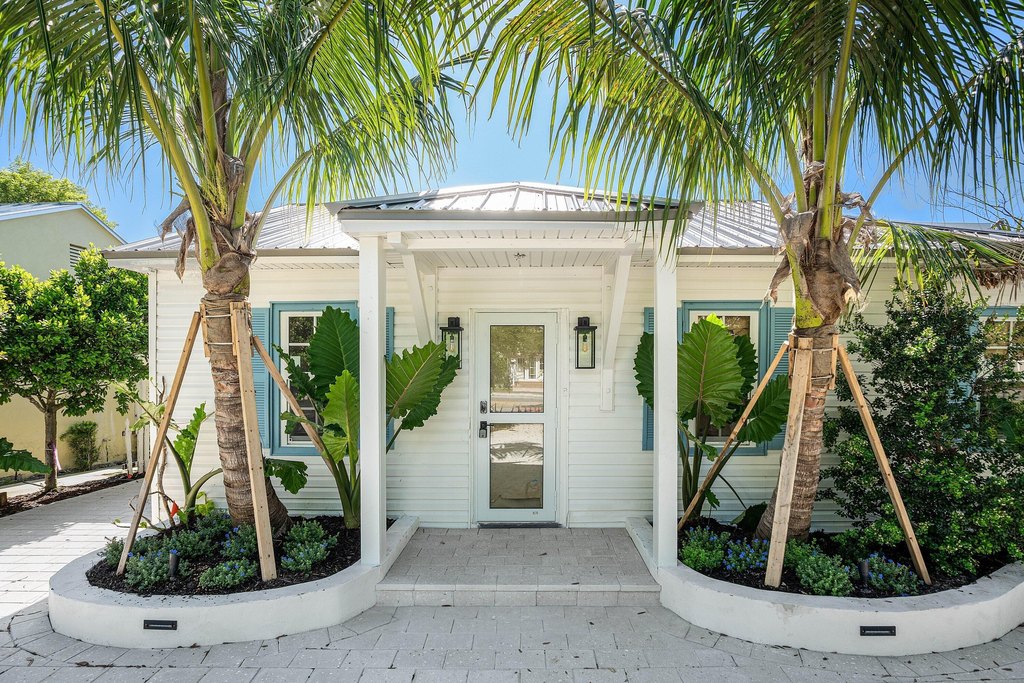
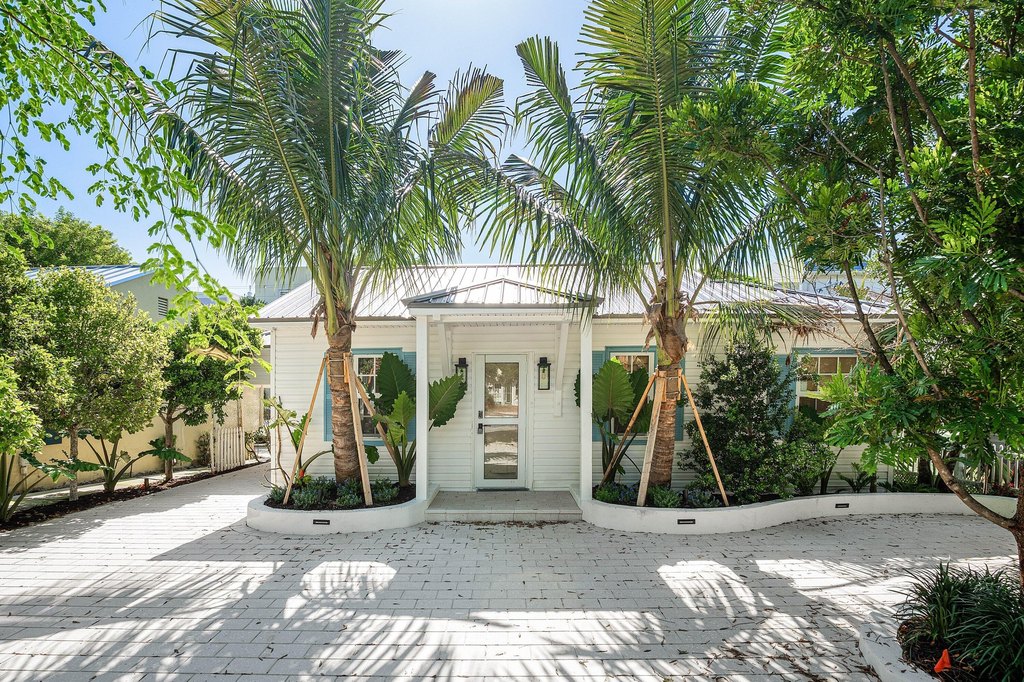
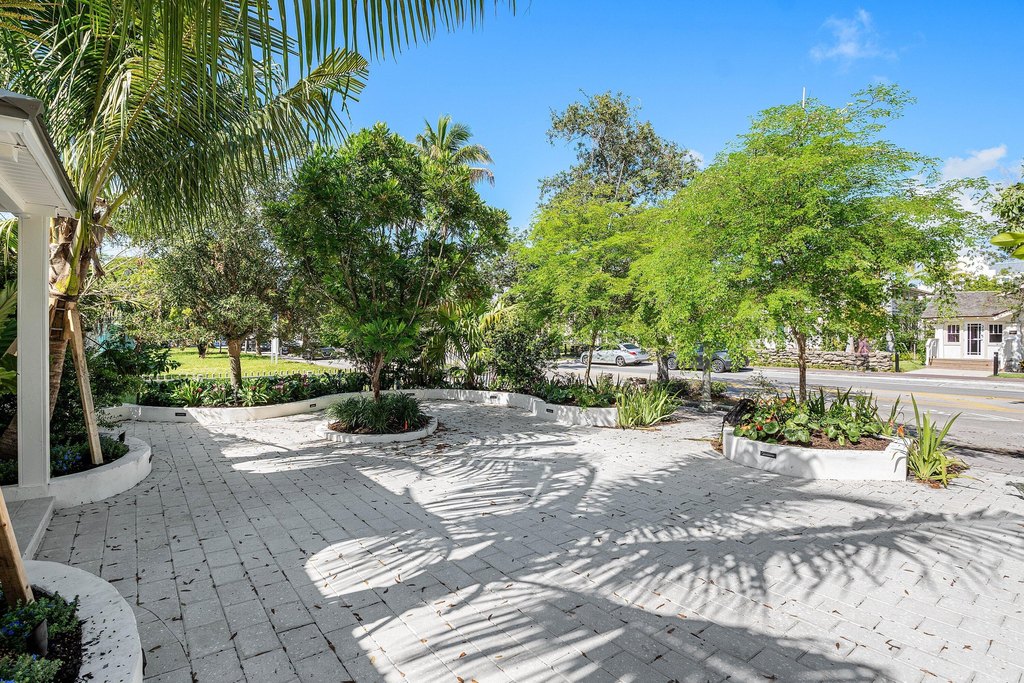
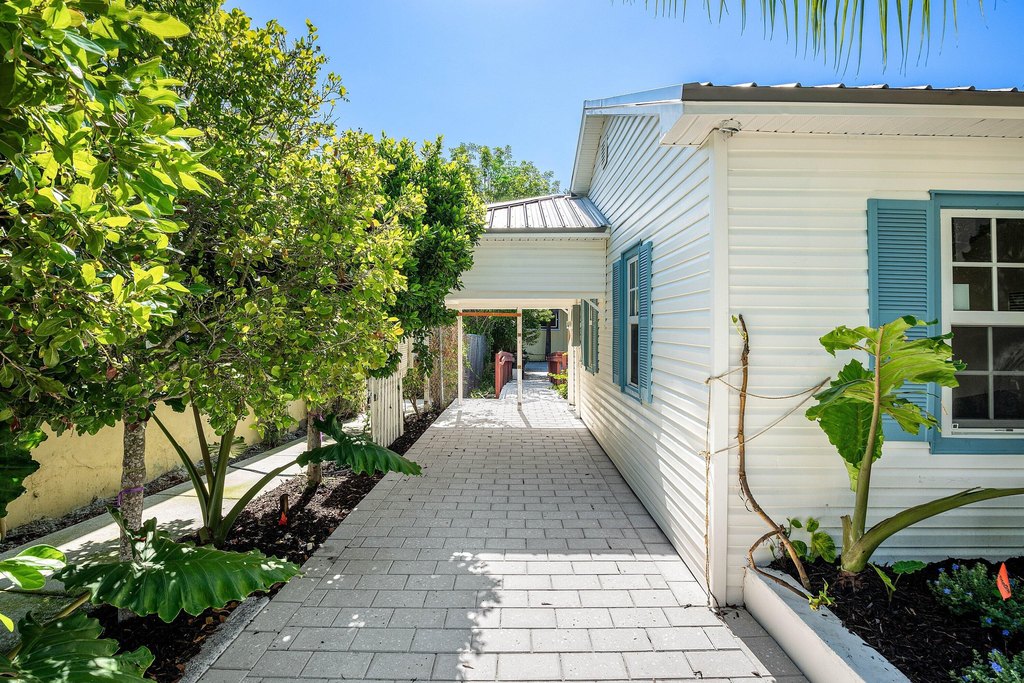
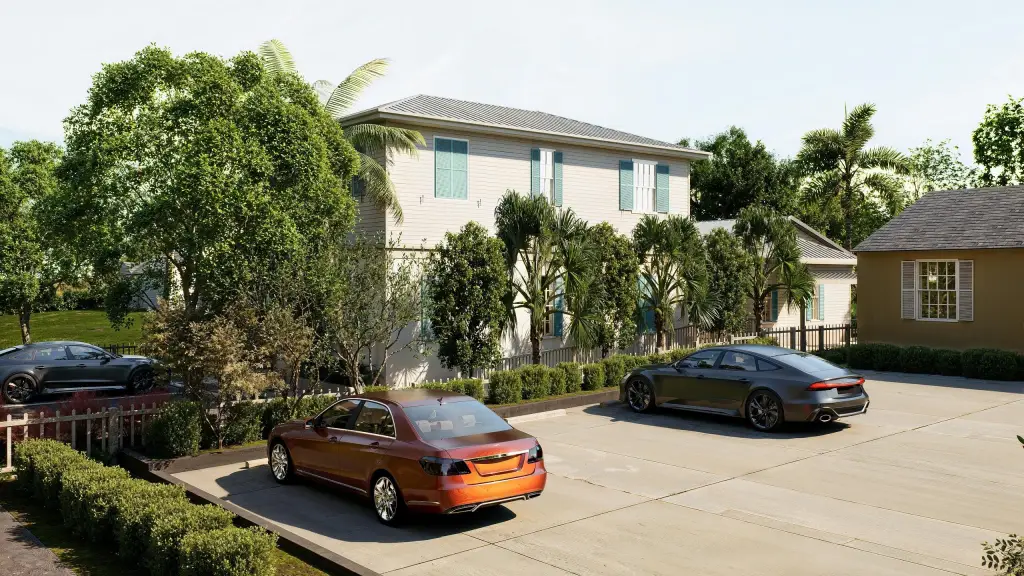
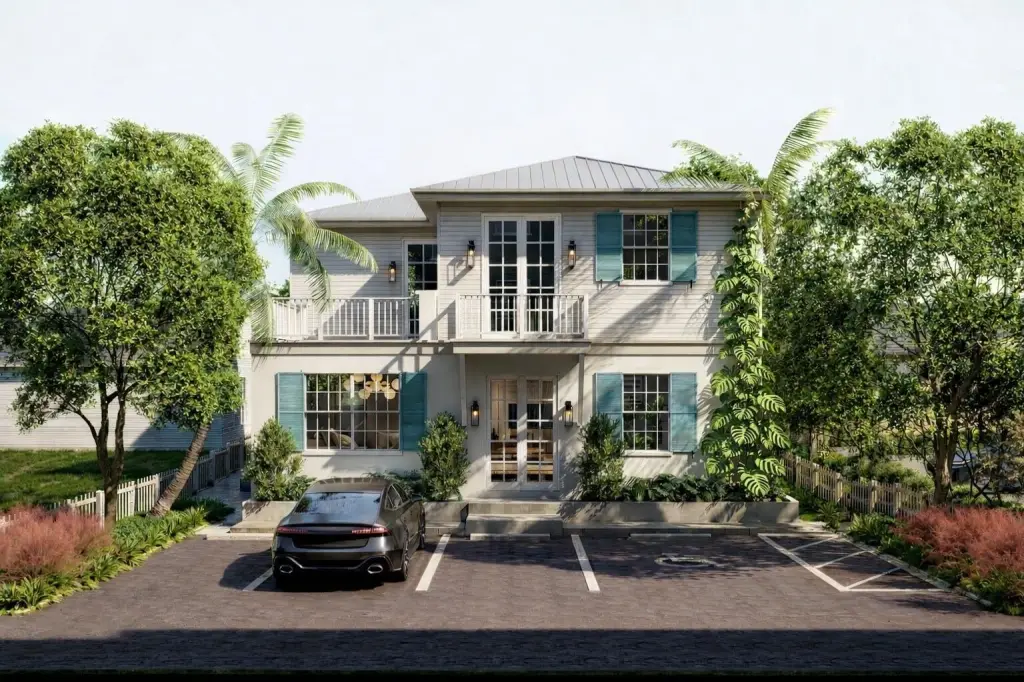
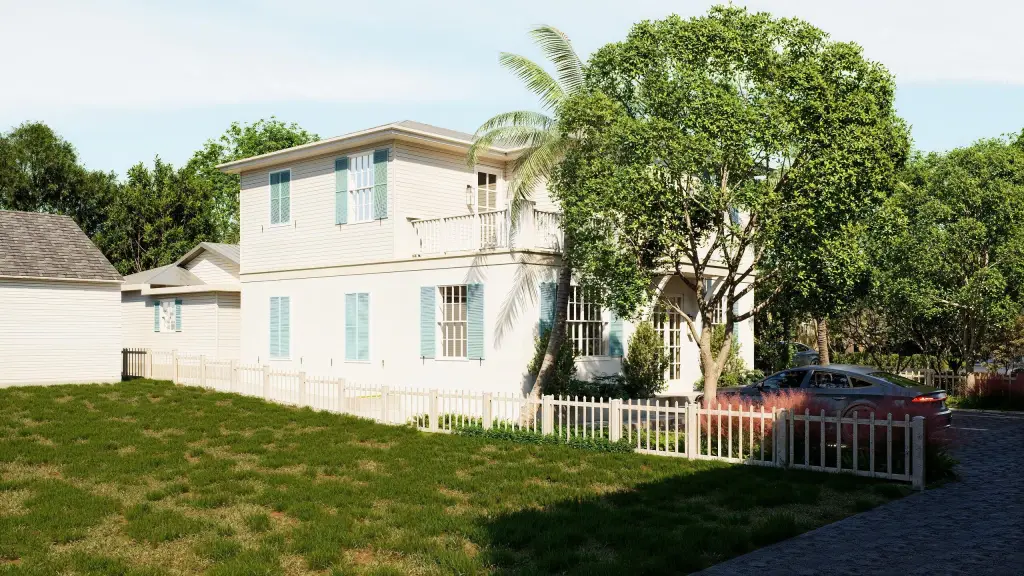
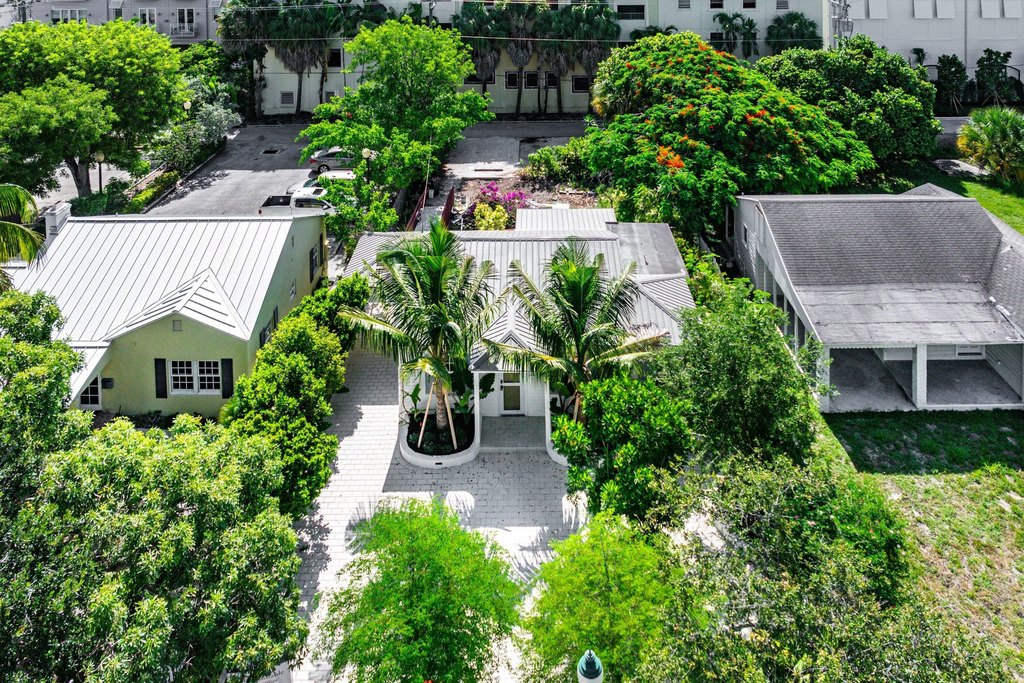
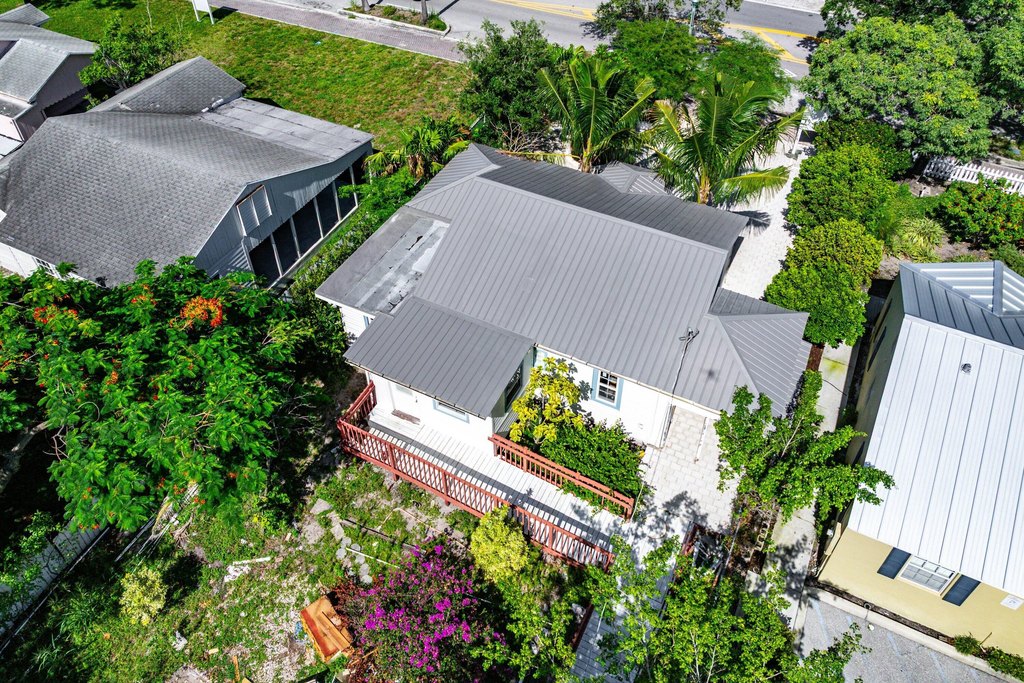
This mixed-use property at 23 S Swinton Avenue comprises 3,296 square feet on a 0.15-acre site. The existing structure is identified as a retail/office building, with tile and vinyl flooring, central heating and central air. The proposed plan includes just under 1,400 SF of retail/office space and 1,800 SF of residential space, with parking positioned behind the building.
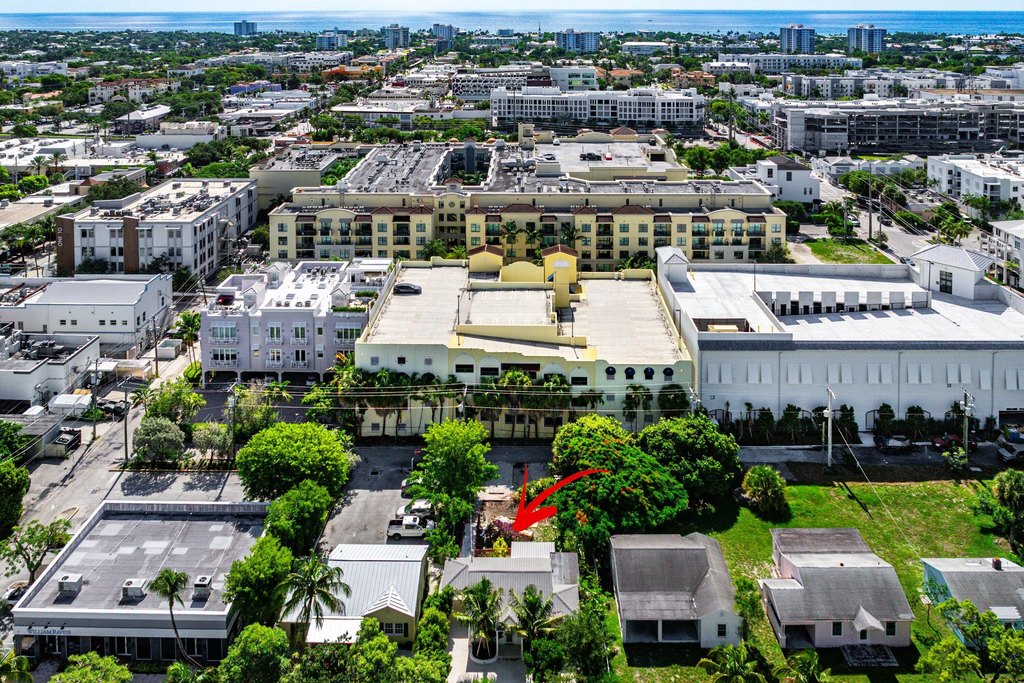
The property is across the street from Sundy Village in Delray Beach. It is currently progressing through approvals and permitting, with a proposed site plan and renderings available. OSSHAD zoning, public water, public sewer, cable availability, and a metal roof are also documented.
The property is across the street from Sundy Village in Delray Beach. It is currently progressing through approvals and permitting, with a proposed site plan and renderings available. OSSHAD zoning, public water, public sewer, cable availability, and a metal roof are also documented.
Key Highlights
- 3,296 square feet on a 0.15‑acre site
- Proposed plan includes just under 1,400 SF of retail/office and 1,800 SF of residential space
- Across the street from Sundy Village in Delray Beach
Property Analytics
Unlock full access to Insights
Subscribe to Realmo Intelligence
Open Analytics
Current Use
Location Intelligence
Trade Area within ½ mile
3,418
Businesses Nearby
133k
Monthly Visits Nearby
Explore this area
Business Placement
Foot Traffic Nearby
Dining 33%
Hotels & Casinos 32%
Shops & Services 22%
Apparel 11%
The Ray Hotel Delray Beach, Curio Collection by Hilton
Hotels & Casinos
23,390 visits/mo
0.3 miles
Starbucks
Dining
11,158 visits/mo
0.2 miles
Anthony's Coal Fired Pizza
Dining
9,998 visits/mo
0.4 miles
BankUnited
Shops & Services
9,864 visits/mo
0.3 miles
Sunoco
Shops & Services
9,718 visits/mo
0.5 miles
Demographics for 33444, FL
22,671
Population
10,469
Households
2.2
Avg Household Size
41
Median Age
33%
College-Educated
84%
High-School Grad
5.0 sq mi
ZIP Area
4,534
Density / Sq Mi
$74,803
Median Household Income
$37,915
Median Earnings
$1,712
Median Rent
$425,200
Median Home Value
Check the figures for this property
Cap Rate, Value Estimation, Potential NOI and more
View Realmo Analytics
Market
Vacancy Rate% for Retail in South region

Questions? Ask Rey
Realmo’s AI knows this listing — price, zoning, demand, history. Ask anything.

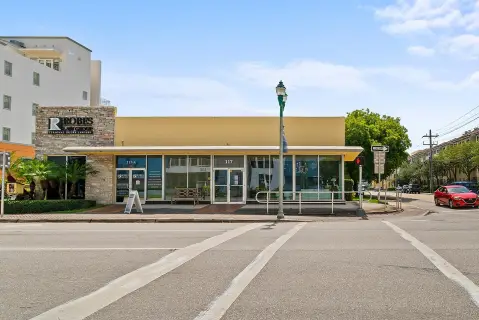


Frequently Asked Questions
What type of property is this?
Mixed-use property - Existing commercial structure with a proposed residential component, rear parking, and public water and sewer service.
Where is this mixed-use property located?
The property is located at 23 S Swinton Avenue Delray Beach, FL.
What is the asking price?
The asking price for this property is $3,500,000.
What are key features of this property?
This property features: 3,296 square feet on a 0.15‑acre site; Proposed plan includes just under 1,400 SF of retail/office and 1,800 SF of residential space; Across the street from Sundy Village in Delray Beach


