Historic Four-Level Mixed-Use
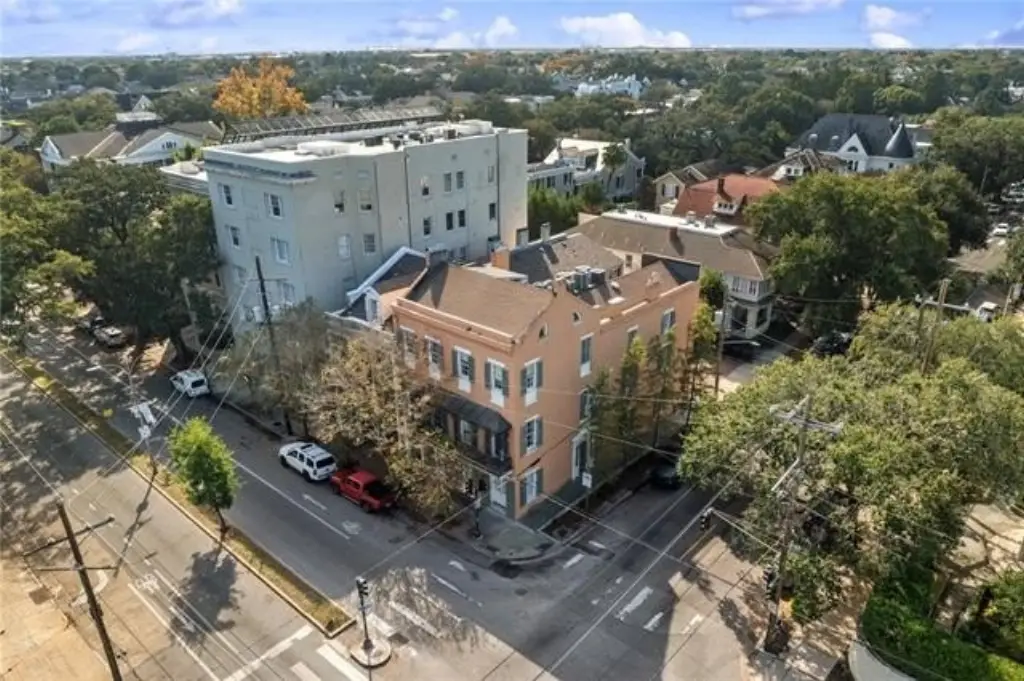
For Sale
$2,495,000
2200 PRYTANIA Street, New Orleans, LA 70130
Commercial, New Orleans, LA
Property Size6,728 SF
Price / SF$370.84
Days on Market324
Property Features for 2200 PRYTANIA Street
General Information
Property type
Commercial Sale
Property subtype
Other
Zoning
HU-RD1
Lot features
Corner
Subdivision
Garden District
Standard status
Active
APN
412102706
Size
6,728 SF
Taxes and HOA fees
Tax Description
SQ 202 PT LOT 13 PT LOT 14 JACKSON AND PRYTANIA 35 OVER 16 X 105 VAR 1452/56 JACKSON AV & 2200 PRYTANIA FILE #16704
Legal Description
SQ 202 PT LOT 13 PT LOT 14 JACKSON AND PRYTANIA 35 OVER 16 X 105 VAR 1452/56 JACKSON AV & 2200 PRYTANIA FILE #16704
Utilities
Water source
Public
Amenities
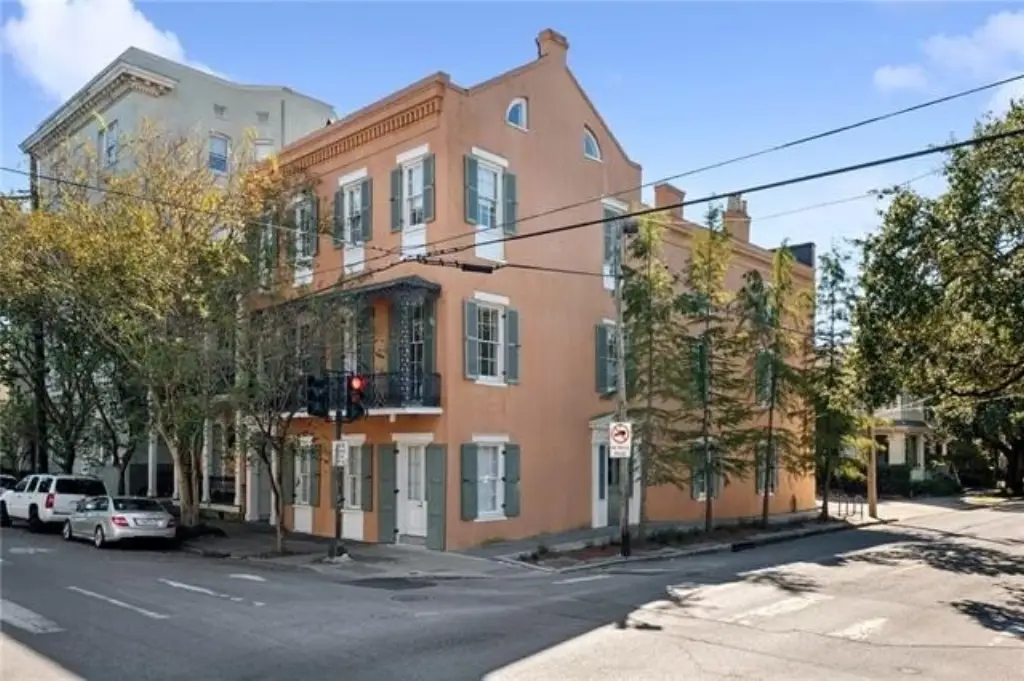
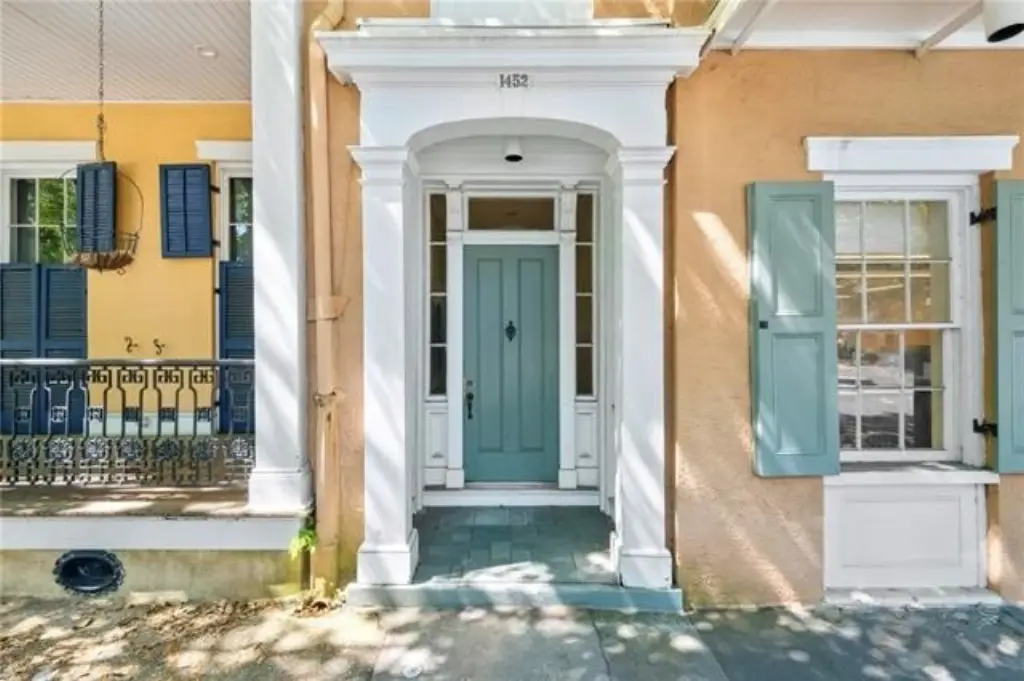
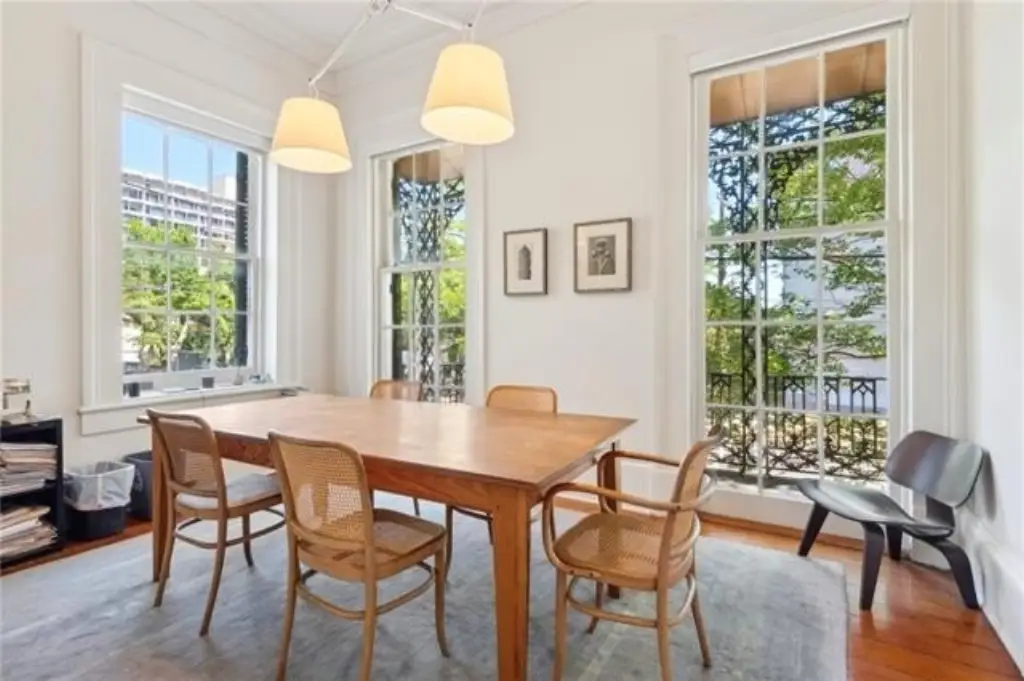
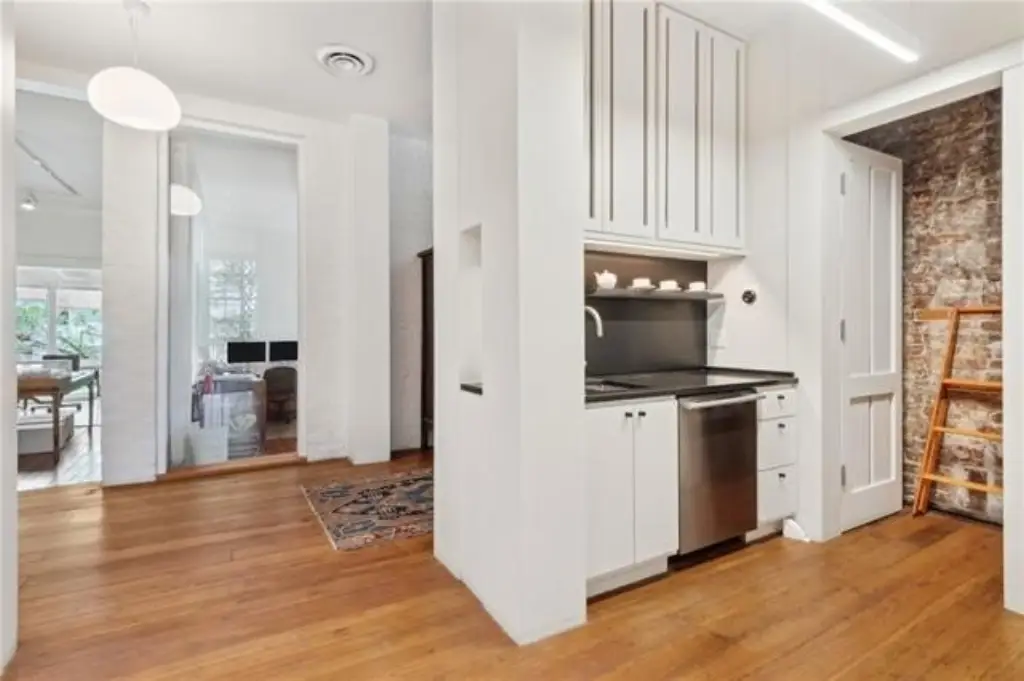
original wrought iron front balcony
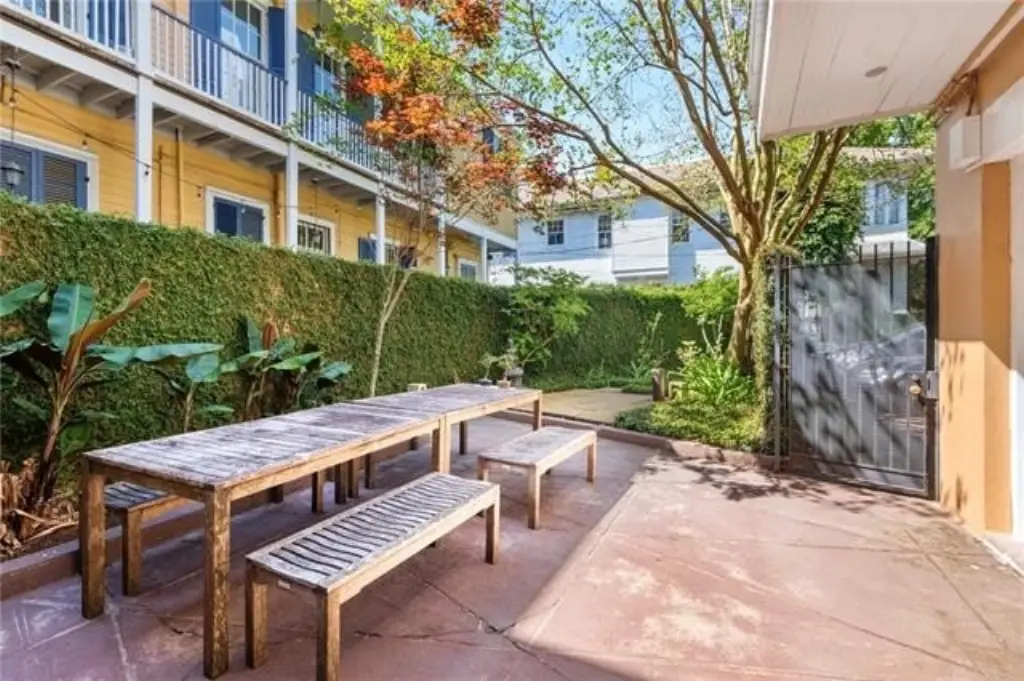
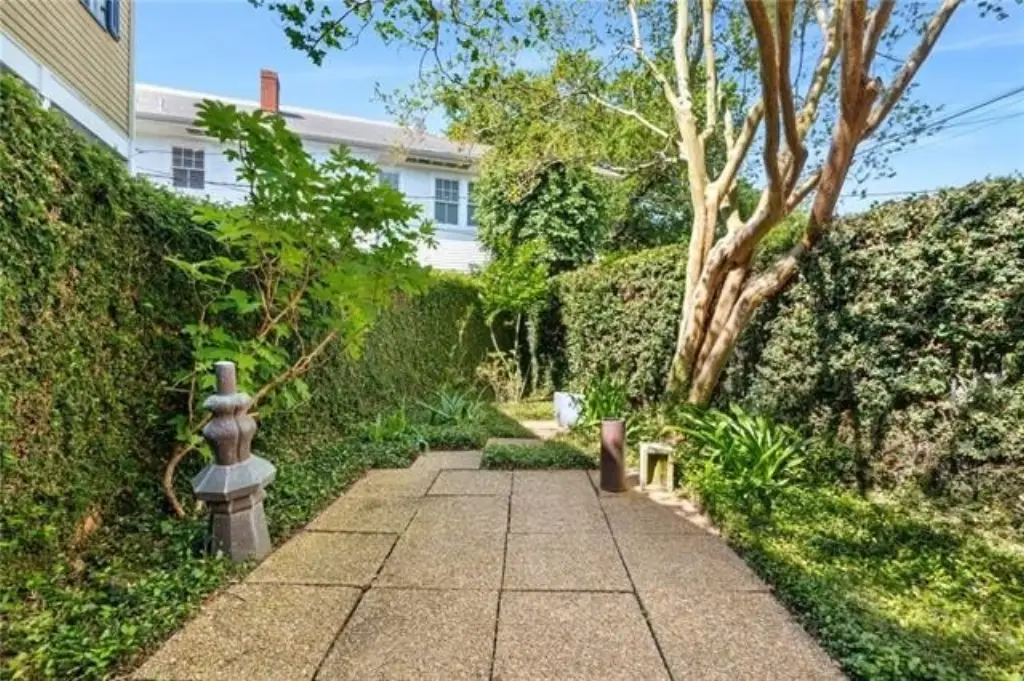
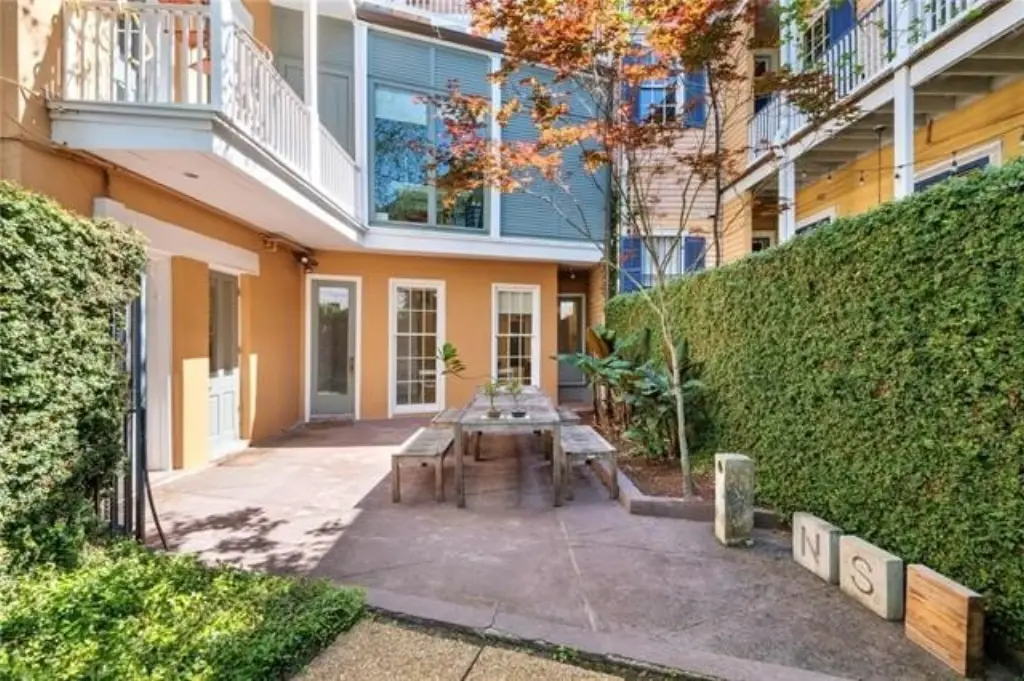
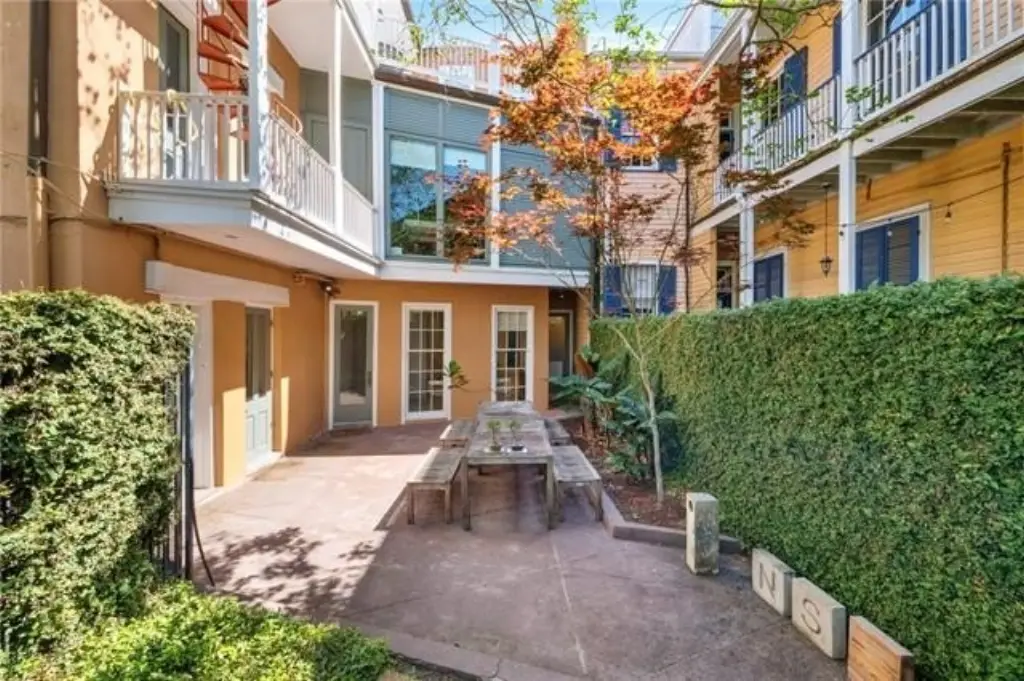
private courtyard
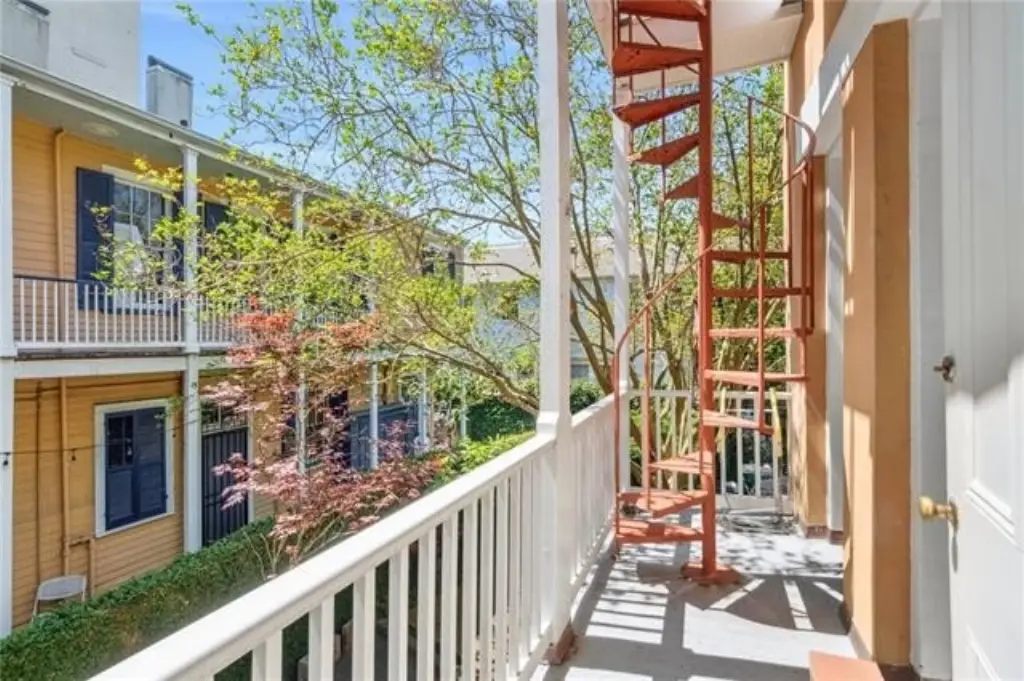
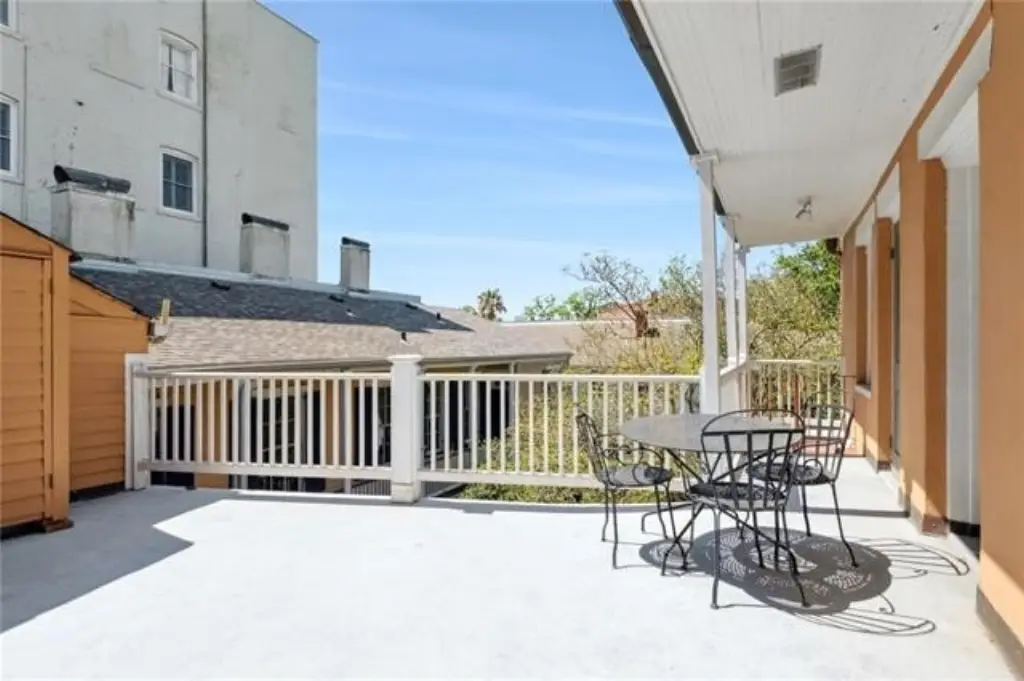
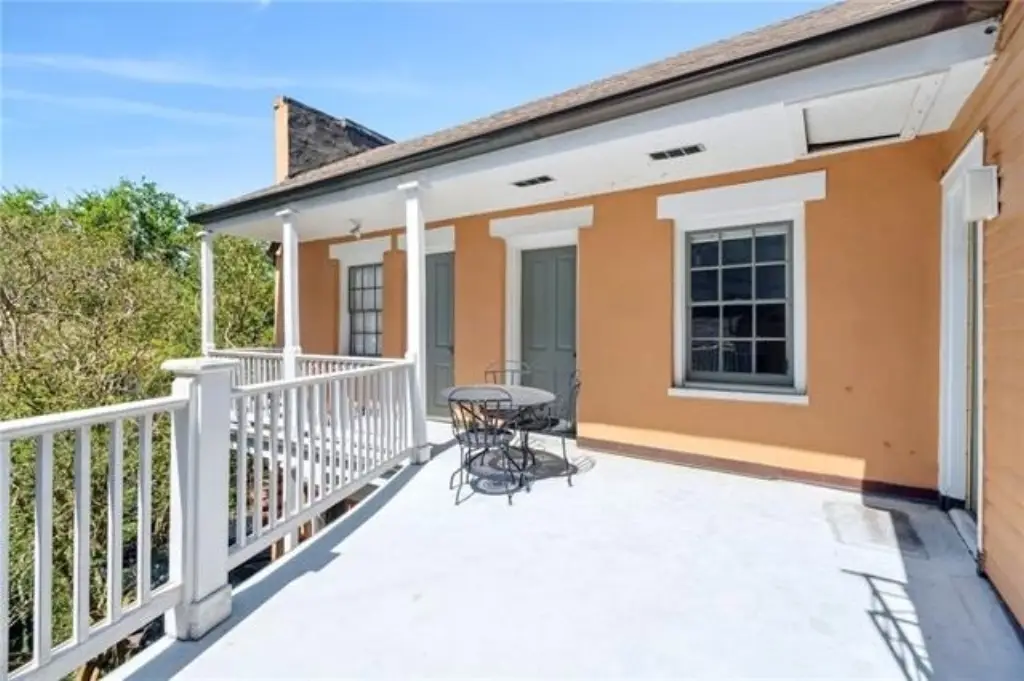
exterior galleries
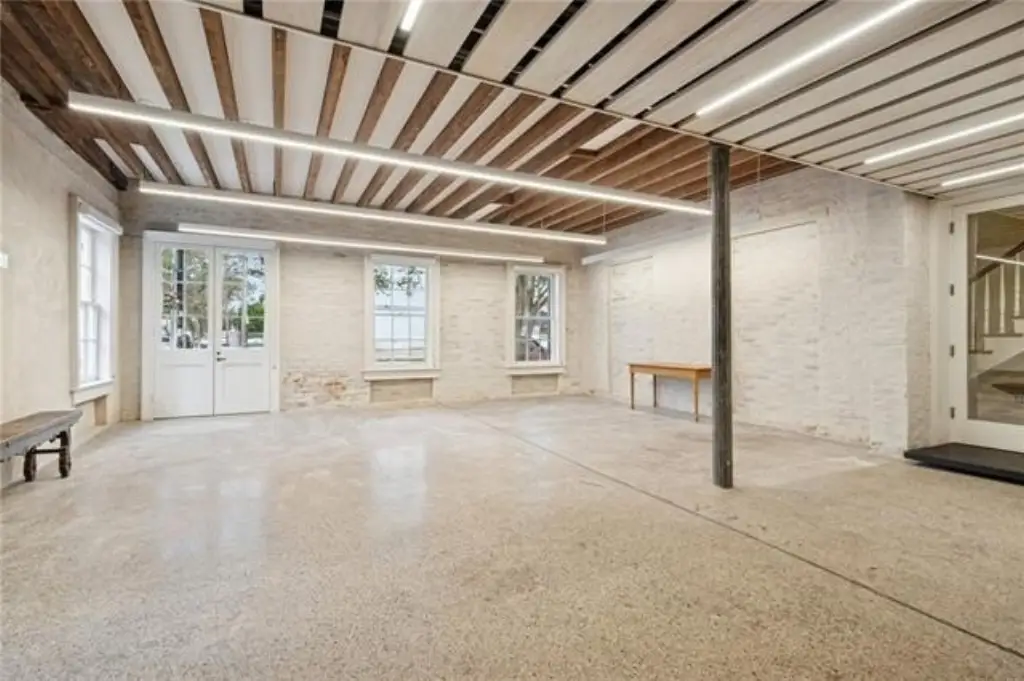
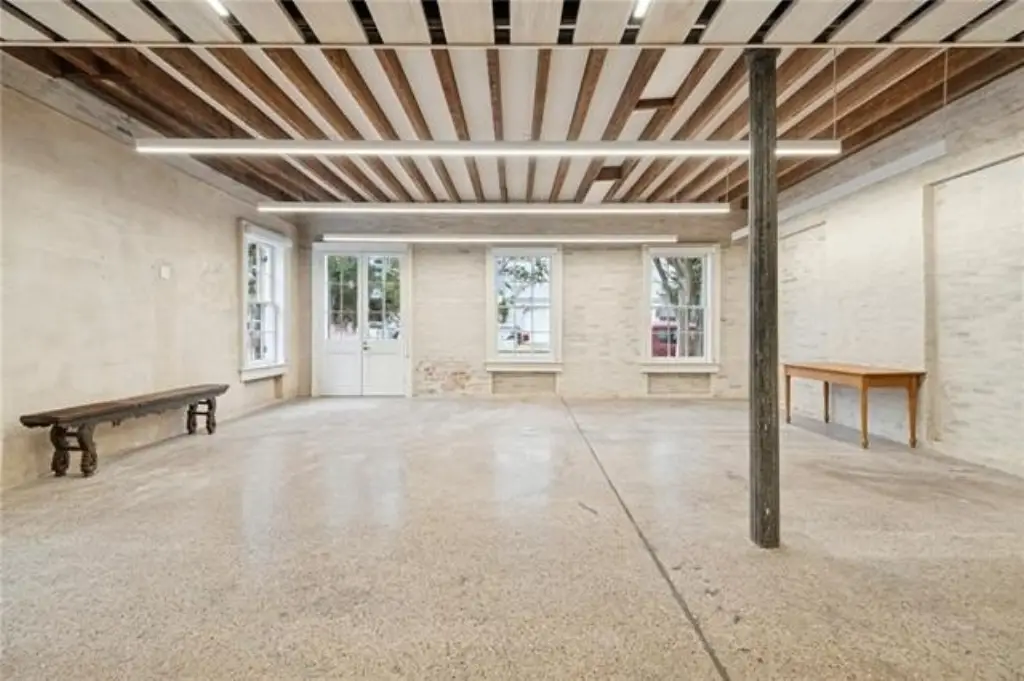
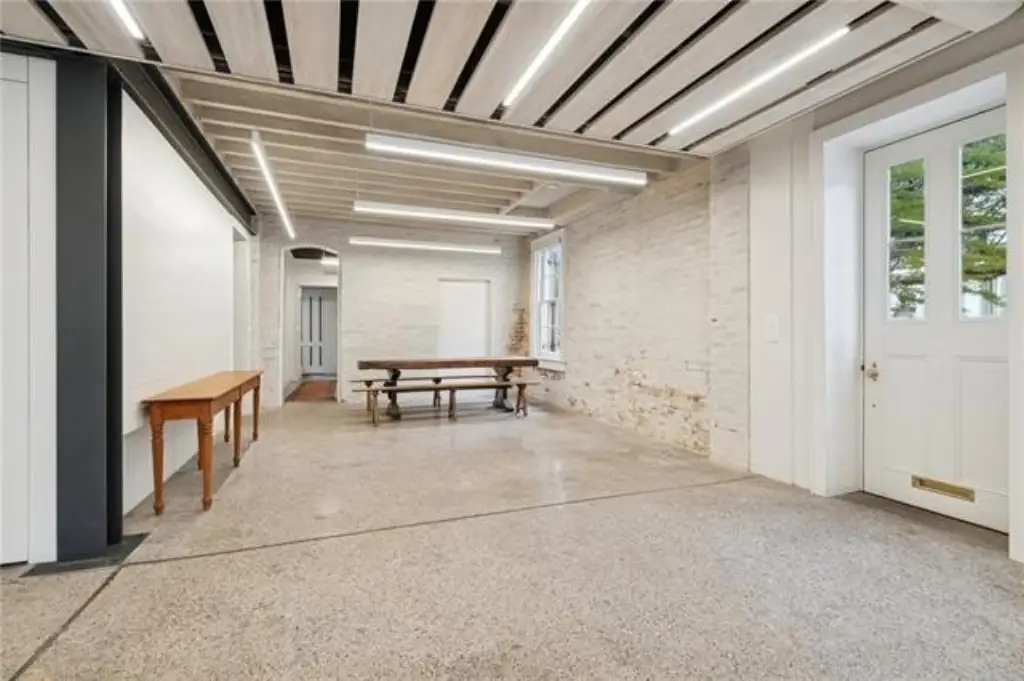
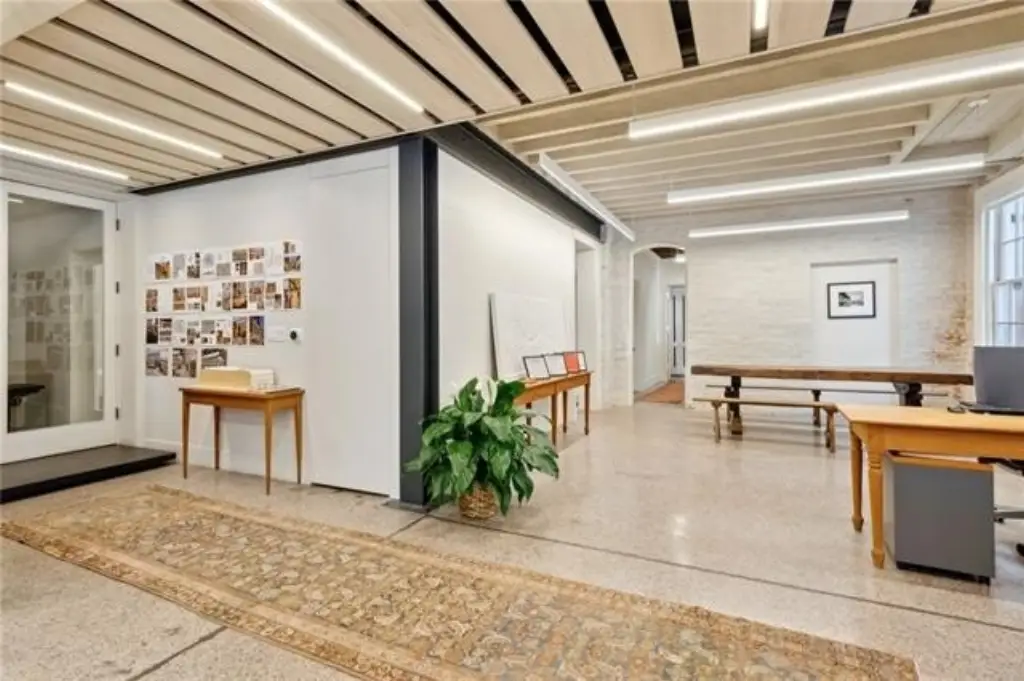
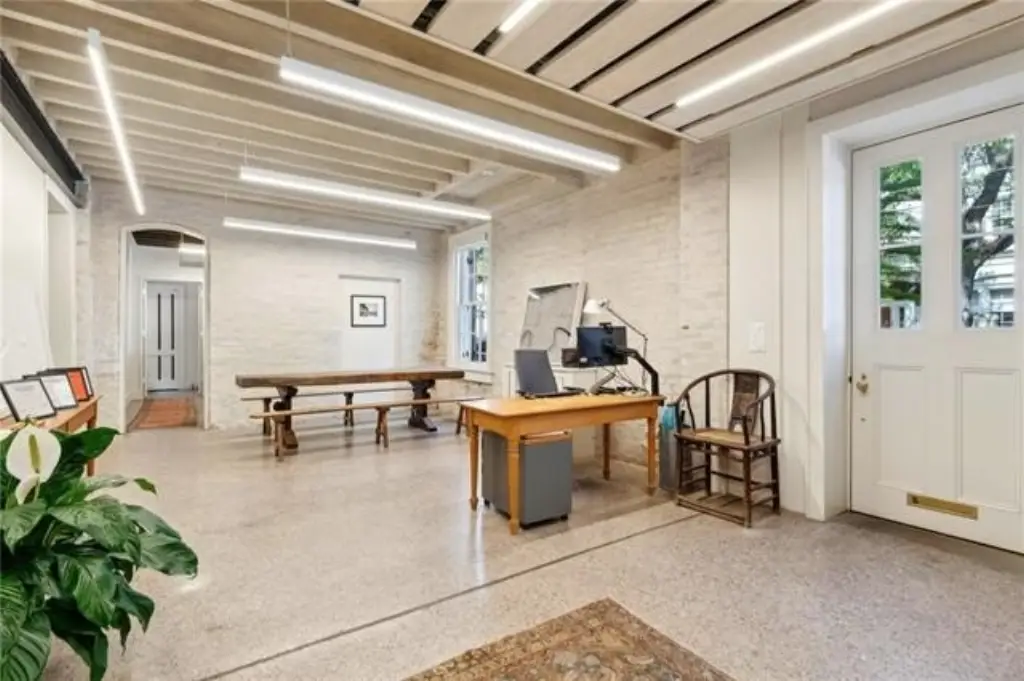
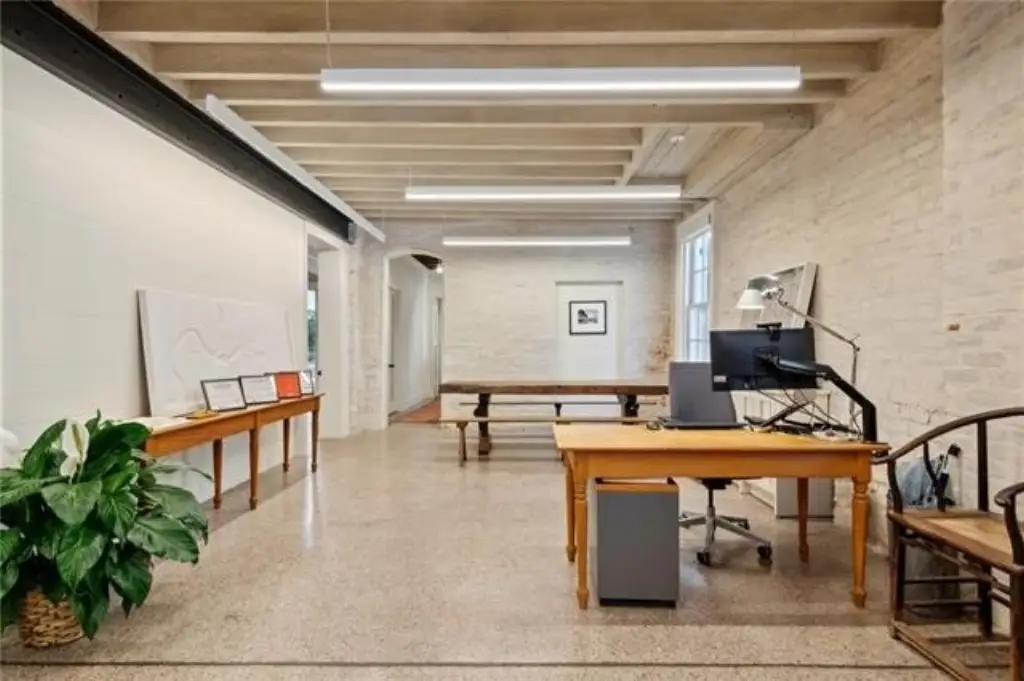
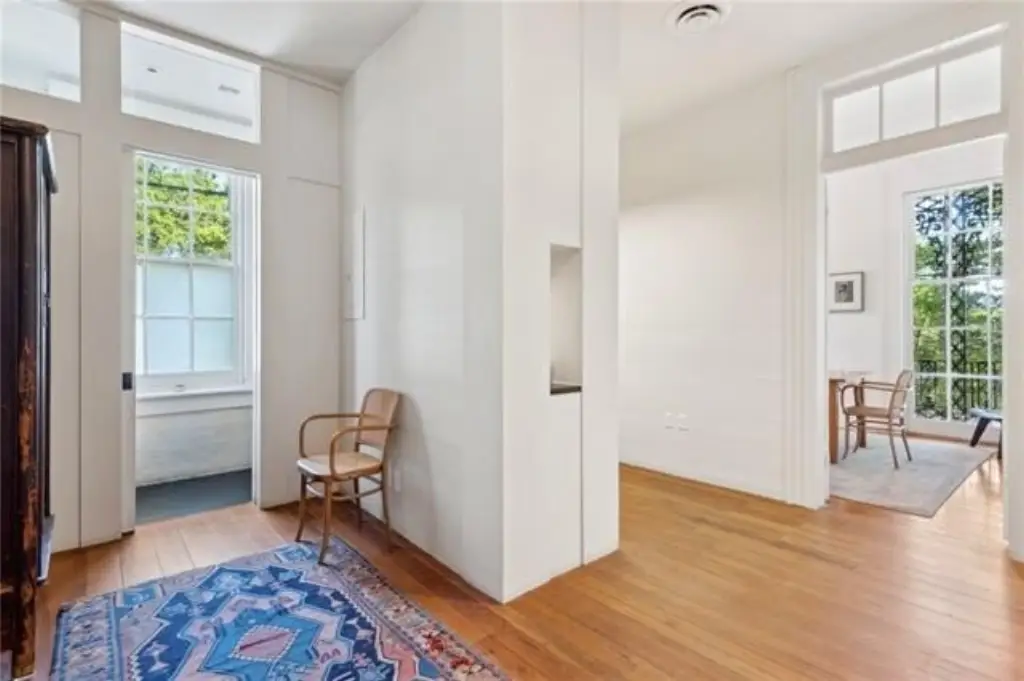
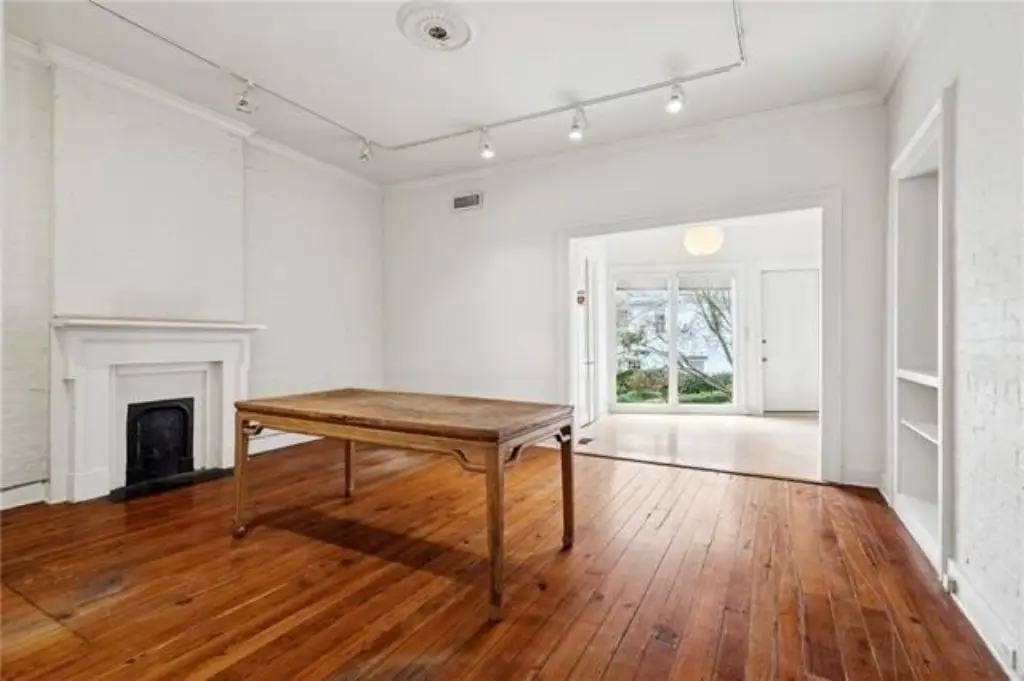
tall ceilings
marble fireplaces
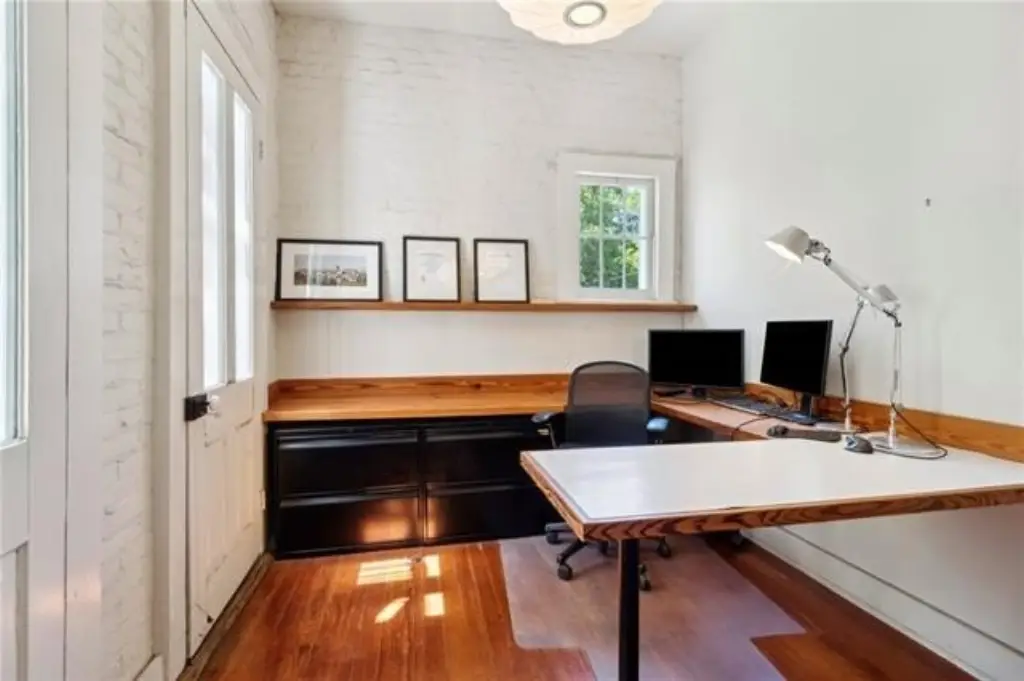
original wood floors and windows
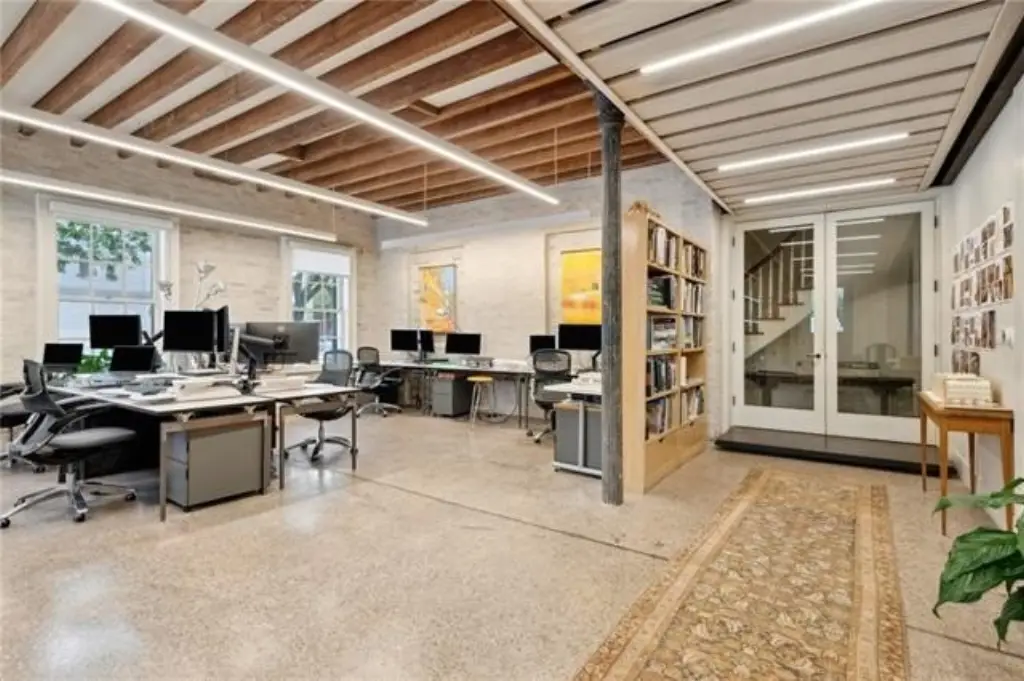
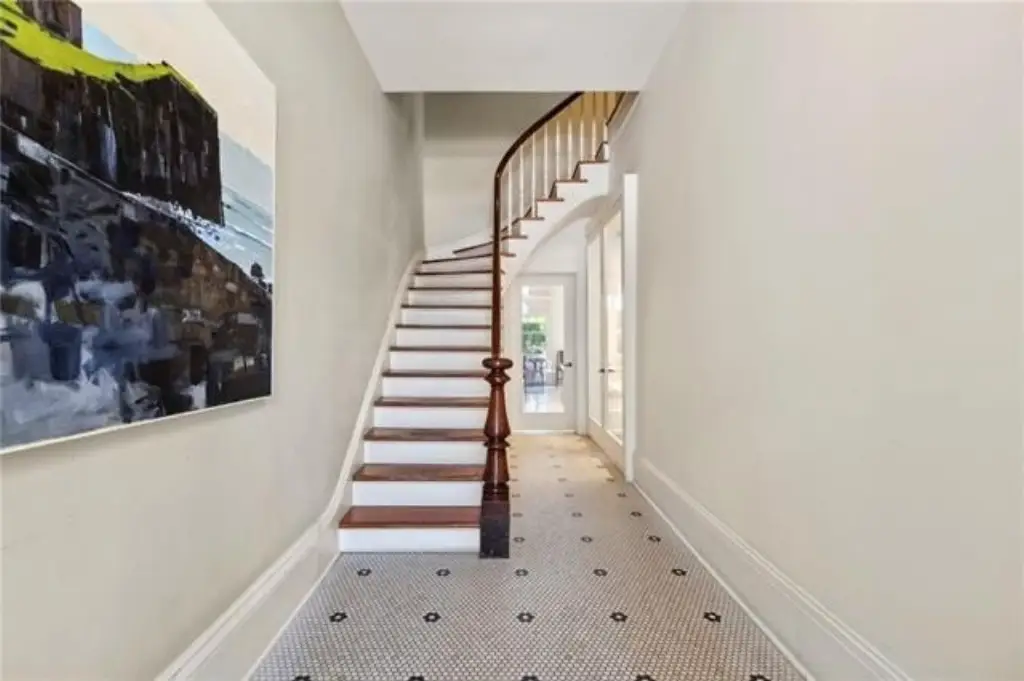
curving stairway
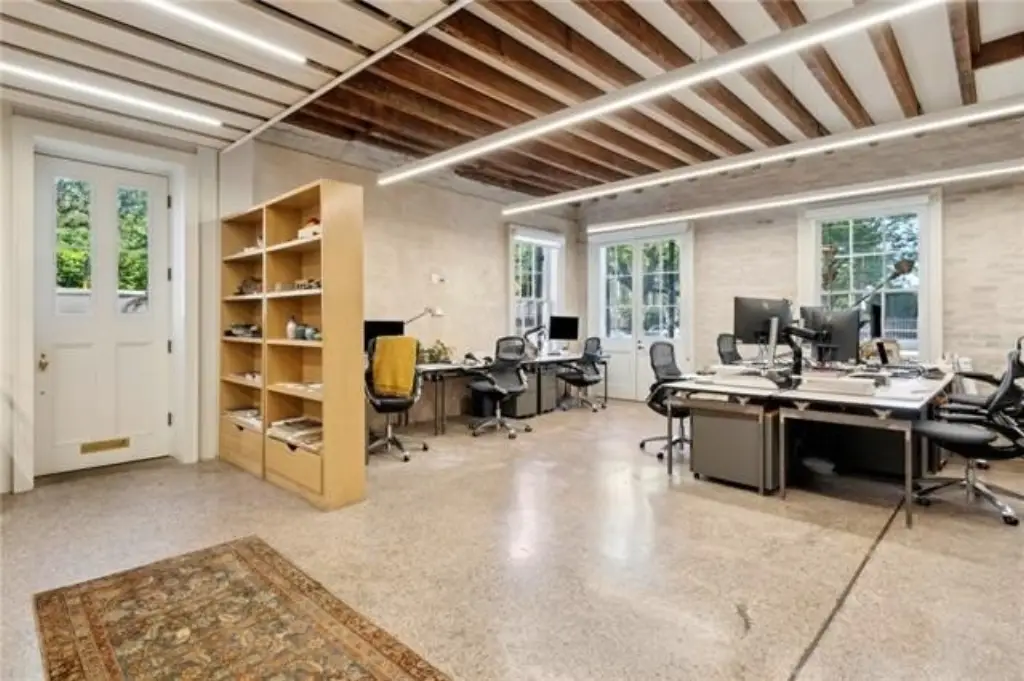
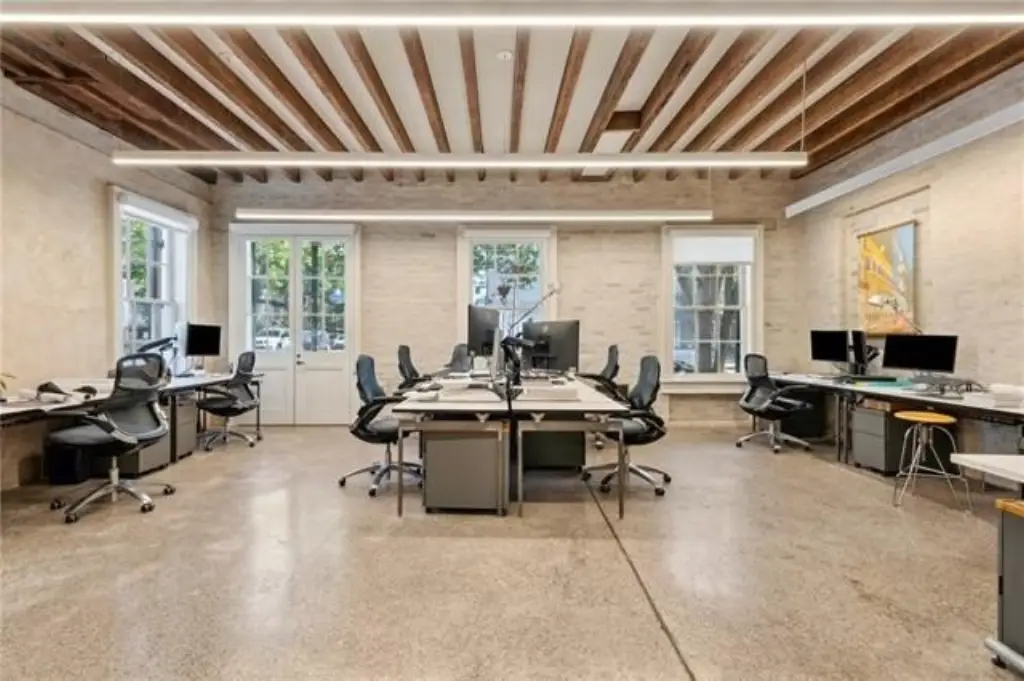
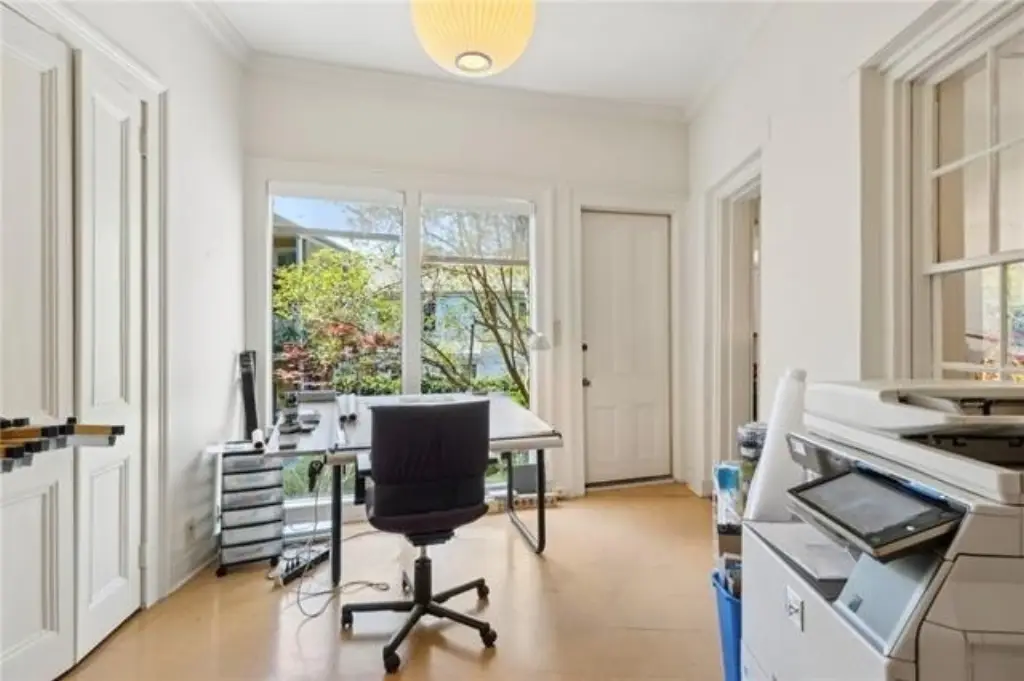
multiple large windows for excellent daylighting
Building Details
Year built
1858
Floors in Building
4
Listing Agency:
Witry Collective, L.L.C.
(504) 291-2022
Listed By:
Katie Witry · License #995710150
(504) 919-8585
Added: Nov 25, 2025
Changed: Sep 5
Last Checked: Oct 15 at 1:06PM
MLS# 2532125
Copyright © 2026 New Orleans Metropolitan Association of REALTORS®. All rights reserved. All information provided by the listing agent/broker is deemed reliable but is not guaranteed and should be independently verified.
Investment Insights
Based on property information with market context.
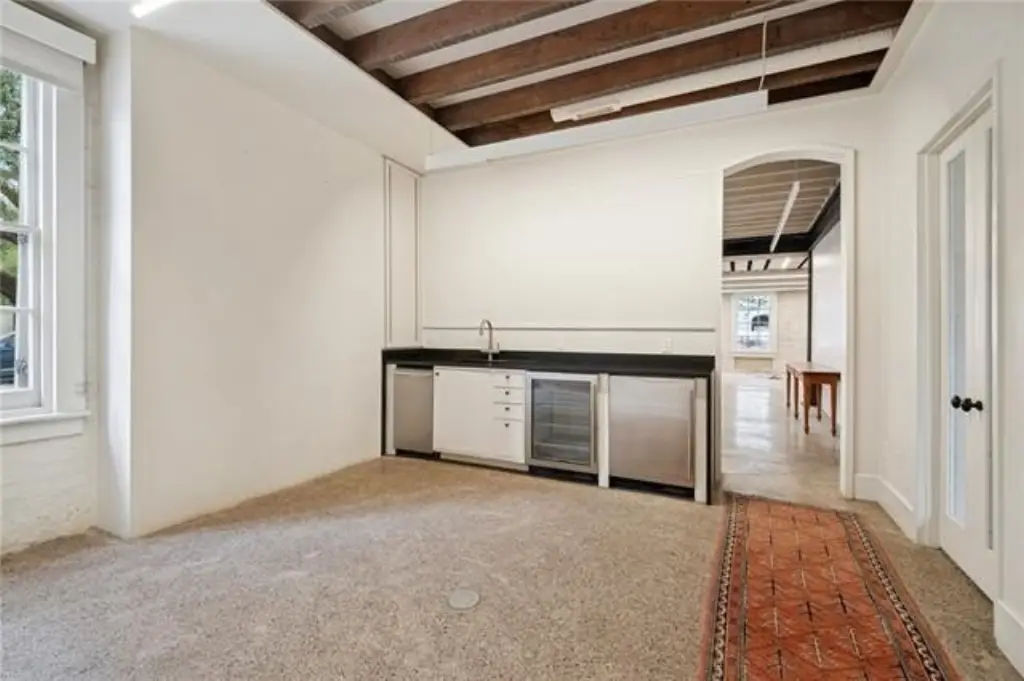
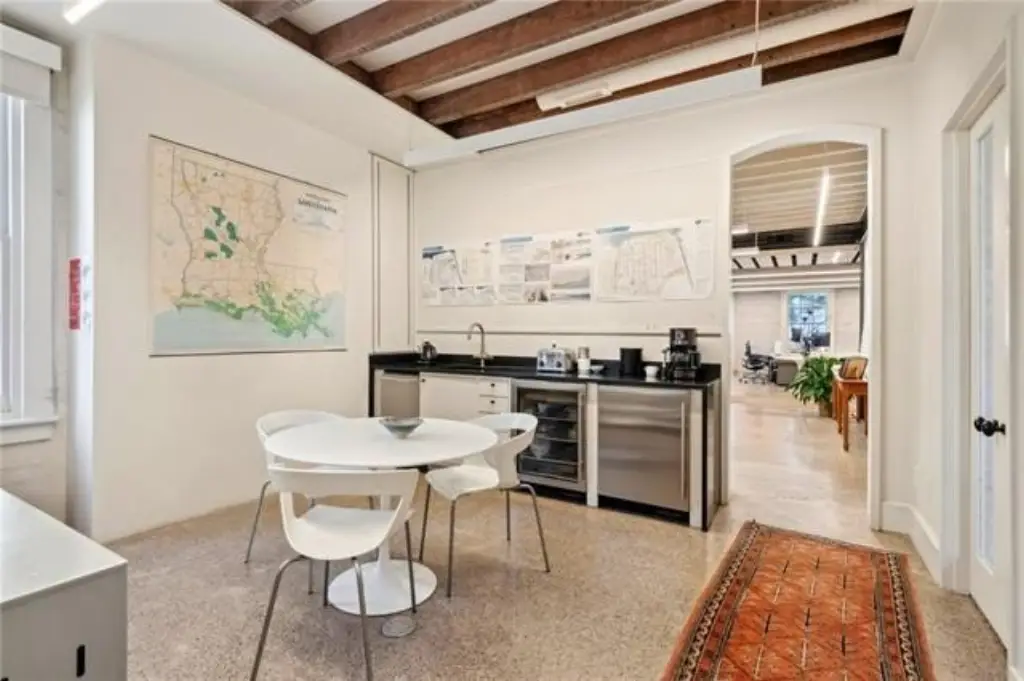
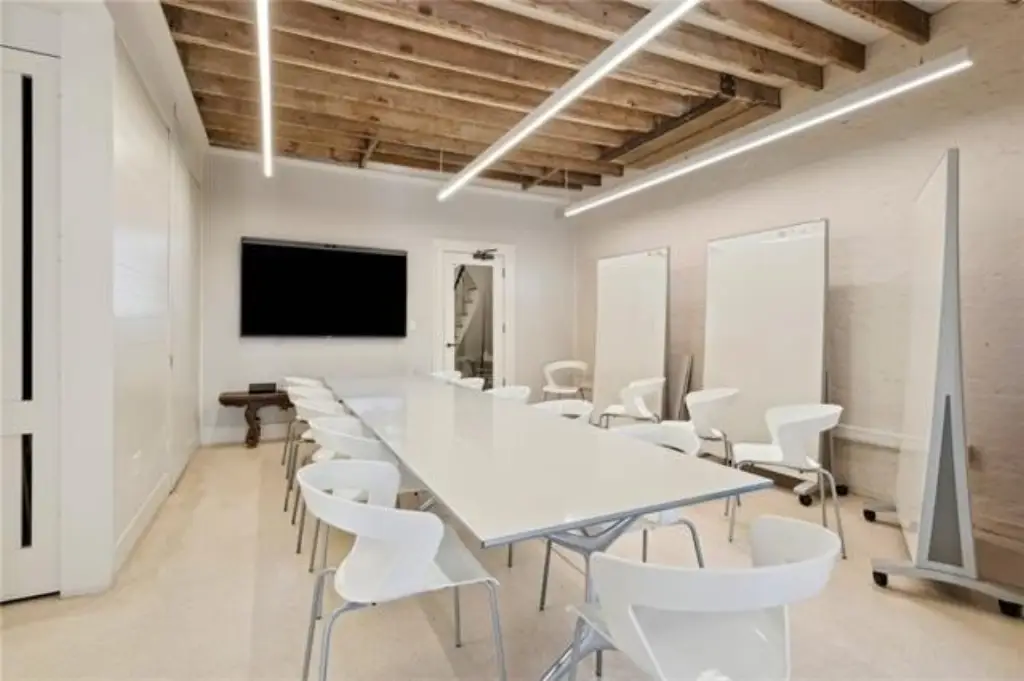
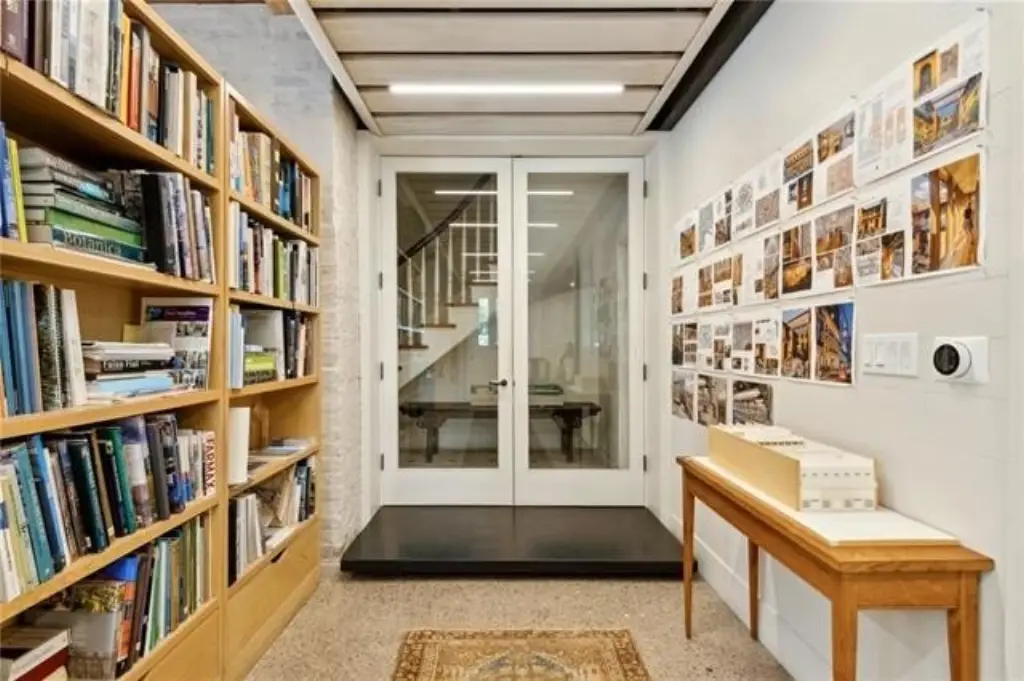
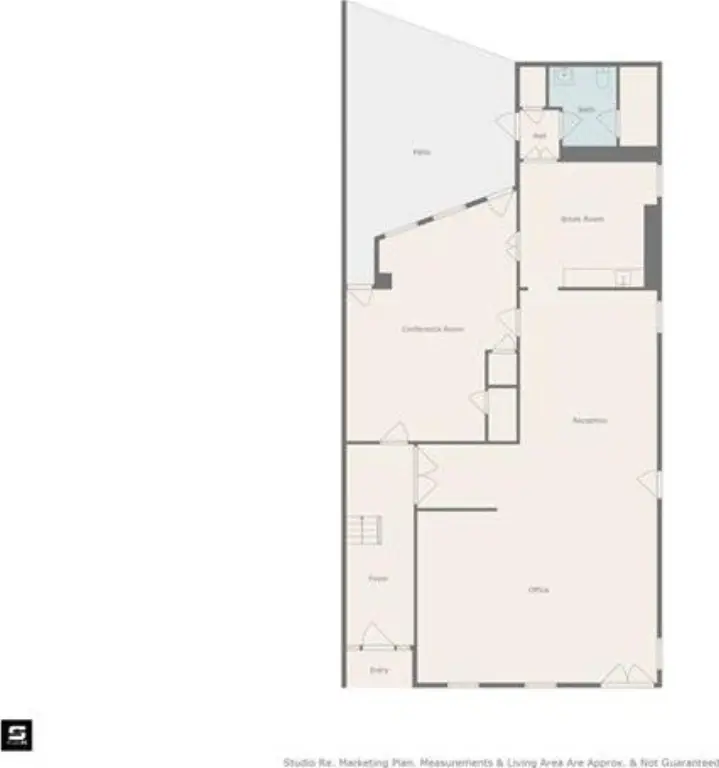
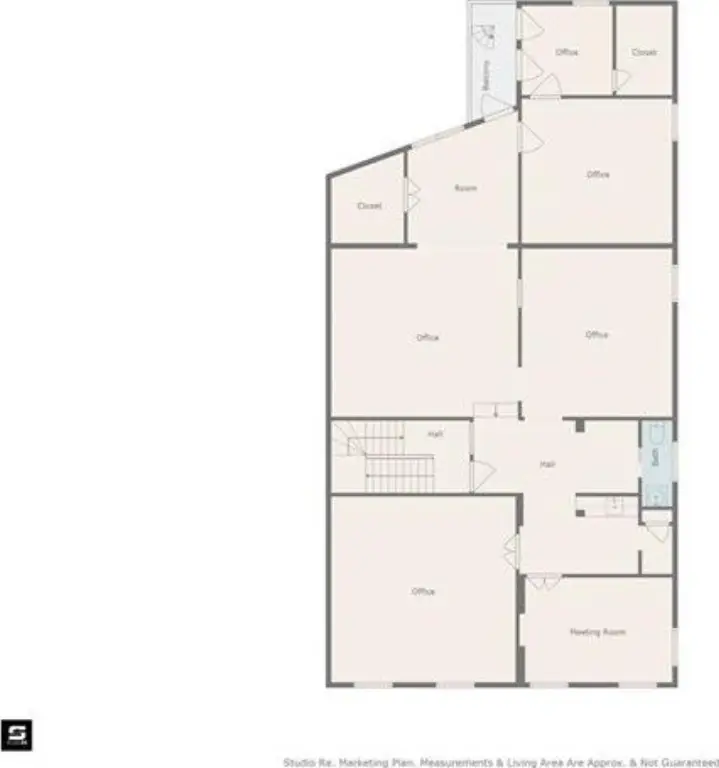
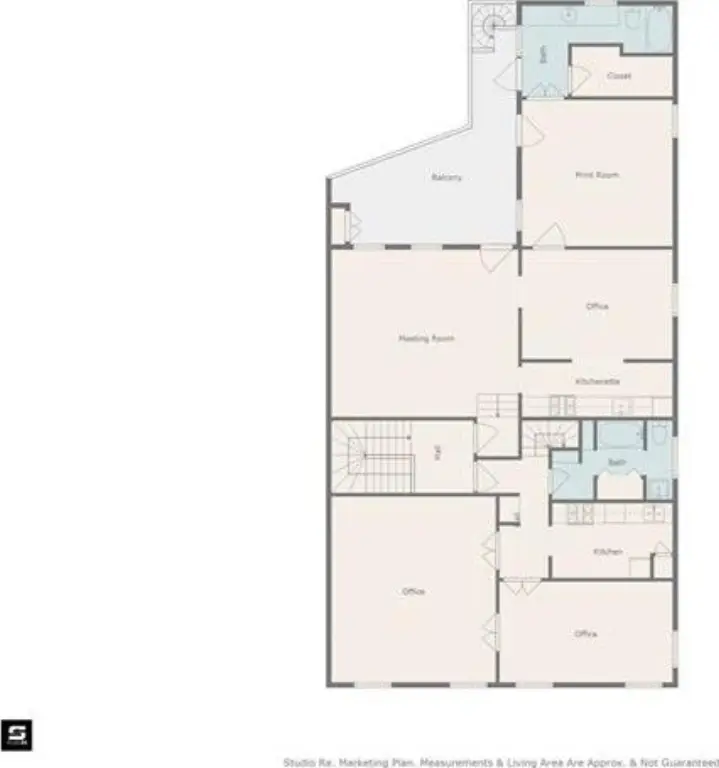
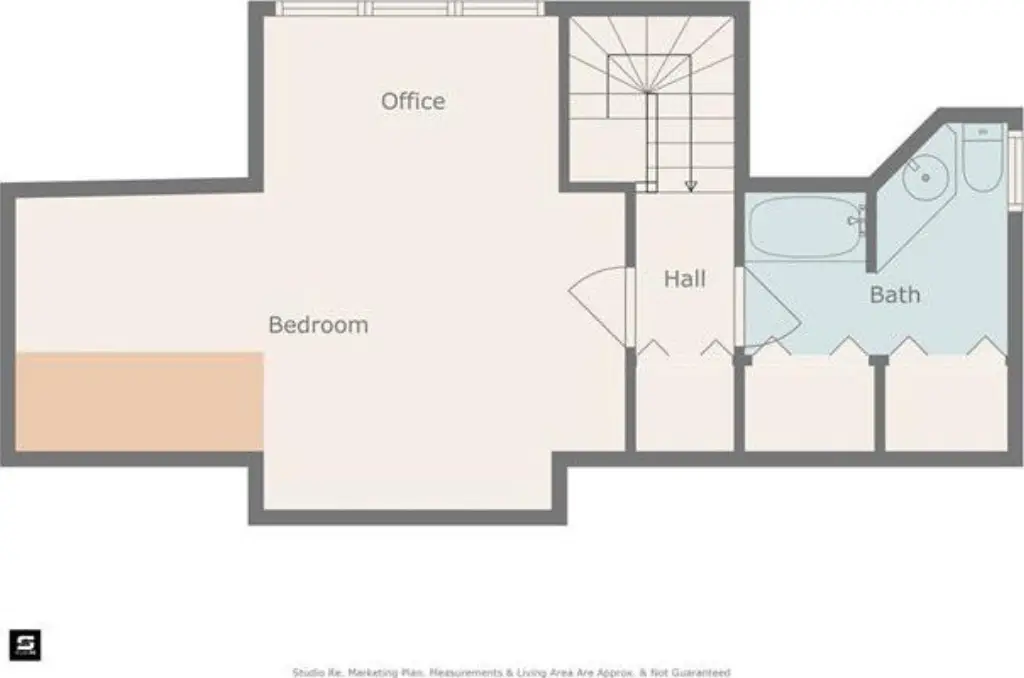
This four-level mixed-use property combines office, residential, and commercial functionality within a Greek Revival and Italianate structure. The building includes two entrances, tall ceilings, marble fireplaces, original wood floors and windows, and a curved stairway connecting the upper levels. A renovation raised the ground-floor elevation while exposing original framing and masonry walls. Large windows on three sides provide natural daylight throughout the building.
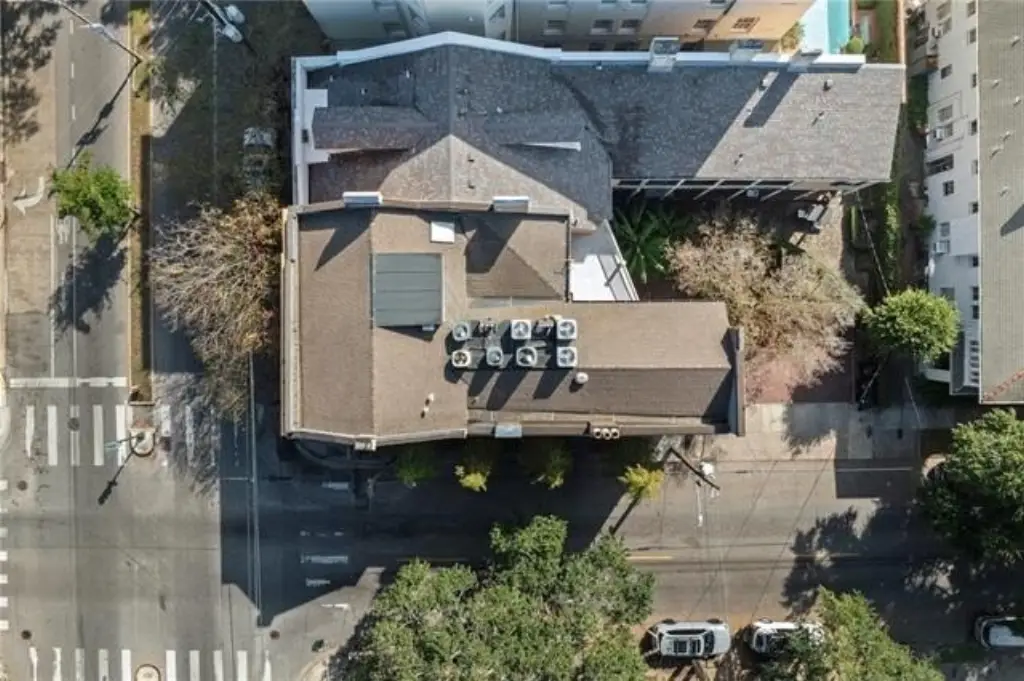
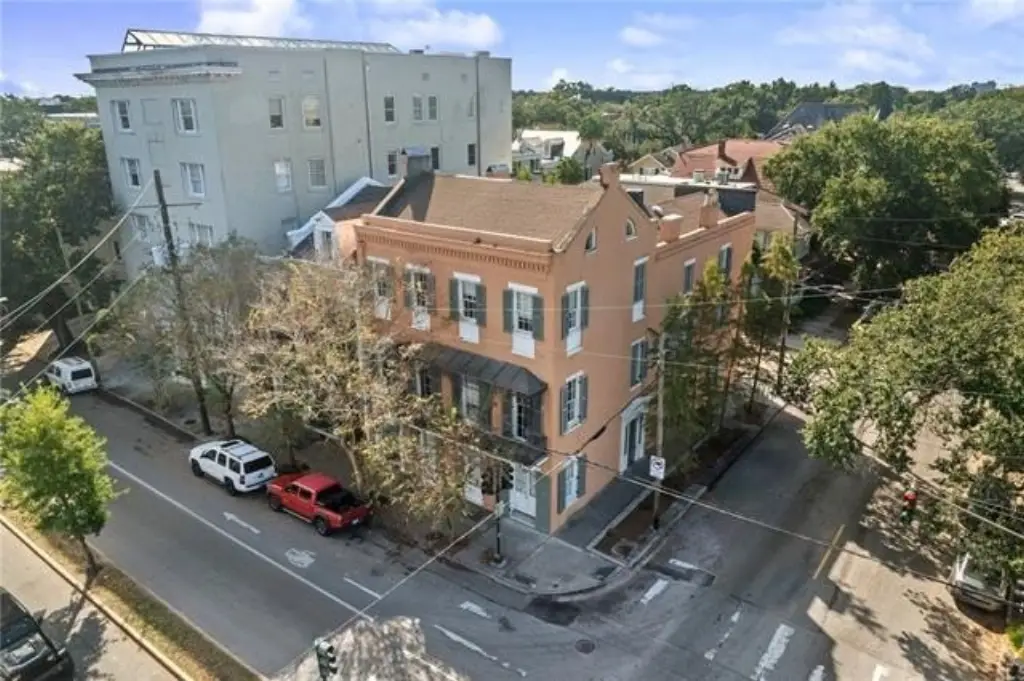
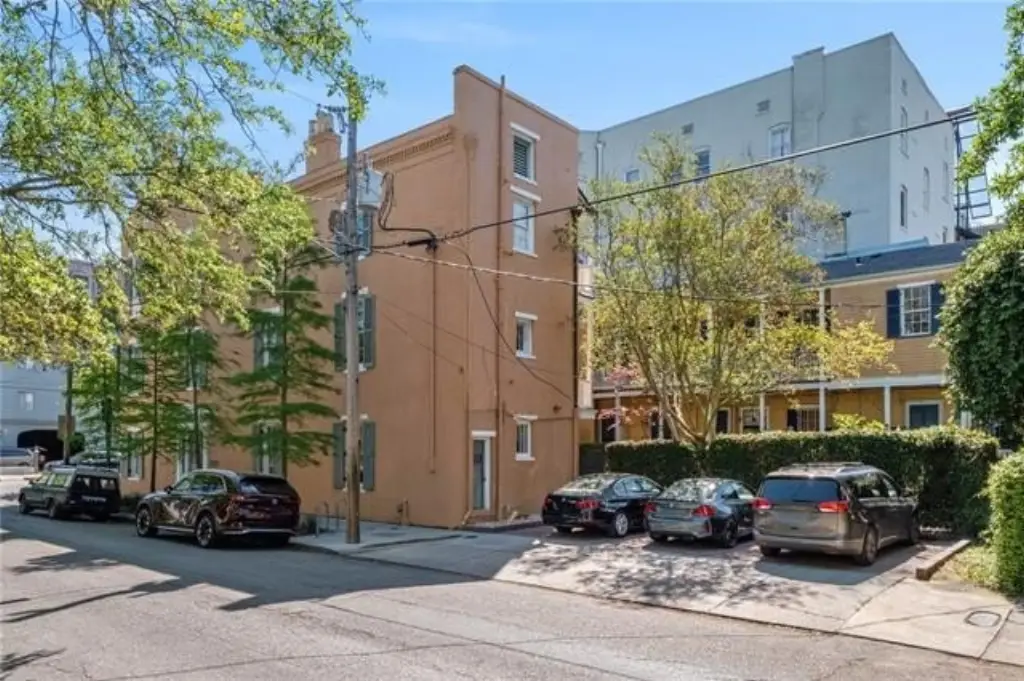
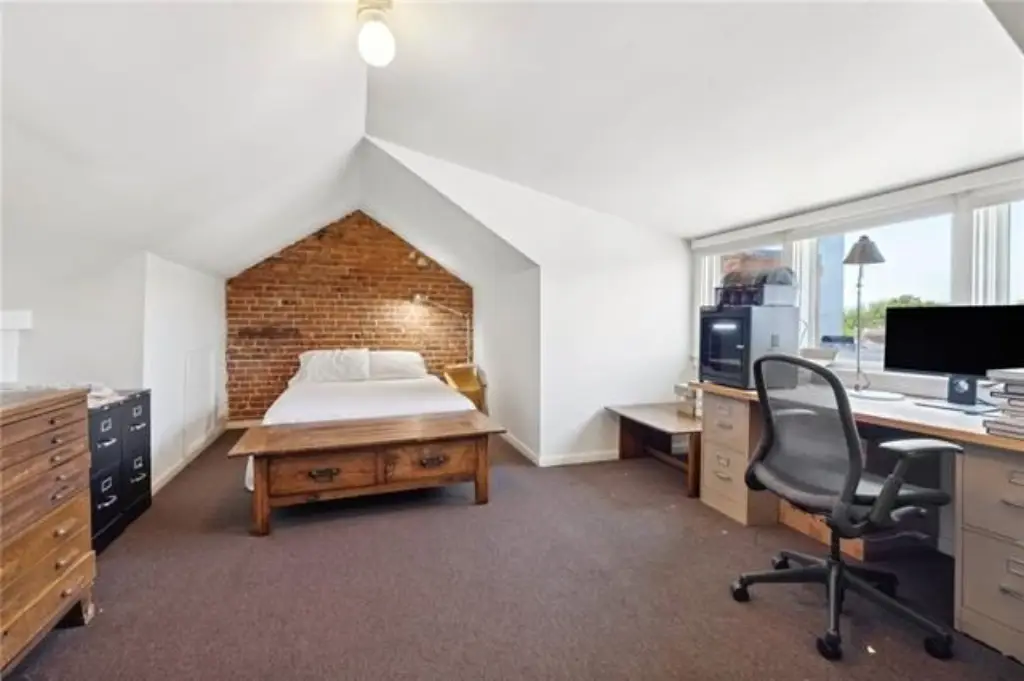
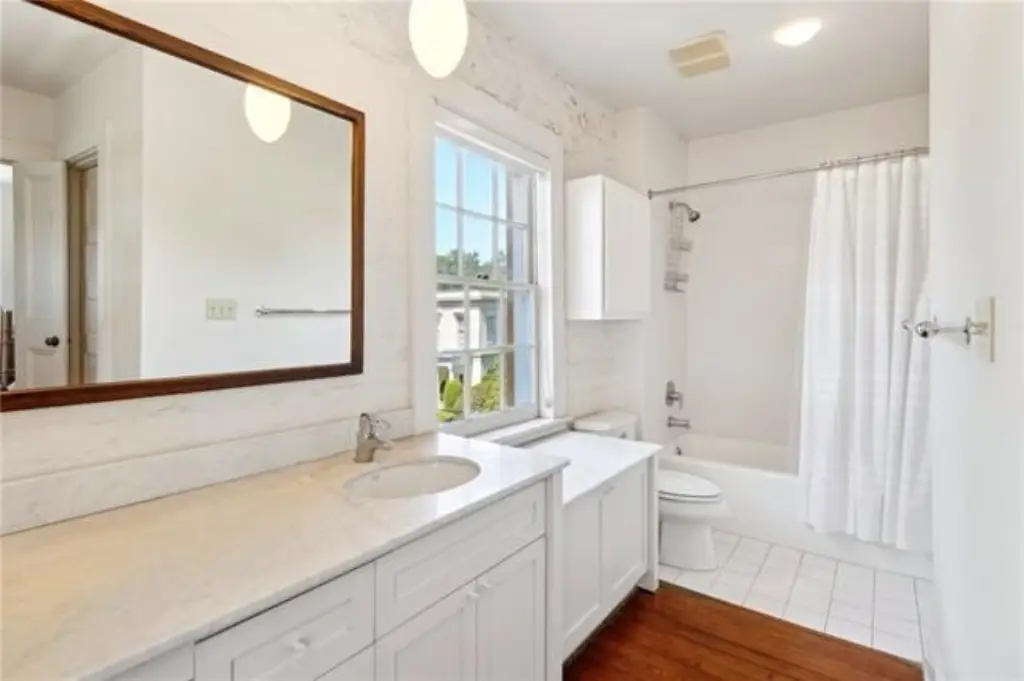
The property occupies the corner of Jackson Avenue and Prytania Street in New Orleans’ Garden District, one block from St. Charles Avenue and four blocks from Magazine Street. Its rear private courtyard includes two exterior galleries and parking for three standard or four compact automobiles. Upper-level floor plans can accommodate a range of residential and commercial configurations, while the property’s HU-RD1 zoning supports its mixed-use classification.
The property occupies the corner of Jackson Avenue and Prytania Street in New Orleans’ Garden District, one block from St. Charles Avenue and four blocks from Magazine Street. Its rear private courtyard includes two exterior galleries and parking for three standard or four compact automobiles. Upper-level floor plans can accommodate a range of residential and commercial configurations, while the property’s HU-RD1 zoning supports its mixed-use classification.
Key Highlights
- 6,728‑square‑foot four‑level mixed‑use property
- Corner location at Jackson Avenue and Prytania Street in New Orleans’ Garden District
- Greek Revival/Italianate architecture with original wood floors, windows, and wrought iron balcony
Financial Insights
Estimated NOI and Cap Rate
NOI / Yr
$99,172
Cap Rate
3.97%
Suggested Prices Based on Cap Rates
Cap Rate 5%
$1,983,440
$2.0M
Cap Rate 7%
$1,416,743
$1.4M
Cap Rate 9%
$1,101,911
$1.1M
Market Conditions
NOI Build-Up for 6,728 SF
Gross rent
$153.4K $22.80/SF
− Vacancy
−$21.2K −$3.15/SF
EGI
$132.2K $19.65/SF
− OpEx
−$33.1K −$4.91/SF
NOI
$99.2K $14.74/SF
Area
New Orleans, LA
Vacancy
13.80%
Lease Rate
$22.80 /SF/Yr
Expense Ratio
25.00%
Simulate Cap Rate and NOI
Suggested Prices Based on Cap Rates
Cap Rate 5%
$1,983,440
Cap Rate 7%
$1,416,743
Cap Rate 9%
$1,101,911
Alternative Uses
Best Use
Office B
$1.42M
$1.24M – $1.65M
NOI $99,172 @ 7.0% cap · market cap 3.97%
Second Best
Mixed Use
$1.30M
$1.14M – $1.51M
NOI $90,828 @ 7.0% cap · market cap 3.64%
Theoretical Best
Office A
$1.71M
$1.50M – $2.00M
NOI $119,702 @ 7.0% cap · market cap 4.80%
Zoning and permitted uses should be independently verified with authorities.
How Realmo checks its estimates
Property Analytics
Unlock full access to Insights
Subscribe to Realmo Intelligence
Open Analytics
Current Use
Lease Details
Single-tenant
Tenancy
Yes
Paved road access
Location Intelligence
Trade Area within ½ mile
2,703
Businesses Nearby
Explore this area
Business Placement
Demographics for 70130, LA
14,521
Population
10,927
Households
1.3
Avg Household Size
38
Median Age
64%
College-Educated
92%
High-School Grad
2.1 sq mi
ZIP Area
6,915
Density / Sq Mi
$82,758
Median Household Income
$52,492
Median Earnings
$1,410
Median Rent
$529,300
Median Home Value
Check the figures for this property
Cap Rate, Value Estimation, Potential NOI and more
View Realmo Analytics
Market
Vacancy Rate% for Office in New Orleans, LA

Questions? Ask Rey
Realmo’s AI knows this listing — price, zoning, demand, history. Ask anything.


Frequently Asked Questions
What type of property is this?
Mixed-use property - Adaptable commercial and residential building with original architectural details, private outdoor space, and dedicated parking.
Where is this mixed-use property located?
The property is located at 2200 PRYTANIA Street New Orleans, LA.
What is the asking price?
The asking price for this property is $2,495,000.
What are key features of this property?
This property features: 6,728‑square‑foot four‑level mixed‑use property; Corner location at Jackson Avenue and Prytania Street in New Orleans’ Garden District; Greek Revival/Italianate architecture with original wood floors, windows, and wrought iron balcony