Mixed-Use Building with Office
For Sale
$895,000
220 NW SPRING St, Waldport, OR 97394
CommercialSale, Waldport, OR
Property Size3,116 SF
Price / SF$287.23
Days on Market211

Ask AI about this property
Review the available facts, identify missing information and prepare questions for the agent.
Property Features for 220 NW SPRING St
General Information
Property type
Commercial Sale
Property subtype
Other
Zoning
D-D
View
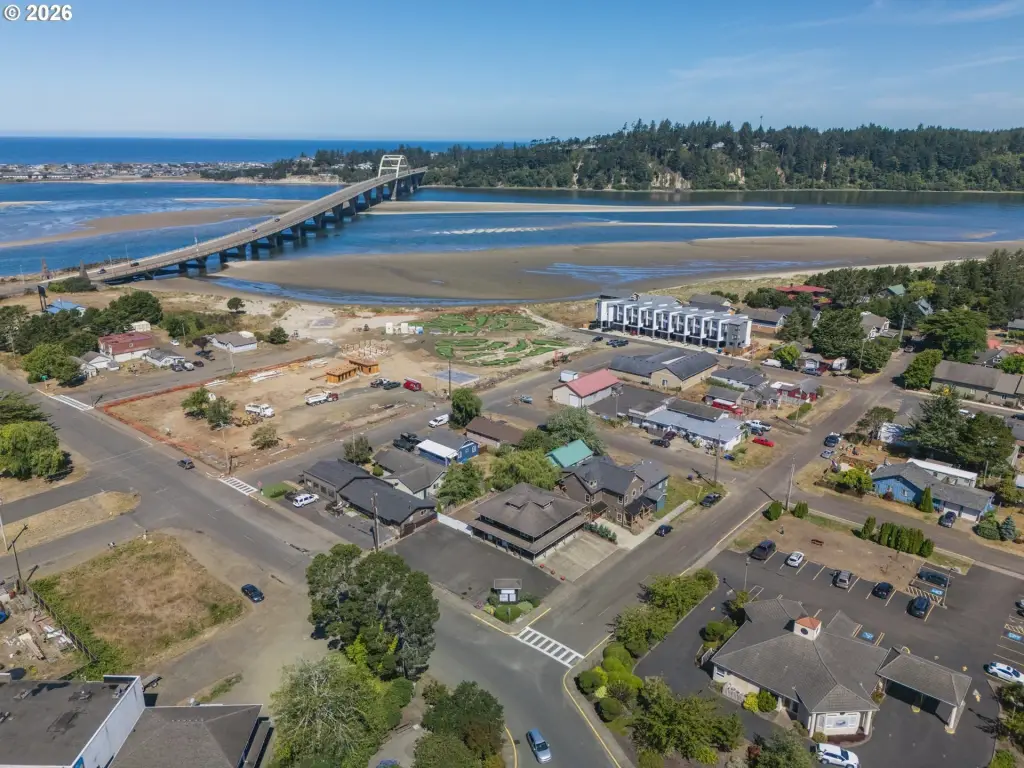
Ocean
Directions
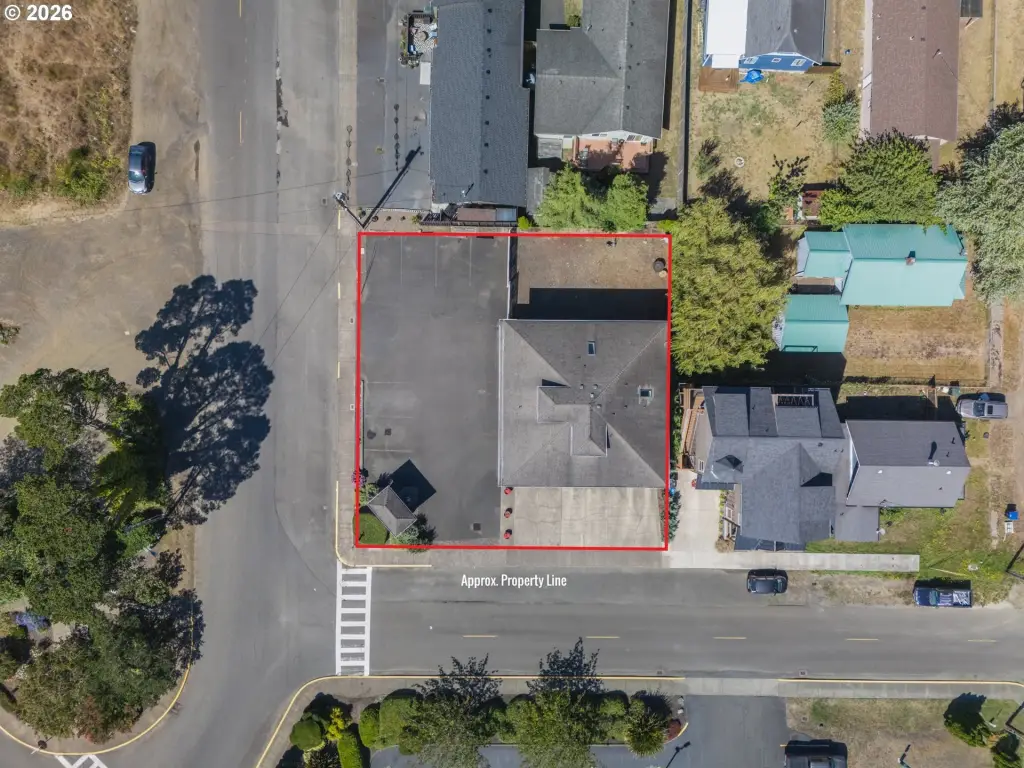
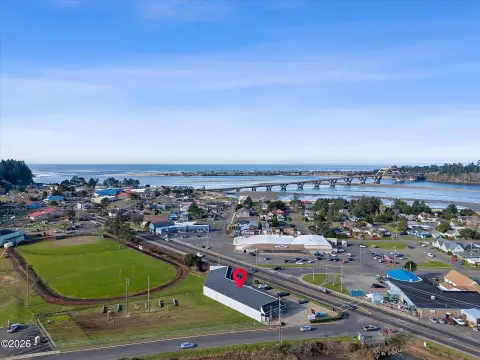
Highway 101 to Waldport, east on Highway 34, left on Spring Street. Corner of Spring & Alder
Subdivision
_200
Standard status
Active
APN
R429258
Size
3,116 SF
Taxes and HOA fees
Tax Description
PROPERTY ID R429258 RUBLES SECOND ADDN.-WALDPORT, BLOCK 32, LOT 3
Tax Annual Amount
4485
Legal Description
PROPERTY ID R429258 RUBLES SECOND ADDN.-WALDPORT, BLOCK 32, LOT 3
Amenities
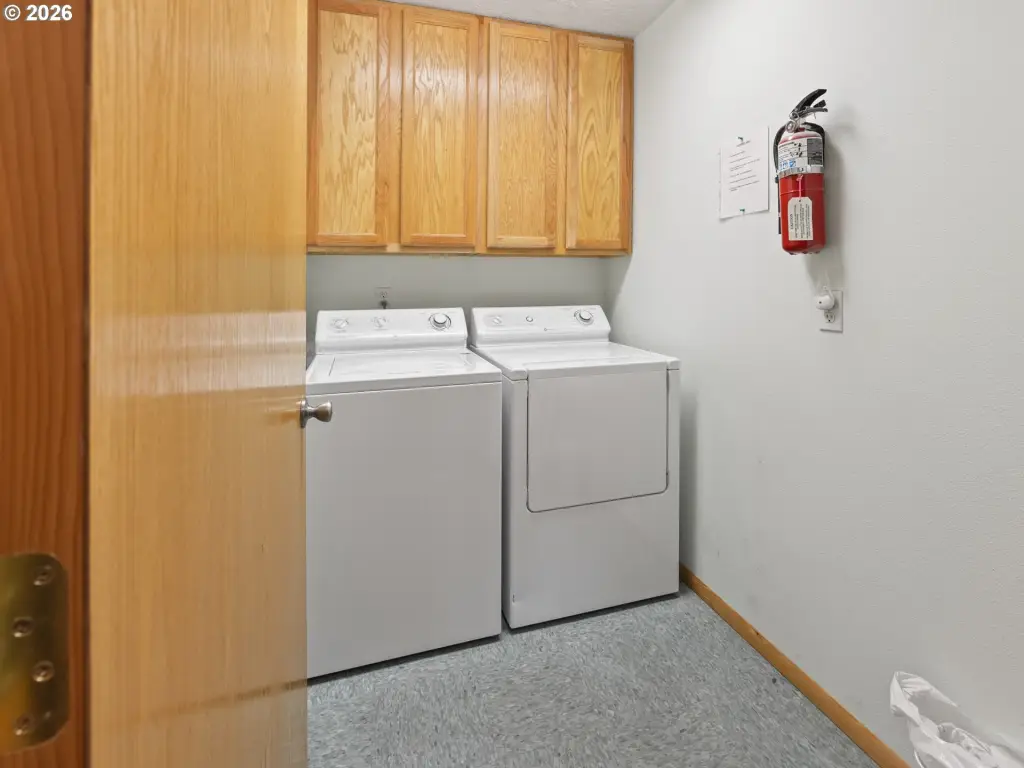
laundry room
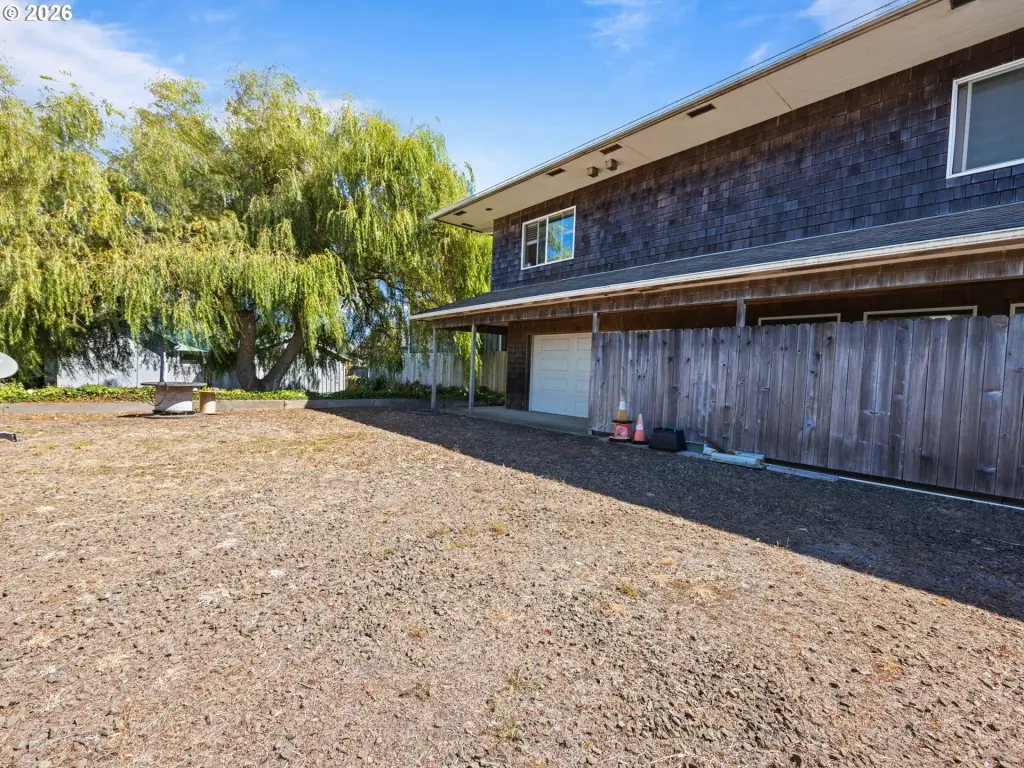
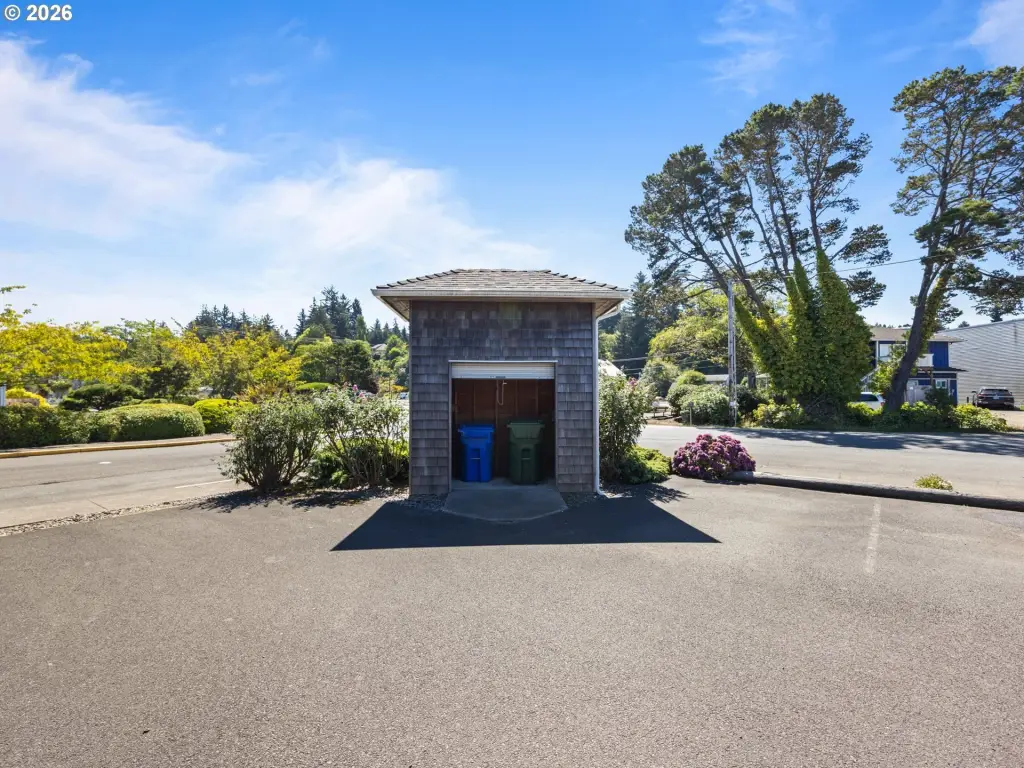
garage
Building Details
Year built
2003
Floors in Building
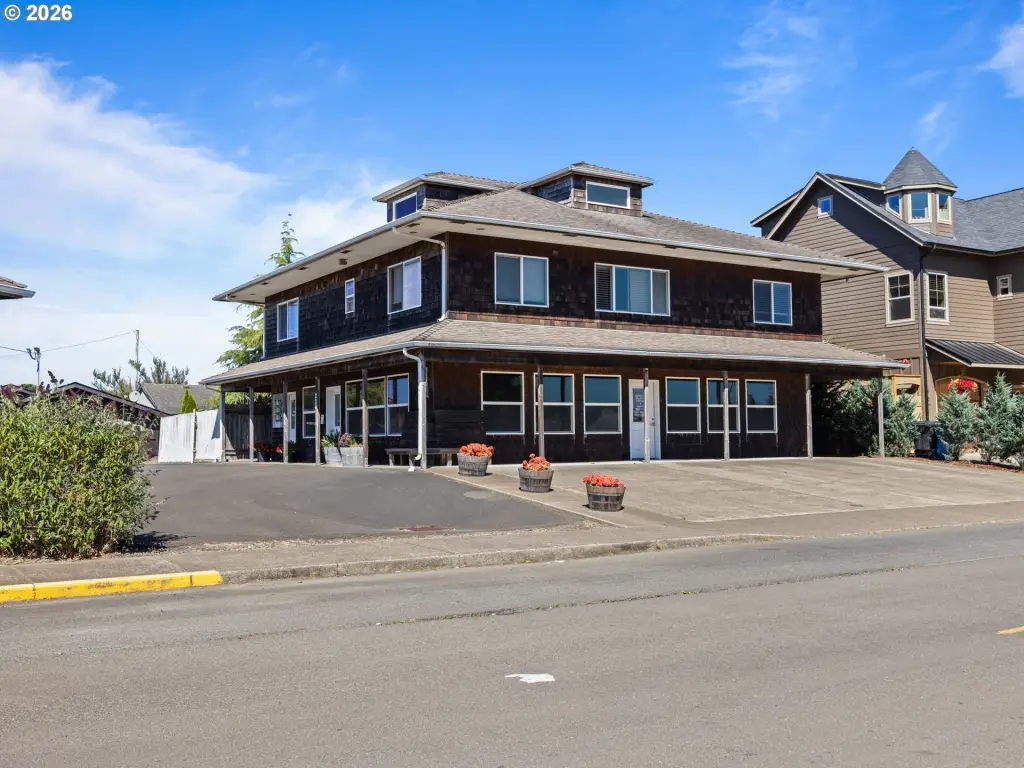
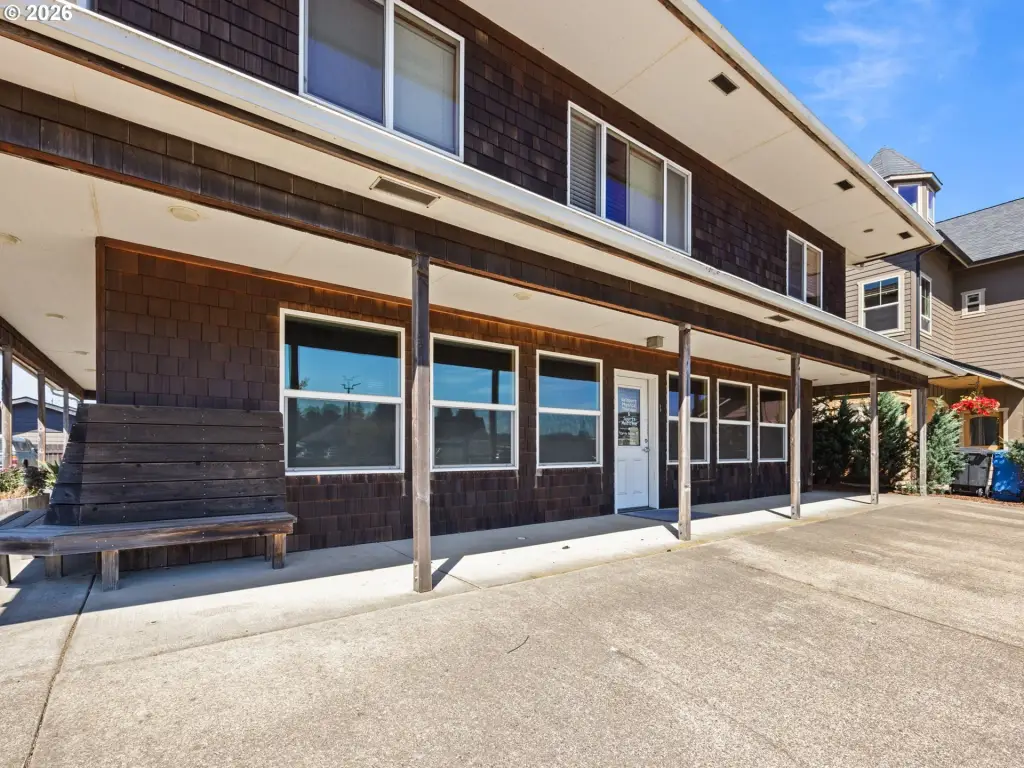
2
Building materials
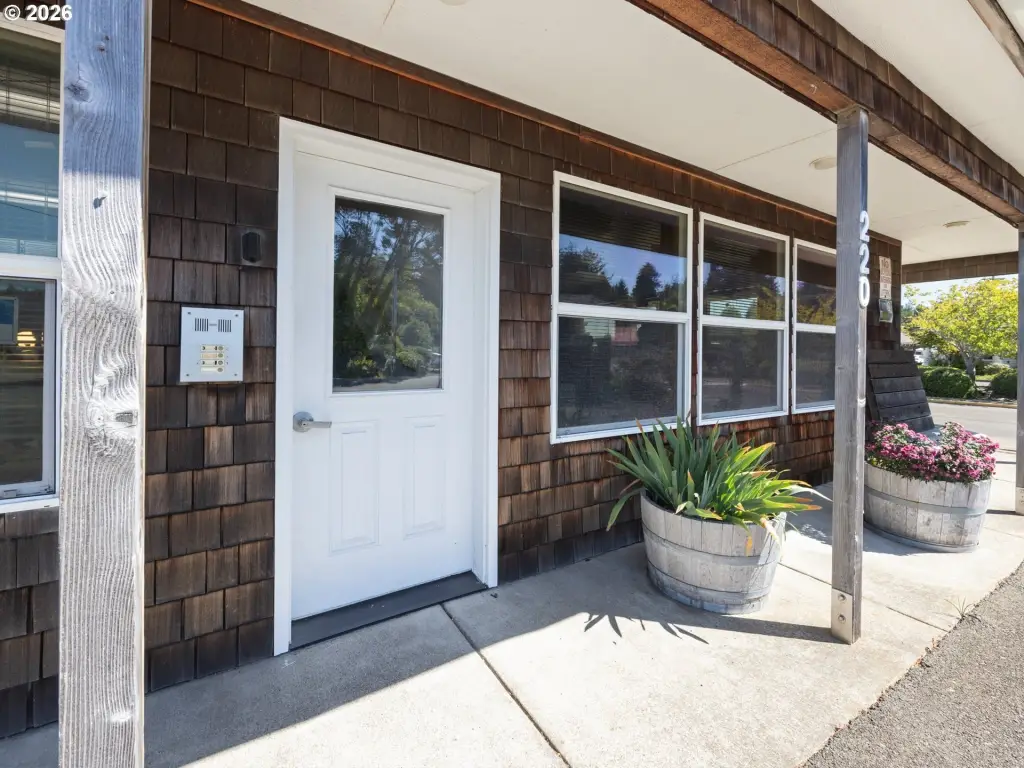
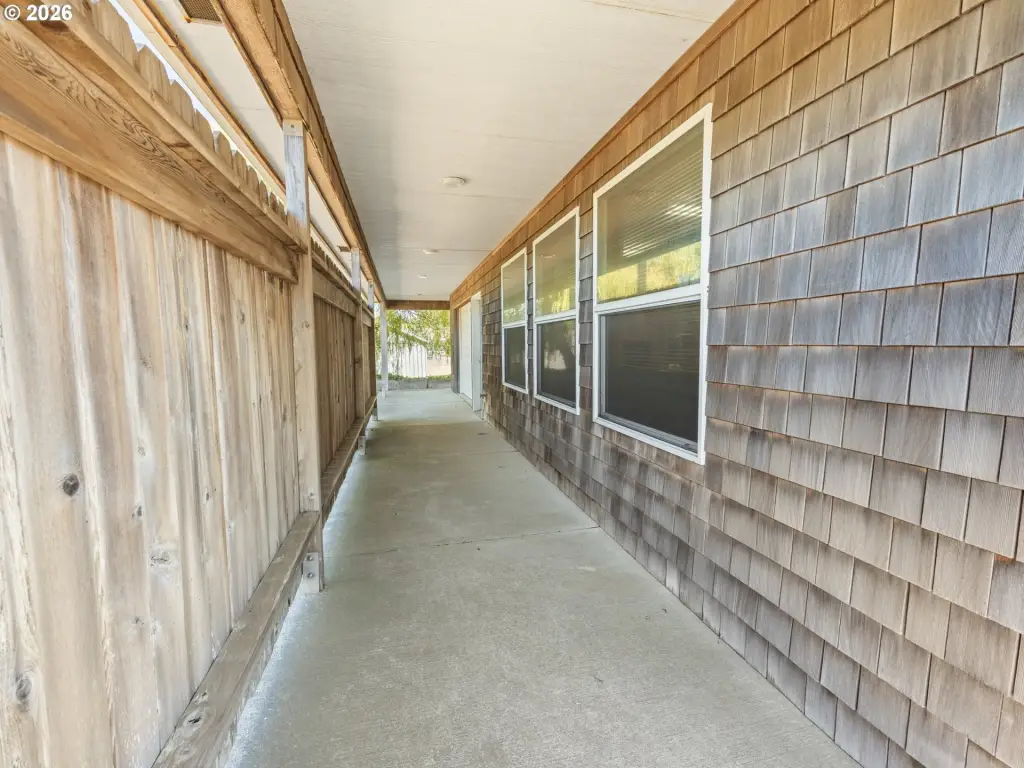
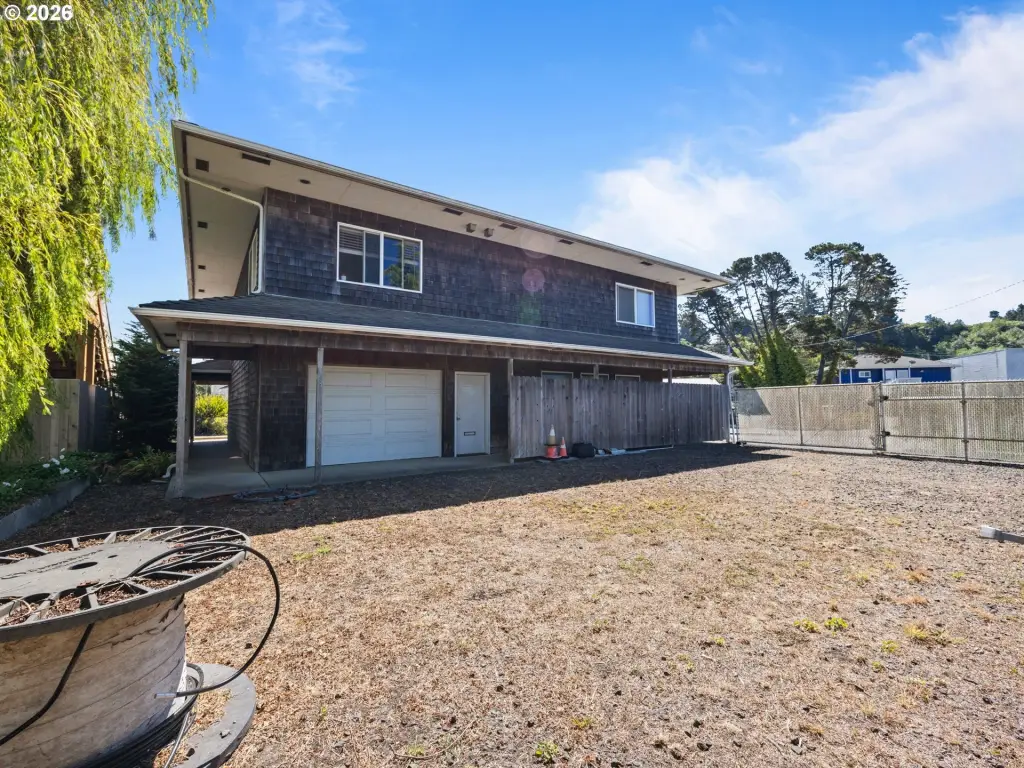
Cedar, ShingleSiding
Roof type
Composition
Listing Agency:
Emerald Coast Realty-Seal Rock
(541) 270-7998
Listed By:
Pamela Mugleston · License #940600295
(541) 283-3589
Added: Mar 19
Changed: Oct 10
Last Checked: Oct 15 at 3:06PM
MLS# 559344475
Copyright © 2026 Regional Multiple Listing Services. All rights reserved. All information provided by the listing agent/broker is deemed reliable but is not guaranteed and should be independently verified.
Investment Insights
Based on property information with market context.
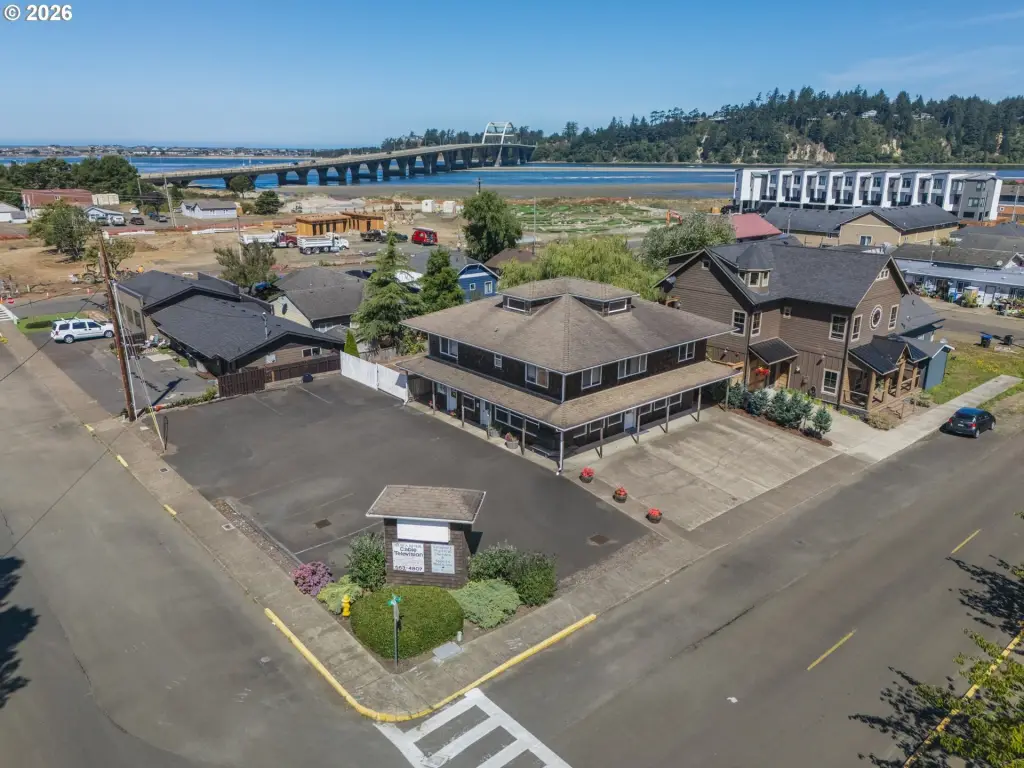
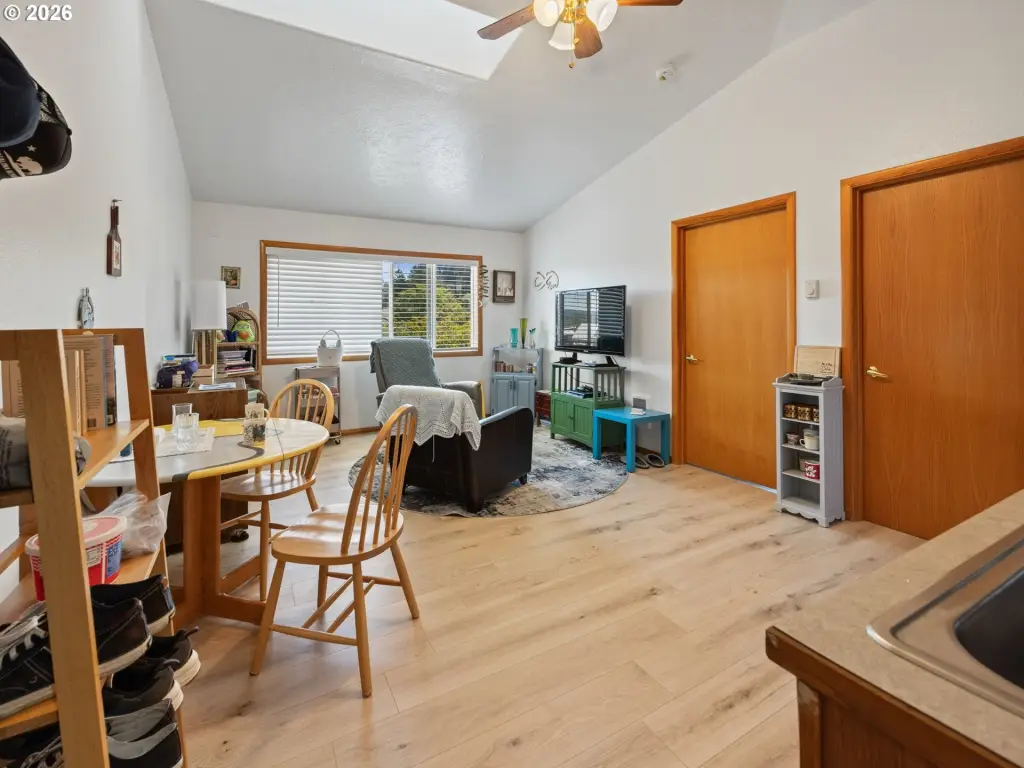
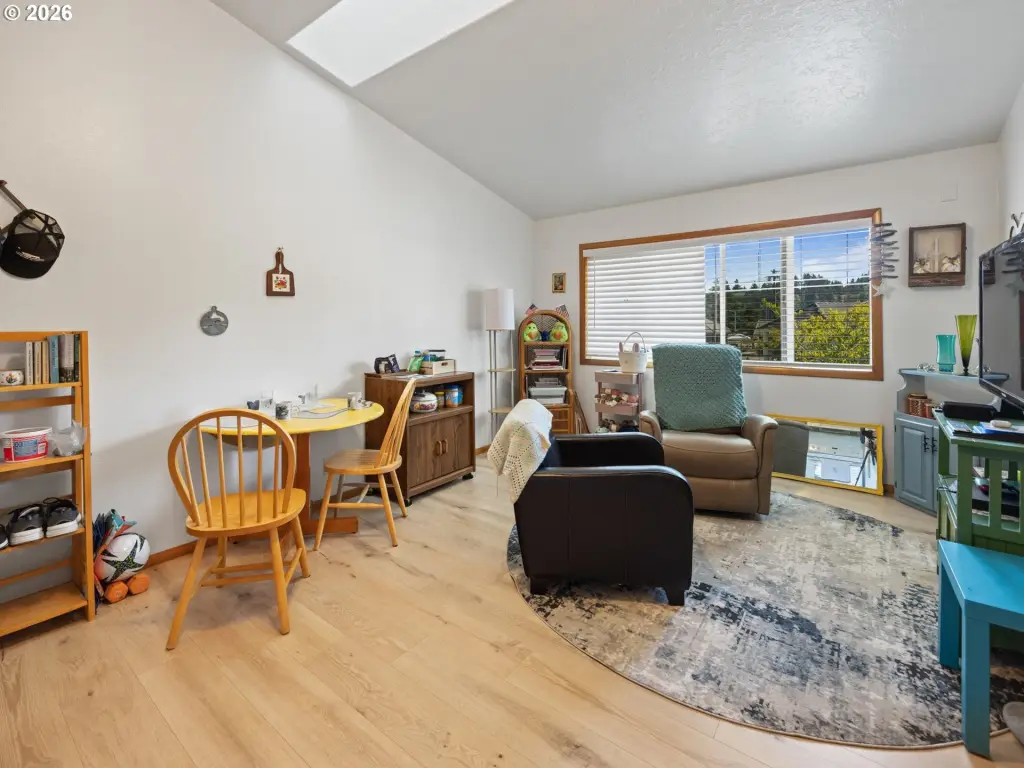
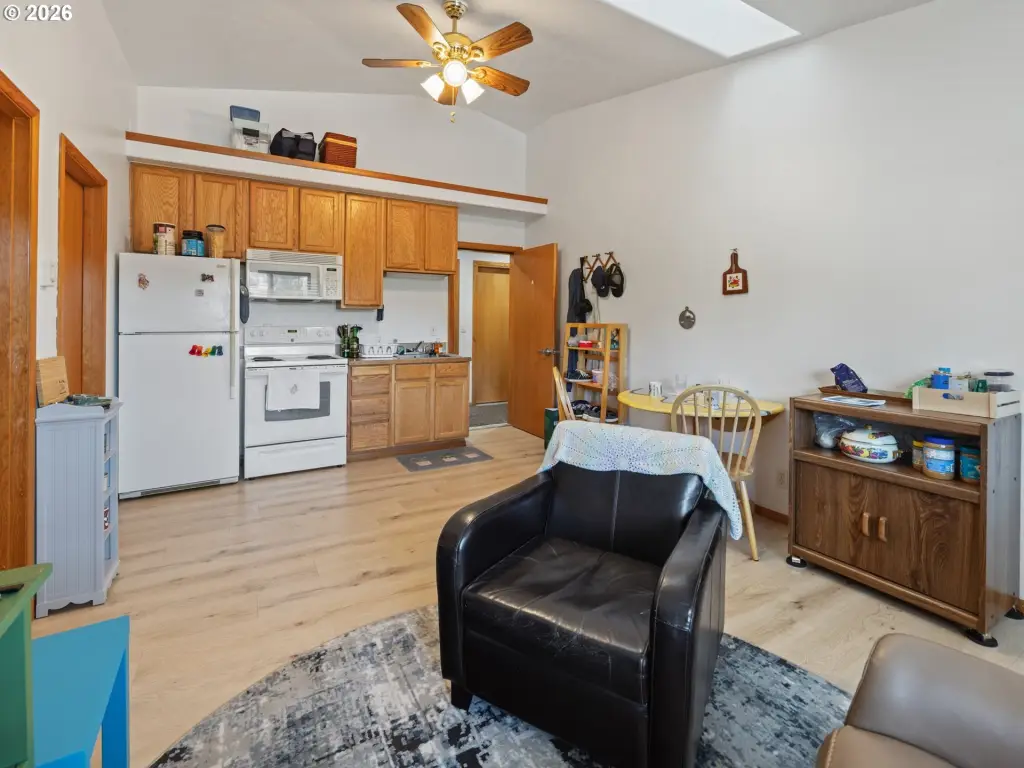
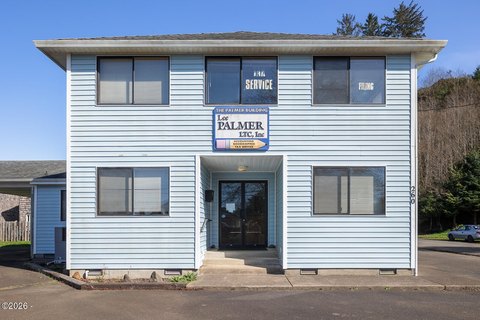
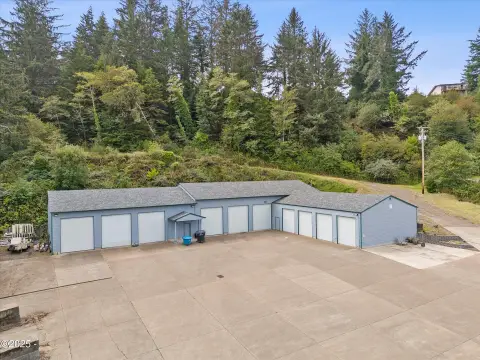
This mixed-use property contains 3 residential units and 2 commercial office spaces within a 3,116-square-foot building. The layout also includes a laundry room and a garage that can support storage or workshop use. Built in 2003, the structure features cedar and shingle siding beneath a composition roof, with zoning identified as D-D.
The property is within Waldport city limits at 220 NW Spring St, Waldport, OR 97394. The source information places it near beach and shopping amenities. Expansion plans described for the property allow for the addition of up to 4 residential units, subject to applicable approvals and requirements.
The property is within Waldport city limits at 220 NW Spring St, Waldport, OR 97394. The source information places it near beach and shopping amenities. Expansion plans described for the property allow for the addition of up to 4 residential units, subject to applicable approvals and requirements.
Key Highlights
- 3 residential units and 2 commercial office spaces
- 3,116 SF mixed‑use building on 220 NW Spring St
- Zoned D‑D with expansion described for up to 4 additional residential units
Financial Insights
Estimated NOI and Cap Rate
NOI / Yr
$47,938
Cap Rate
5.36%
Suggested Prices Based on Cap Rates
Cap Rate 5%
$958,760
$958.8K
Cap Rate 7%
$684,829
$684.8K
Cap Rate 9%
$532,644
$532.6K
Market Conditions
NOI Build-Up for 3,116 SF
Gross rent
$83.0K $26.64/SF
− Vacancy
−$19.1K −$6.13/SF
EGI
$63.9K $20.51/SF
− OpEx
−$16.0K −$5.13/SF
NOI
$47.9K $15.38/SF
Area
Lincoln County, OR
Vacancy
23.00%
Lease Rate
$26.64 /SF/Yr
Expense Ratio
25.00%
Simulate Cap Rate and NOI
Suggested Prices Based on Cap Rates
Cap Rate 5%
$958,760
Cap Rate 7%
$684,829
Cap Rate 9%
$532,644
Alternative Uses
Best Use
Office B
$684.8K
$599.2K – $799.0K
NOI $47,938 @ 7.0% cap · market cap 5.36%
Second Best
Mixed Use
$408.0K
$357.0K – $476.0K
NOI $28,558 @ 7.0% cap · market cap 3.19%
Theoretical Best
Office A
$812.8K
$711.2K – $948.2K
NOI $56,893 @ 7.0% cap · market cap 6.36%
Zoning and permitted uses should be independently verified with authorities.
How Realmo checks its estimates
Property Analytics
Unlock full access to Insights
Subscribe to Realmo Intelligence
Open Analytics
Current Use
Lease Details
2
Office units
3
Residential units
Multi-tenant
Tenancy
Location Intelligence
Trade Area within ½ mile
271
Businesses Nearby
Explore this area
Business Placement
Demographics for 97394, OR
5,361
Population
3,686
Households
1.5
Avg Household Size
59
Median Age
28%
College-Educated
95%
High-School Grad
51.7 sq mi
ZIP Area
104
Density / Sq Mi
$57,708
Median Household Income
$31,690
Median Earnings
$1,104
Median Rent
$354,400
Median Home Value
Check the figures for this property
Cap Rate, Value Estimation, Potential NOI and more
View Realmo Analytics
Market
Vacancy Rate% for Office in West region

Frequently Asked Questions
What type of property is this?
Mixed-use property - Combines residential units with commercial offices, plus shared laundry and garage space.
Where is this mixed-use property located?
The property is located at 220 NW SPRING St Waldport, OR.
What is the asking price?
The asking price for this property is $895,000.
What are key features of this property?
This property features: 3 residential units and 2 commercial office spaces; 3,116 SF mixed‑use building on 220 NW Spring St; Zoned D‑D with expansion described for up to 4 additional residential units