Mixed-Use Property with Two
For Sale
$1,925,000
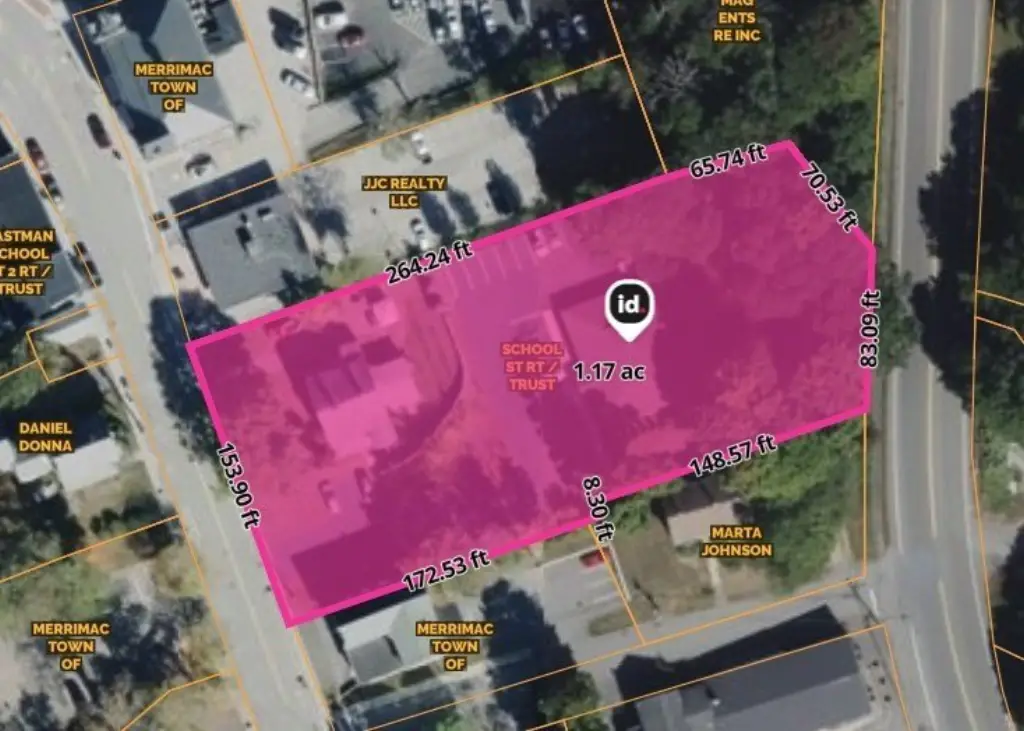
22-26 School St, Merrimac, MA 01860
Commercial Sale, Merrimac, MA
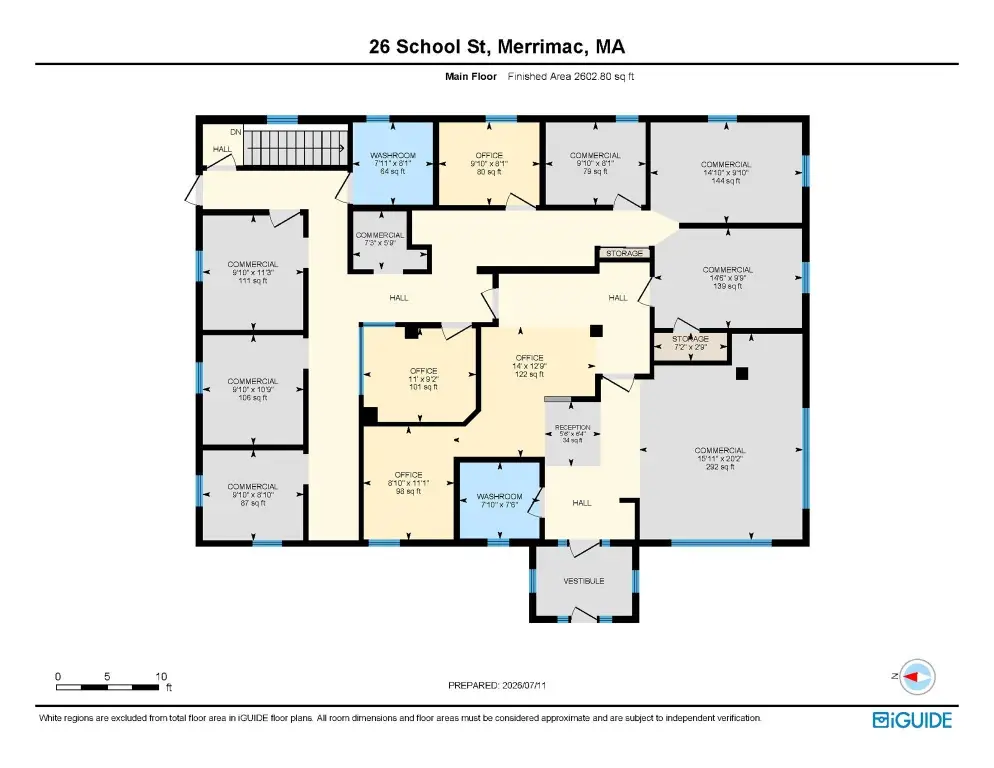
Property Size2,962 SF
Lot Size1.16 Acres
Price / SF$286.42
Days on Market95
Property Features for 22-26 School St
General Information
Property type
Commercial Sale
Property subtype
Other
Zoning
VC
Zoning description
Legal Conforming
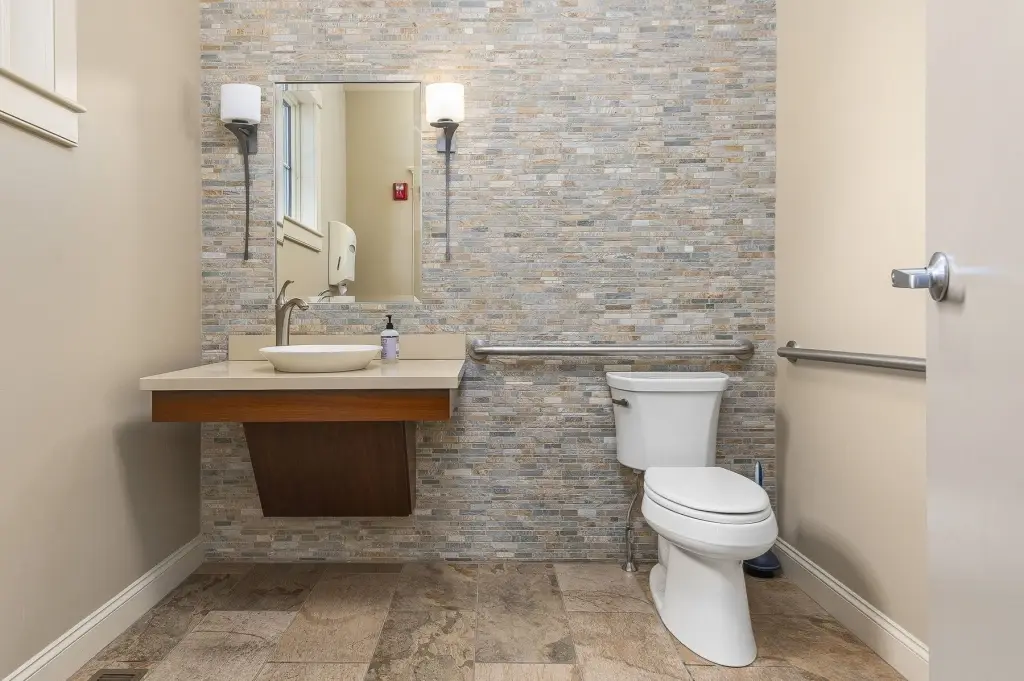
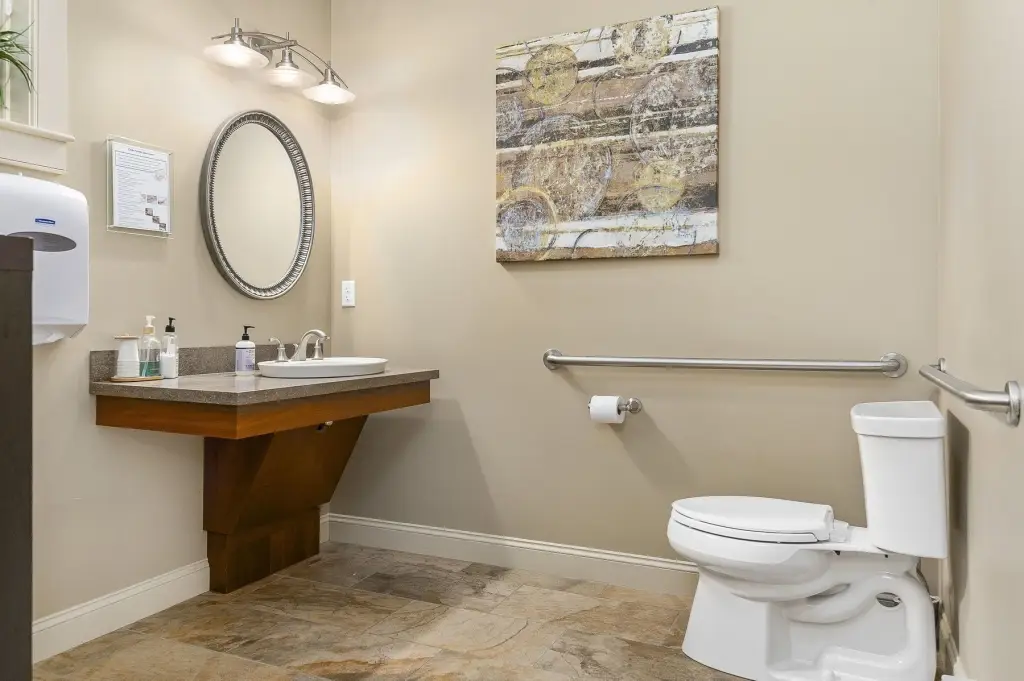
Bathrooms
5
Full bathrooms
5
Rooms
Bathroom 1, Bathroom 3, Bathroom 5, Bathroom 4, Bathroom 2
Directions
I-495 to Broad St to west on E Main (MA 110), left on School St to destination
Standard status
Active
APN
M:0013 B:0001 L:0016,2032661
Size
6,721 SF
Lot size
1.16 Acres
Taxes and HOA fees
Tax Year
2026
Tax Annual Amount
14725
Building Details
Year built
1855
Listing Agency:
Keller Williams Realty
Listed By:
Susan Rochwarg
(978) 475-2111
Added: Jul 17
Changed: Oct 16
Last Checked: Oct 19 at 8:06AM
MLS# 73551397
Copyright © 2026 MLS Property Information Network Inc. All rights reserved. All information provided by the listing agent/broker is deemed reliable but is not guaranteed and should be independently verified.

Ask AI about this property
Review the available facts, identify missing information and prepare questions for the agent.
Investment Insights
Based on property information with market context.
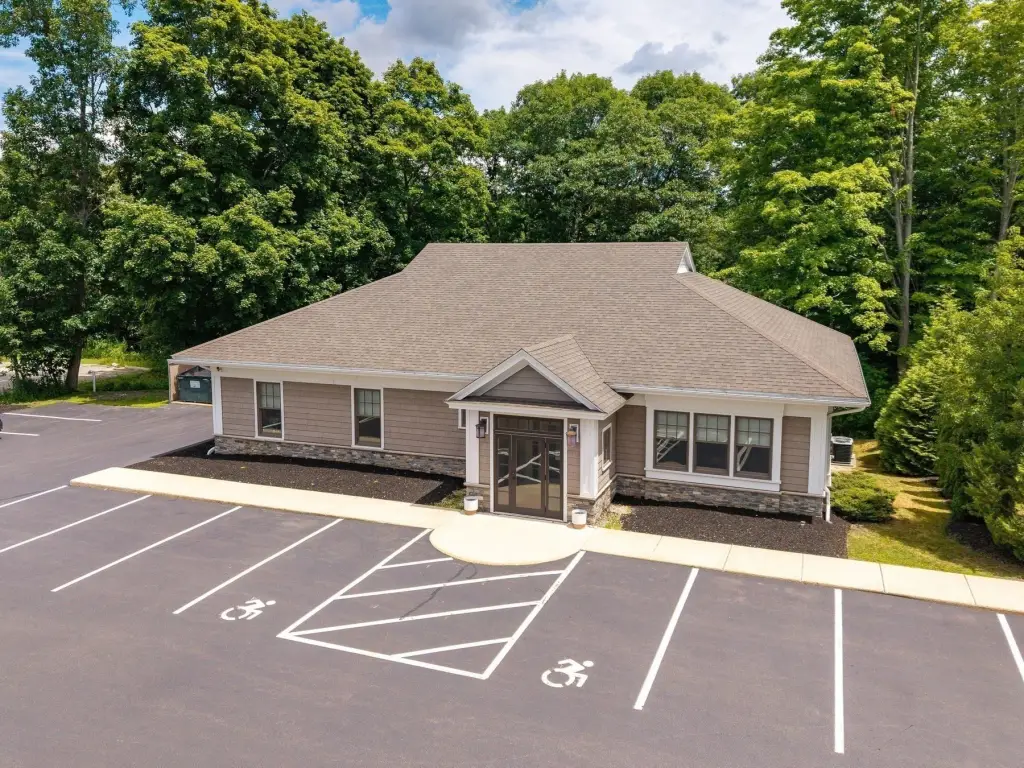
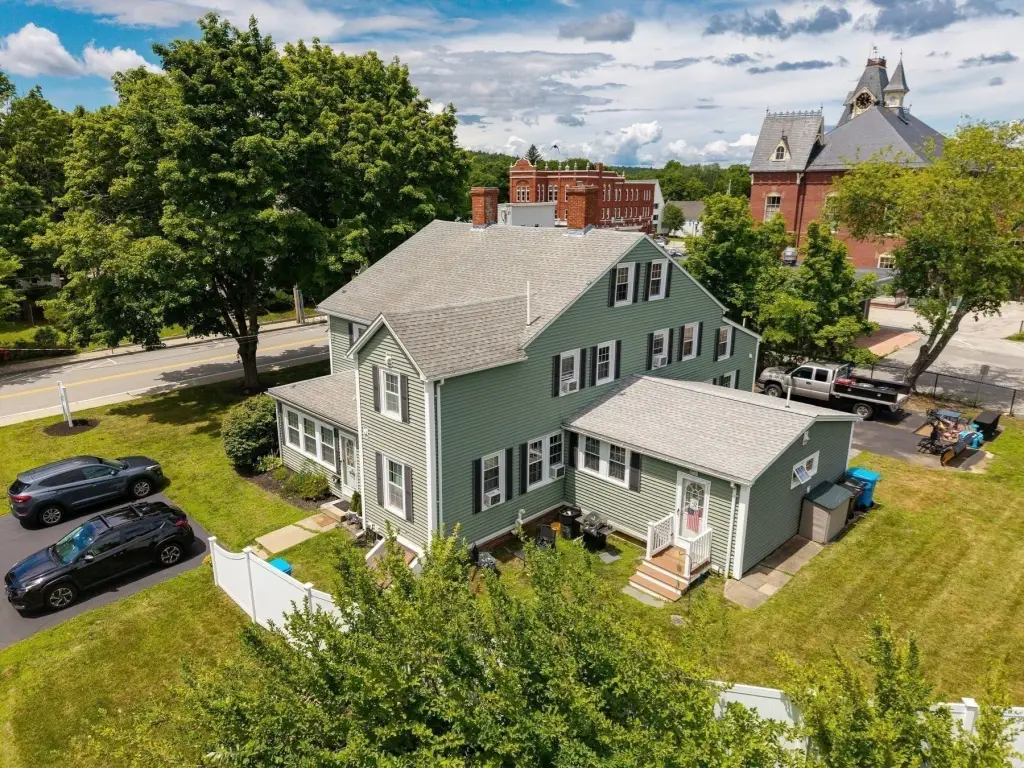
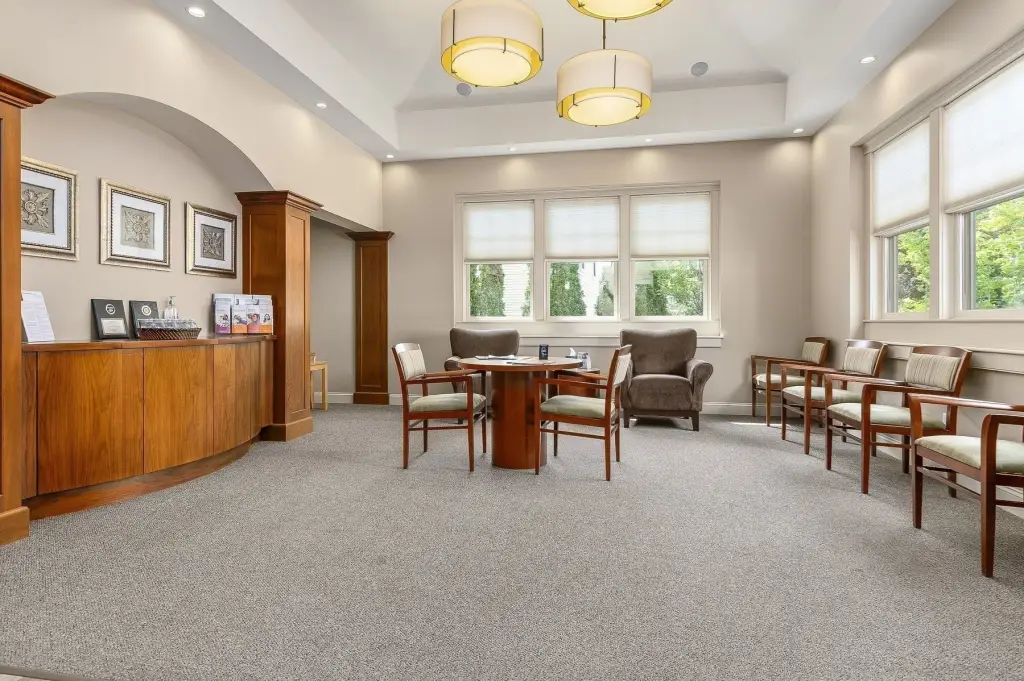
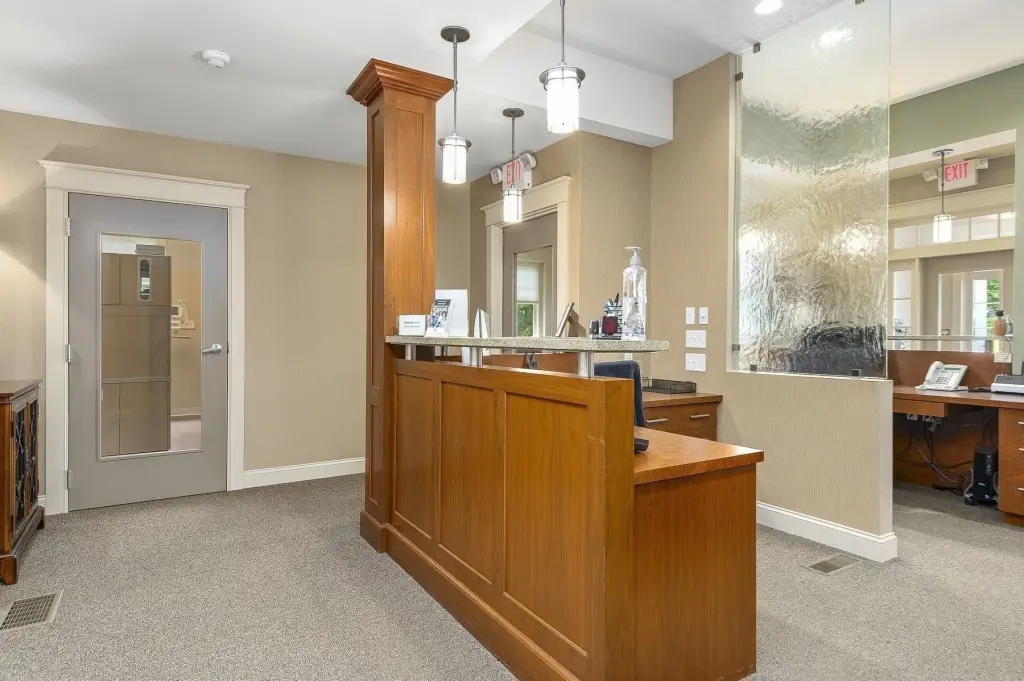
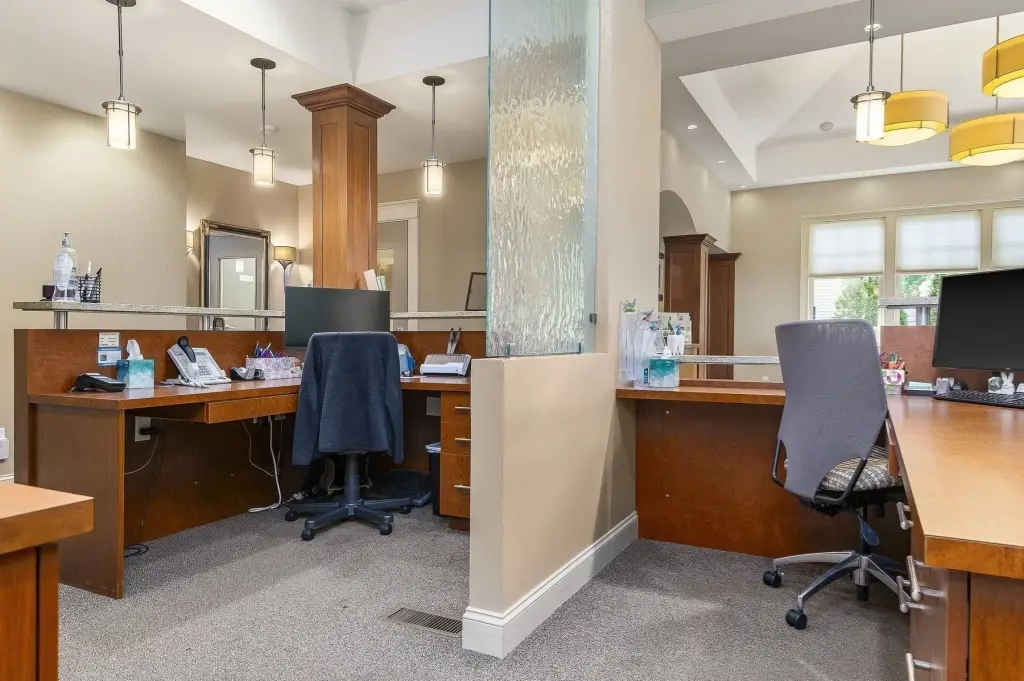
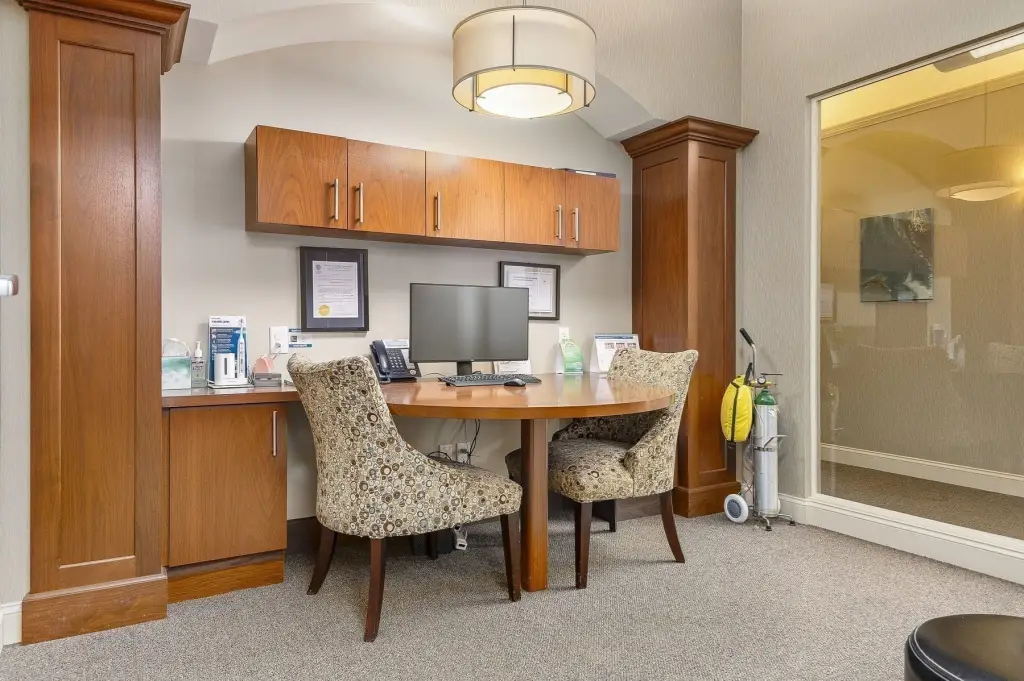
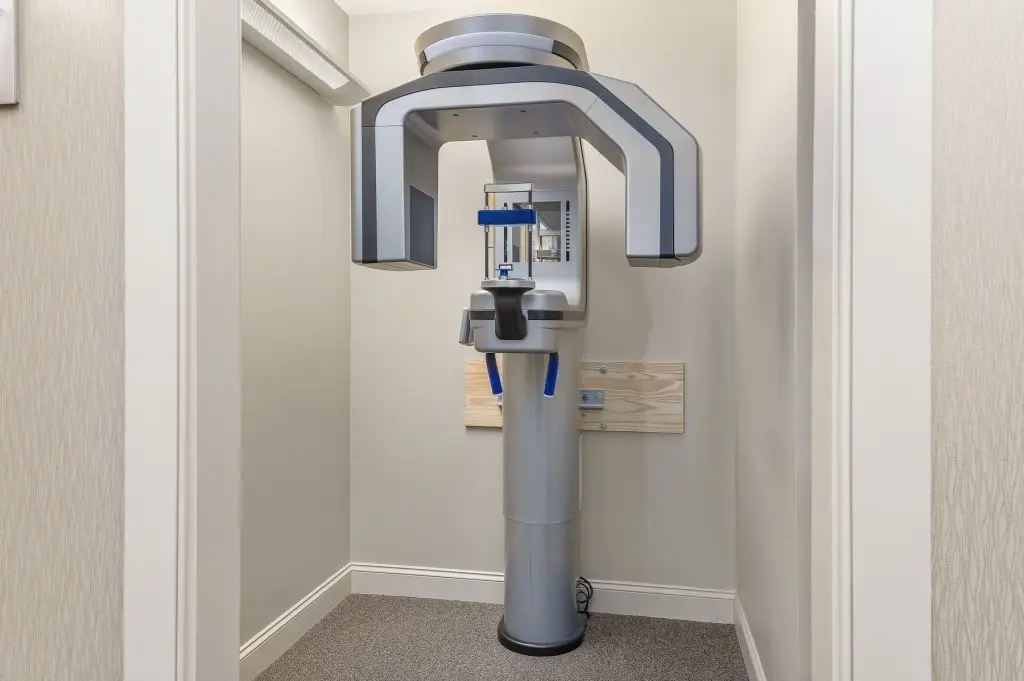
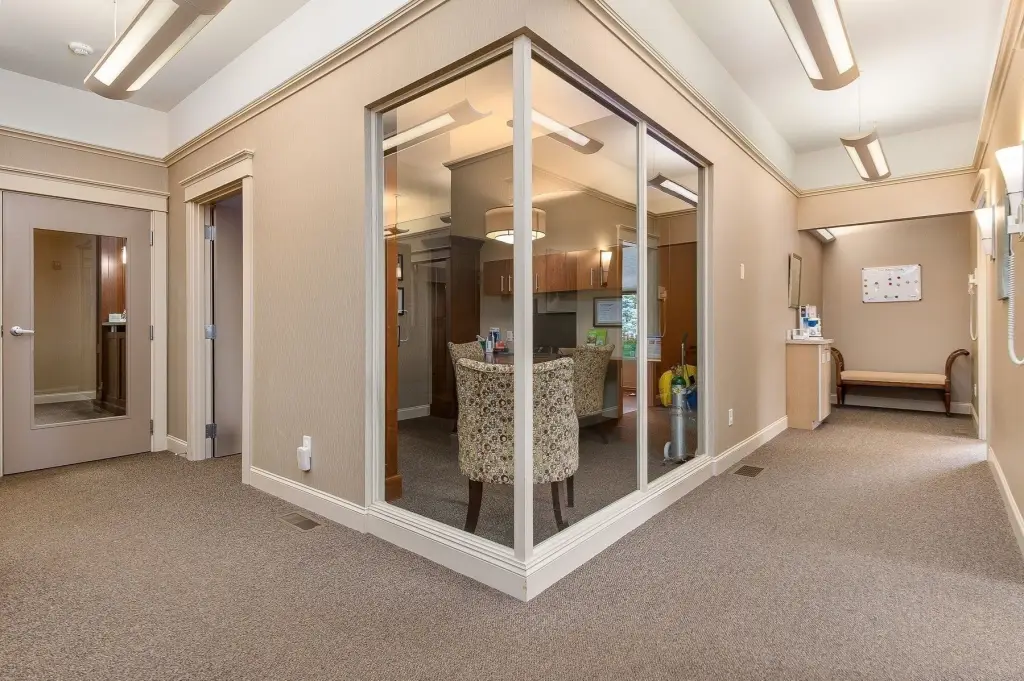
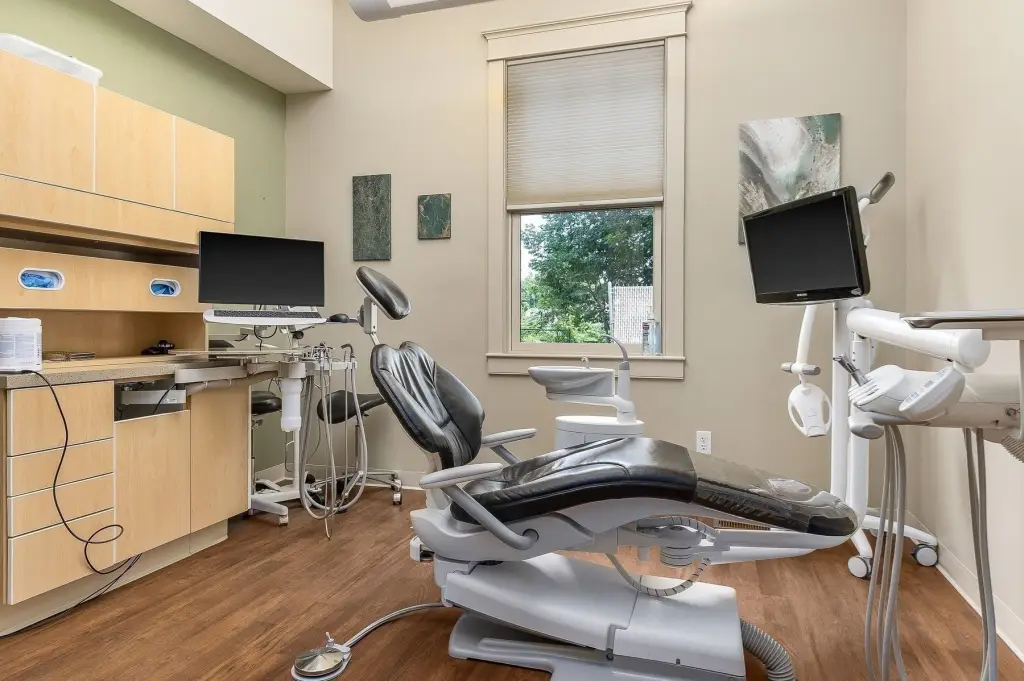
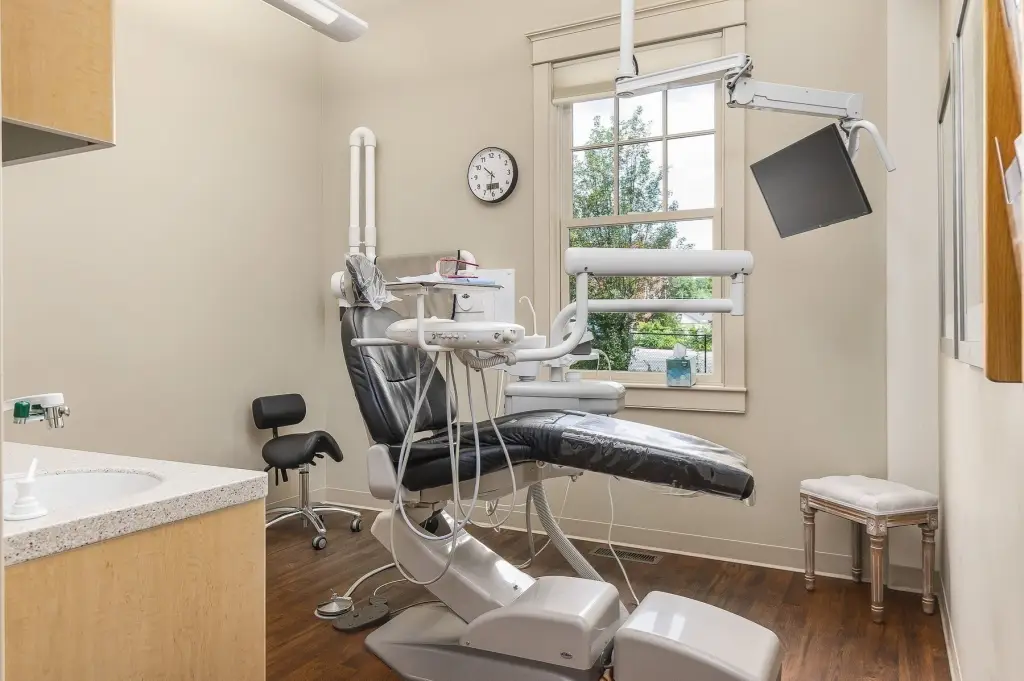
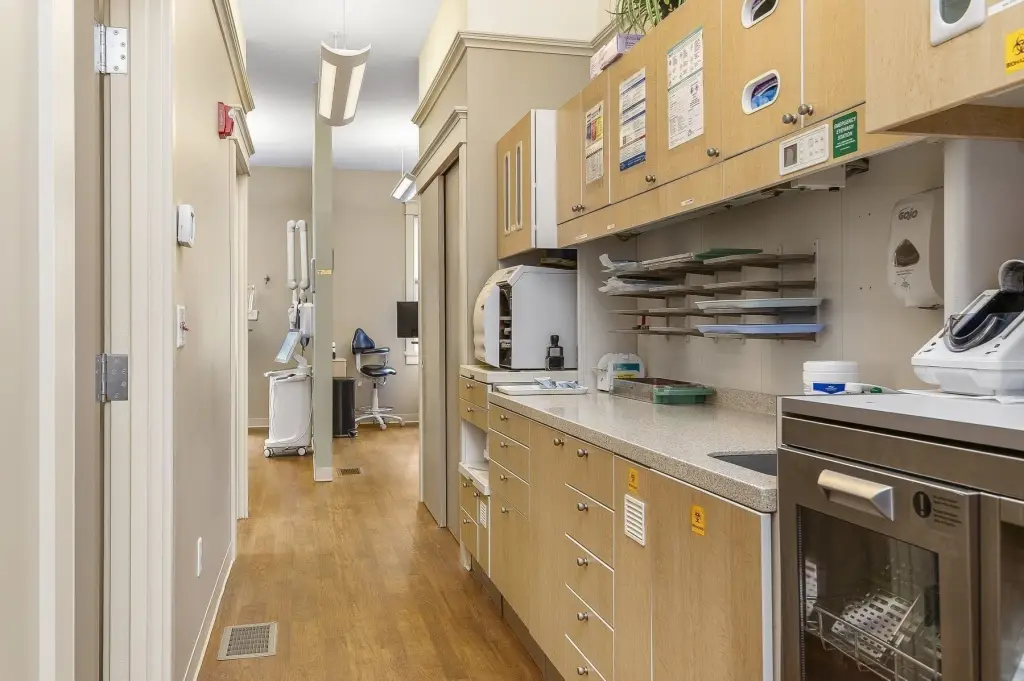
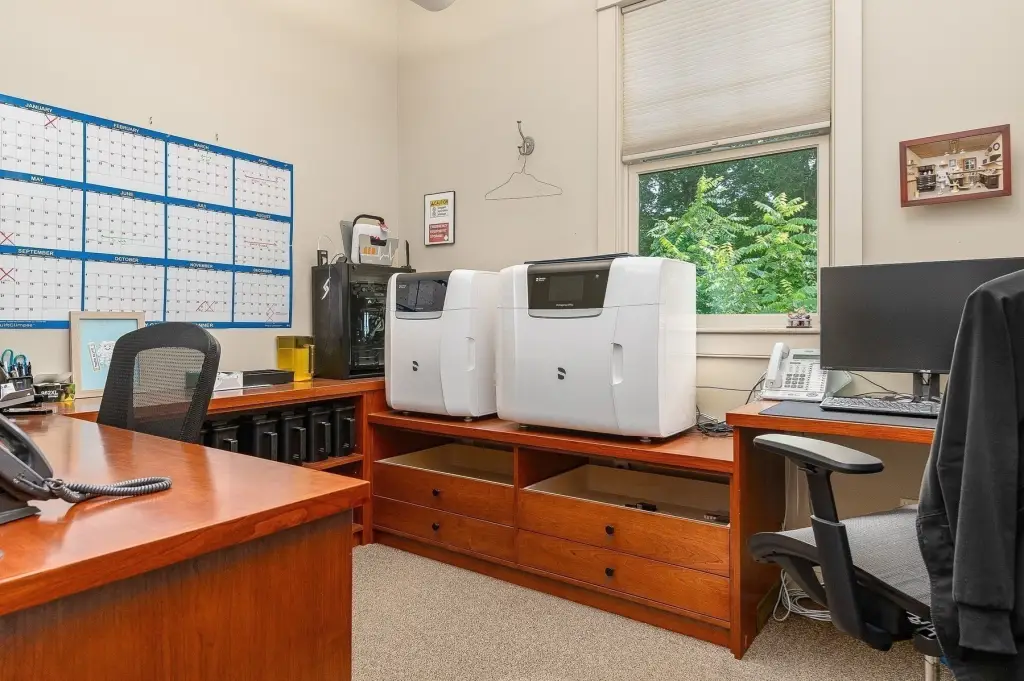
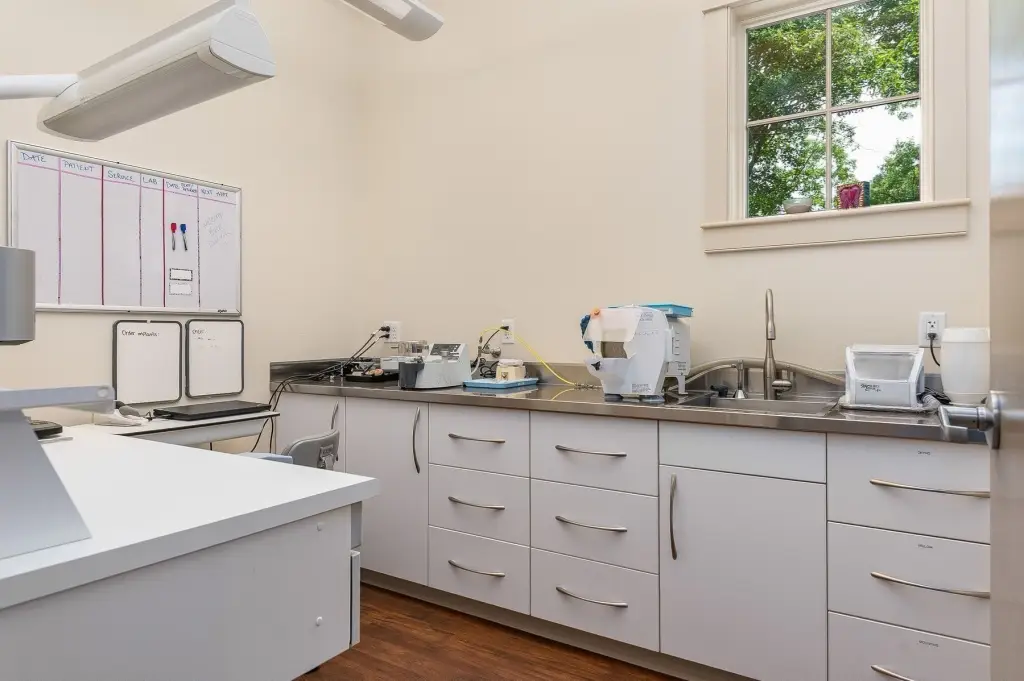
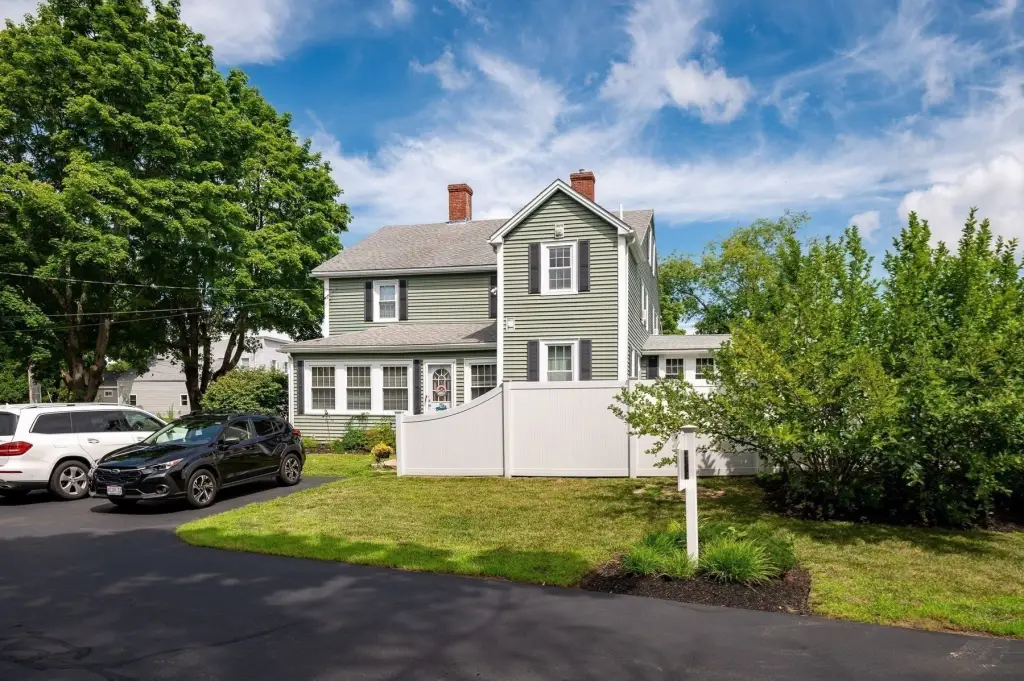
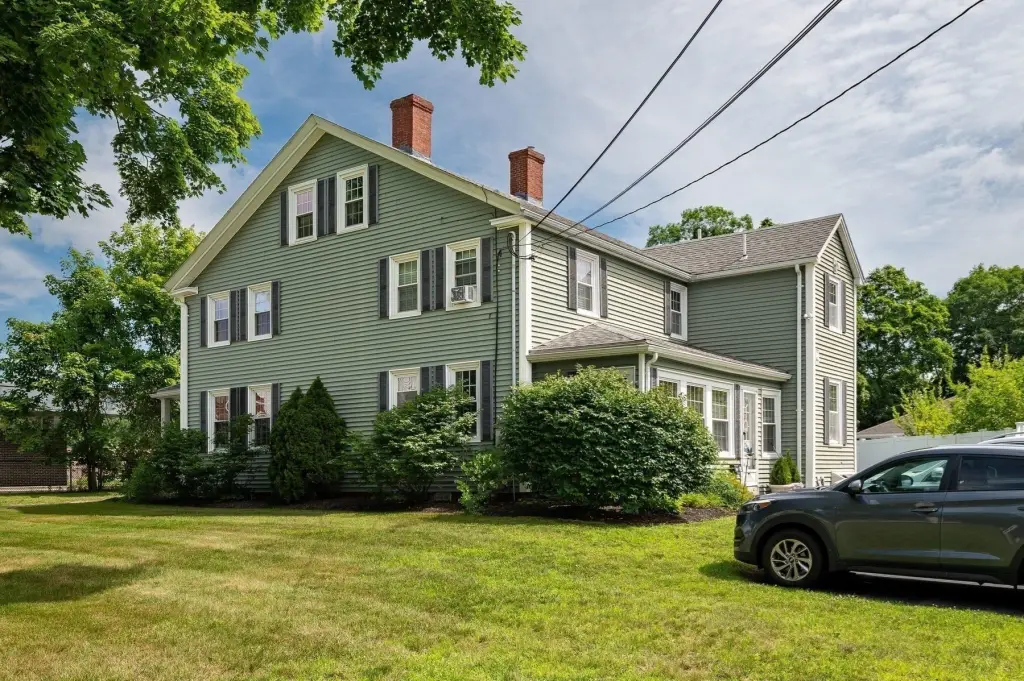
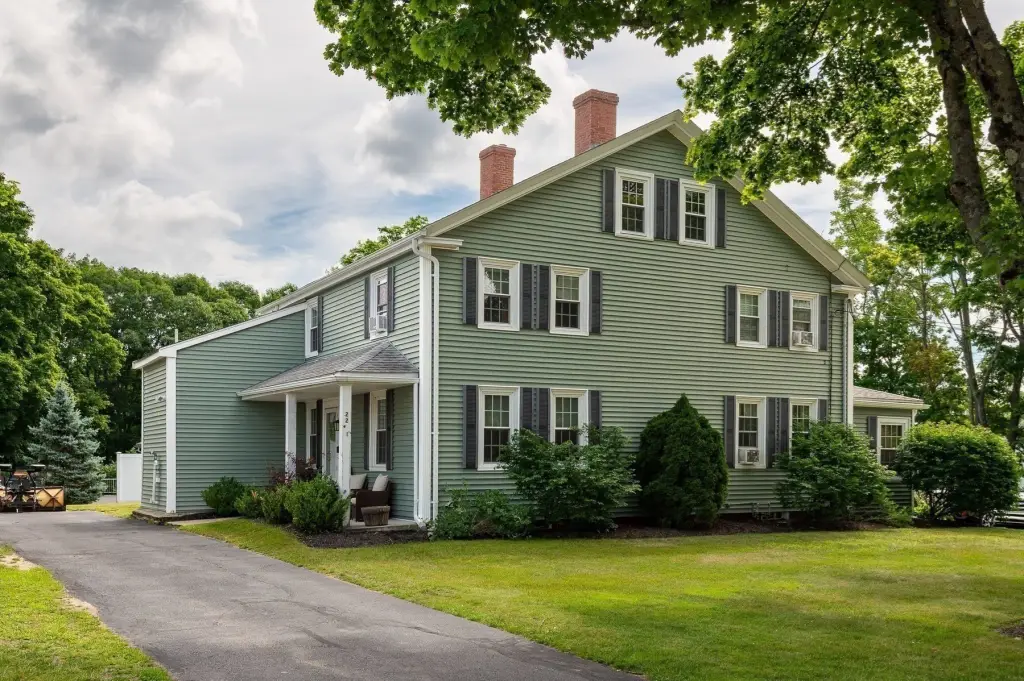
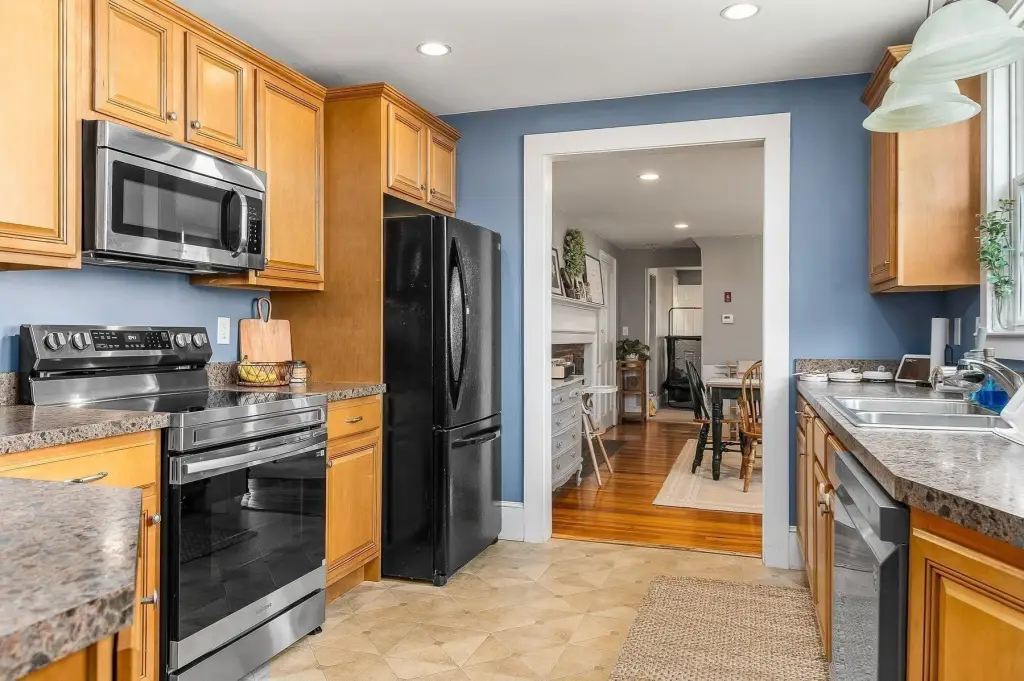
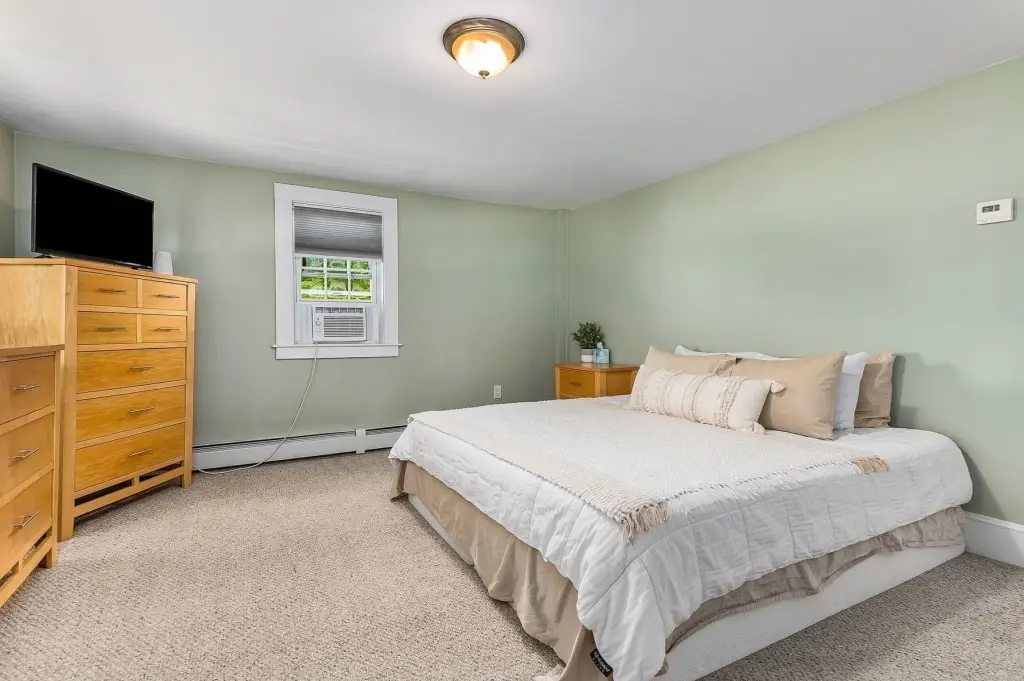
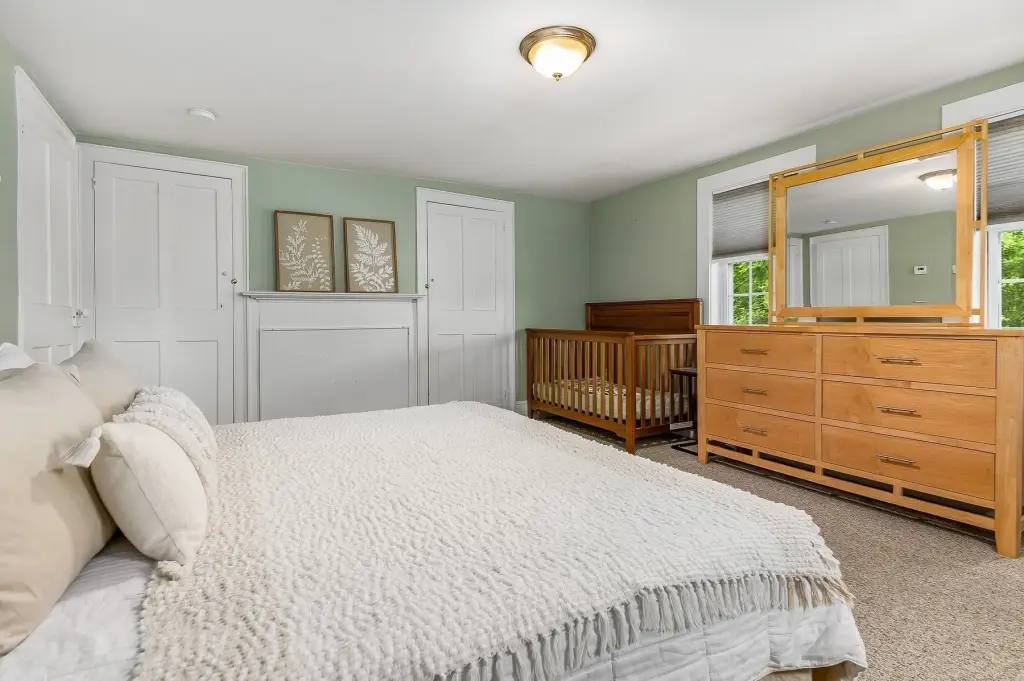
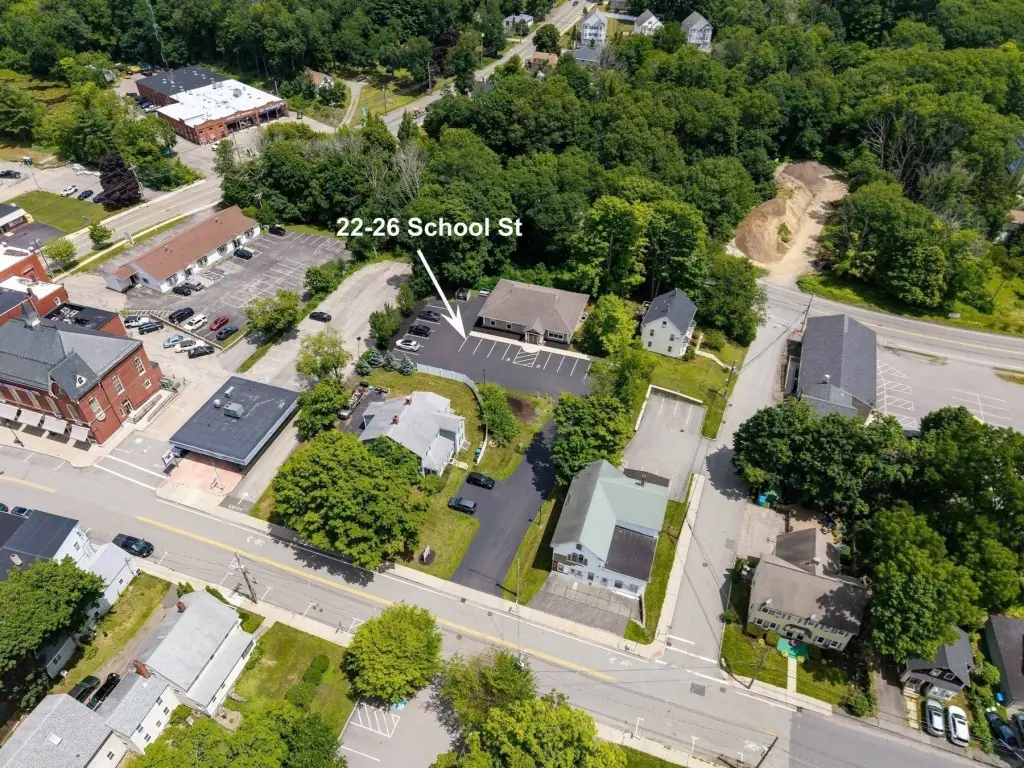
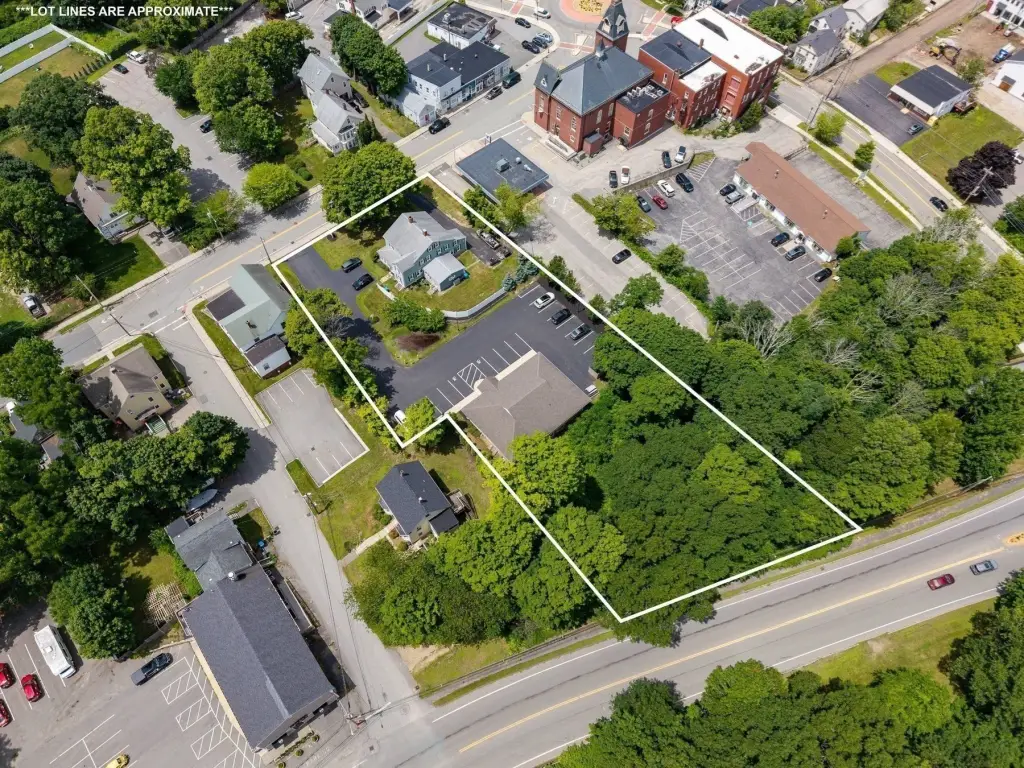
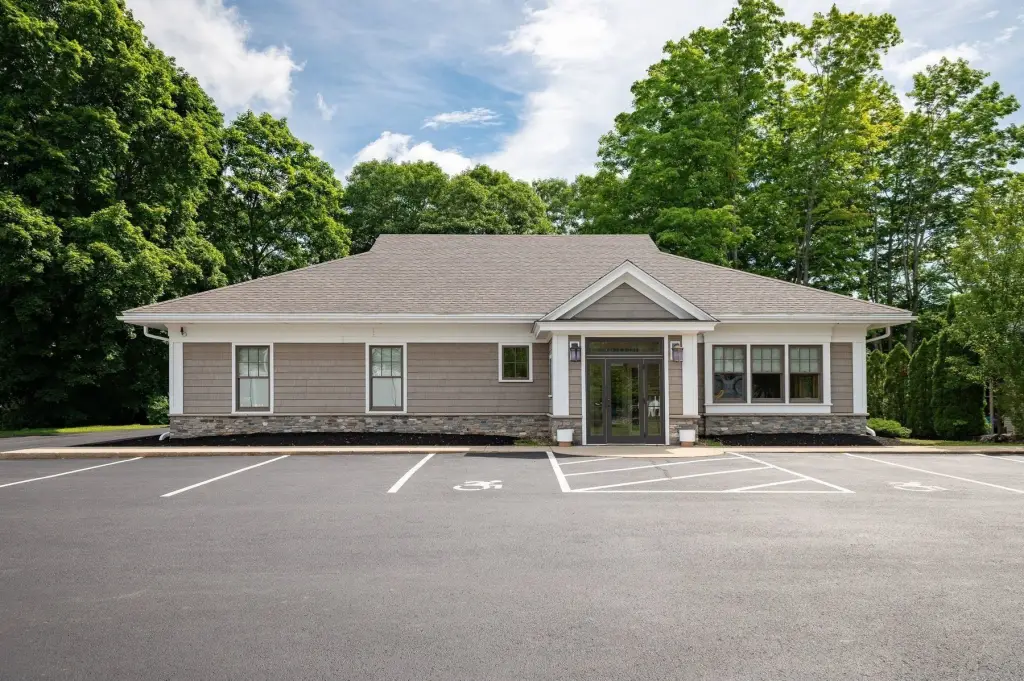
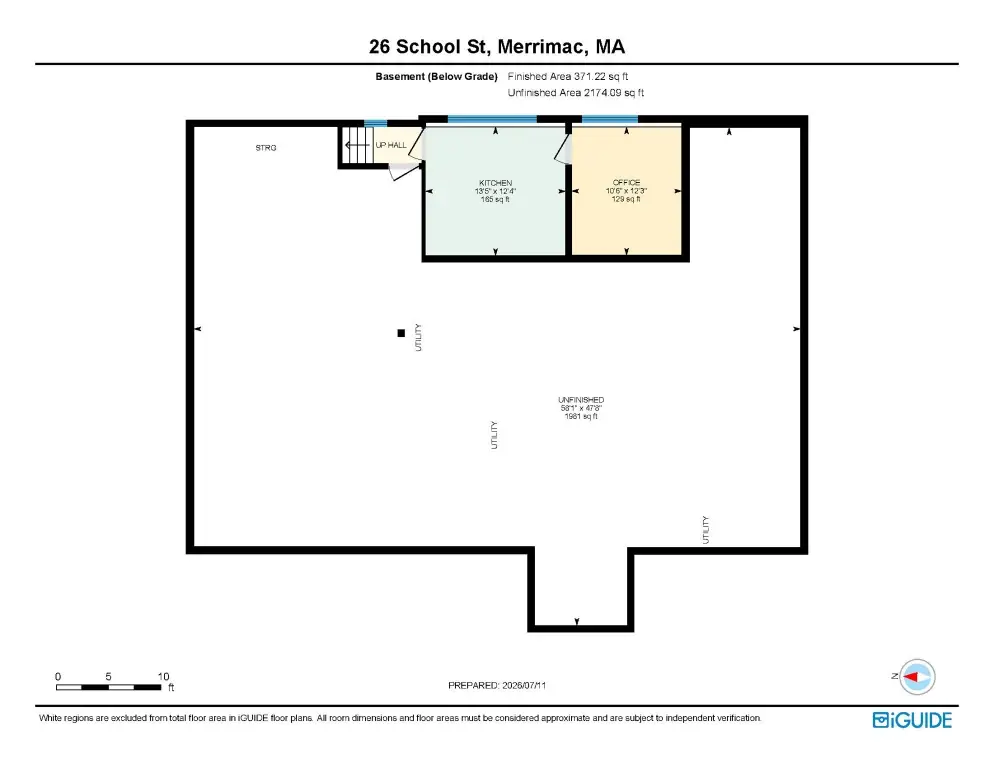
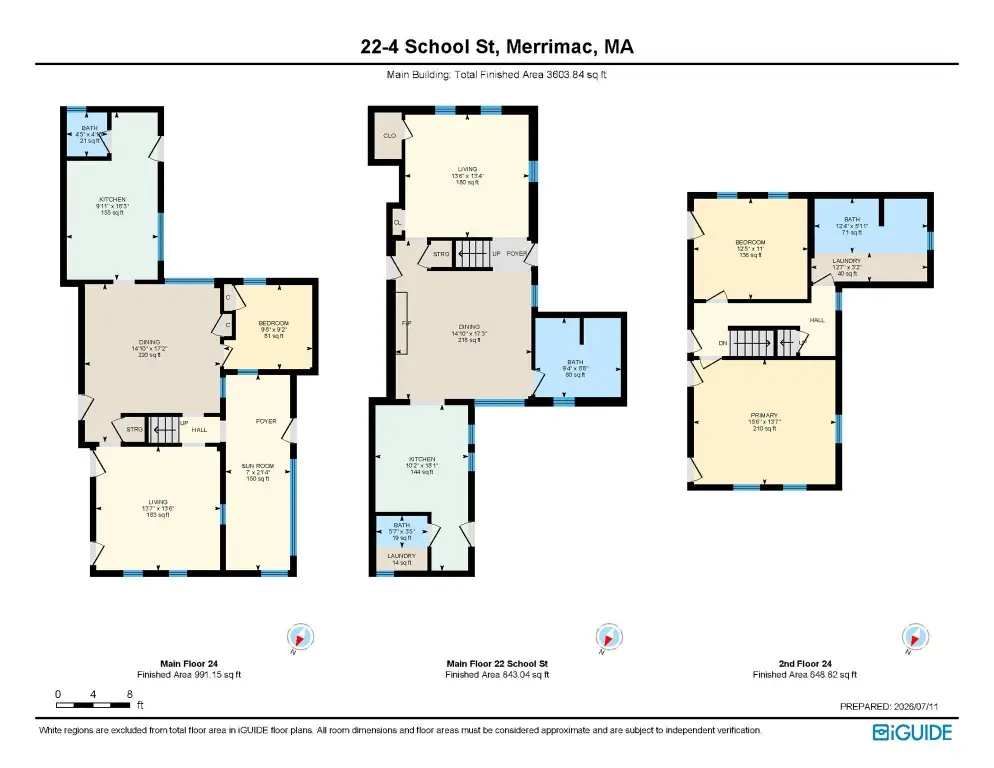
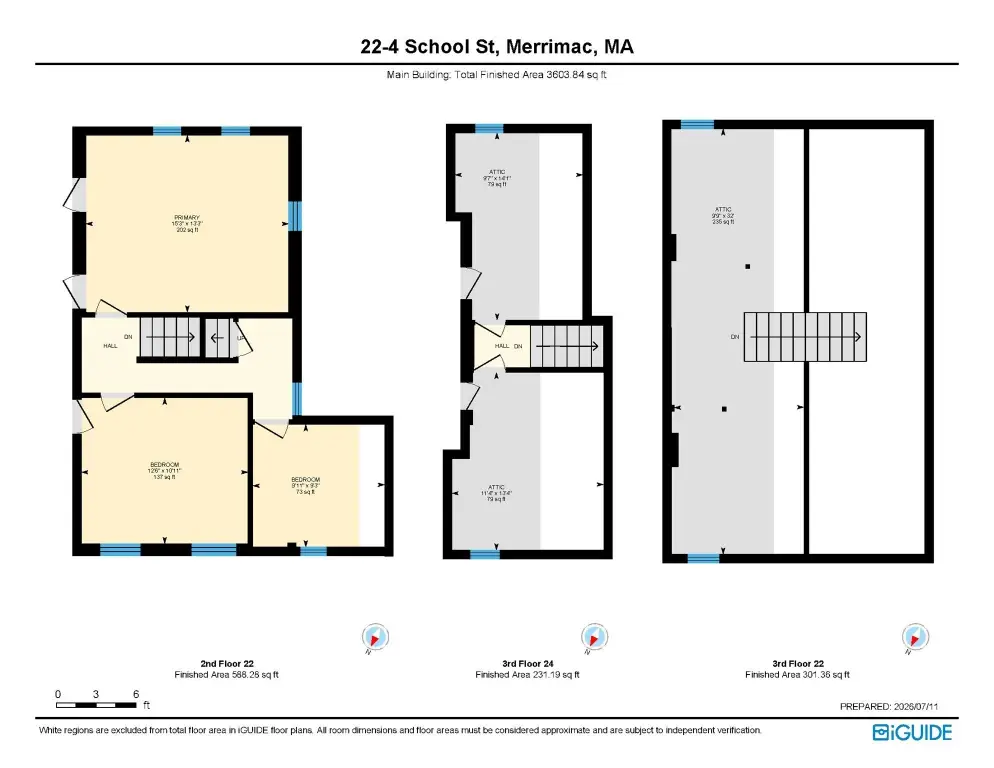
This Village Center-zoned mixed-use property includes two separate buildings totaling 6,721 square feet. The 2,962-square-foot professional office building was constructed in 2013 and is occupied by a dental practice. A separate 3,759-square-foot two-family residence contains one two-bedroom apartment and one four-bedroom apartment. The property was originally built in 1855.
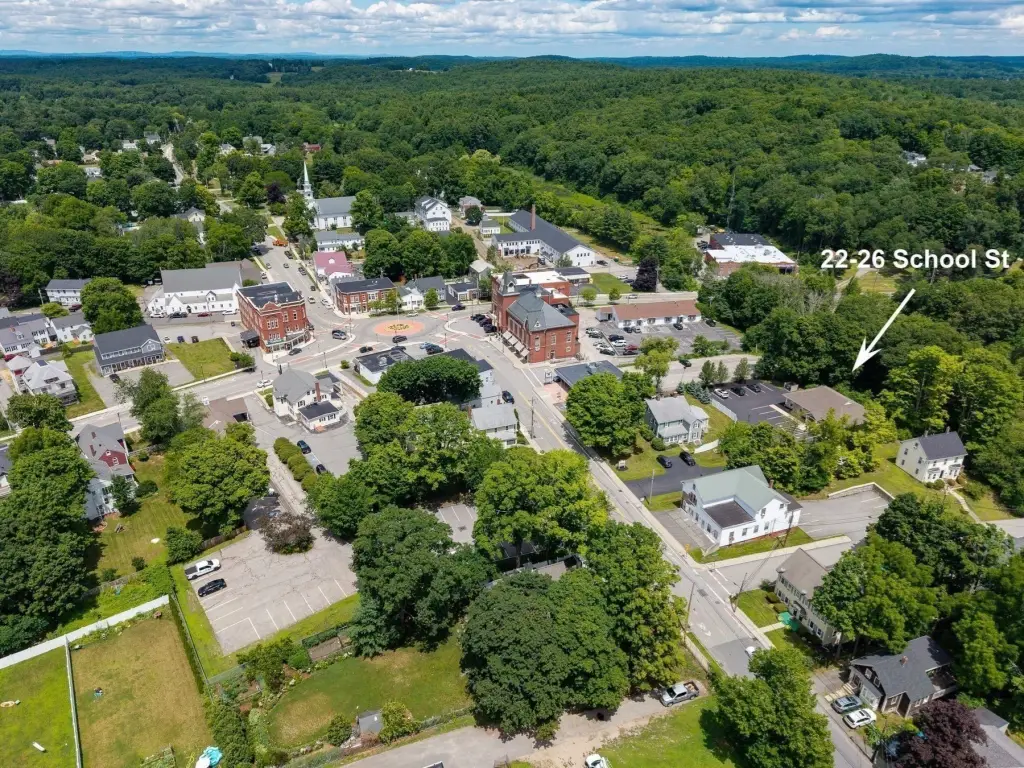
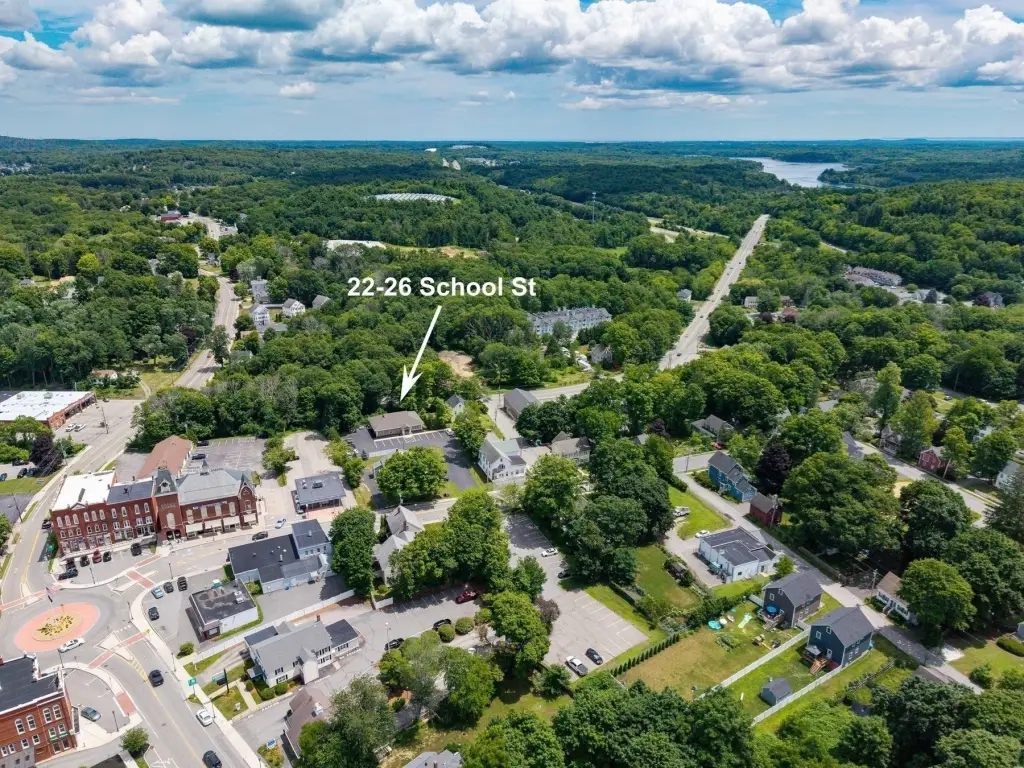
Located at 22-26 School St in Merrimac, the parcel has frontage on Broad St and access to I-495 and MA 110. Its position provides connectivity to Newburyport, Amesbury, Haverhill, and Southern NH. The commercial building’s trade fixtures belong to the tenant and do not transfer with the sale.
Located at 22-26 School St in Merrimac, the parcel has frontage on Broad St and access to I-495 and MA 110. Its position provides connectivity to Newburyport, Amesbury, Haverhill, and Southern NH. The commercial building’s trade fixtures belong to the tenant and do not transfer with the sale.
Key Highlights
- 6,721 SF mixed‑use property with separate office and residential buildings
- 2,962 SF professional office building constructed in 2013
- Office building leased to an established dental practice
Financial Insights
Estimated NOI and Cap Rate
NOI / Yr
$136,100
Cap Rate
7.07%
Suggested Prices Based on Cap Rates
Cap Rate 5%
$2,722,000
$2.7M
Cap Rate 7%
$1,944,286
$1.9M
Cap Rate 9%
$1,512,222
$1.5M
Market Conditions
NOI Build-Up for 6,721 SF
Gross rent
$242.0K $36.00/SF
− Vacancy
−$24.2K −$3.60/SF
EGI
$217.8K $32.40/SF
− OpEx
−$81.7K −$12.15/SF
NOI
$136.1K $20.25/SF
Area
Essex County, MA
Vacancy
10.00%
Lease Rate
$36.00 /SF/Yr
Expense Ratio
37.50%
Simulate Cap Rate and NOI
Suggested Prices Based on Cap Rates
Cap Rate 5%
$2,722,000
Cap Rate 7%
$1,944,286
Cap Rate 9%
$1,512,222
Alternative Uses
Best Use
Office B
$2.68M
$2.34M – $3.12M
NOI $187,334 @ 7.0% cap · market cap 9.73%
Second Best
Mixed Use
$1.94M
$1.70M – $2.27M
NOI $136,100 @ 7.0% cap · market cap 7.07%
Theoretical Best
Office A
$3.98M
$3.48M – $4.64M
NOI $278,517 @ 7.0% cap · market cap 14.47%
Zoning and permitted uses should be independently verified with authorities.
How Realmo checks its estimates
Property Analytics
Unlock full access to Insights
Subscribe to Realmo Intelligence
Open Analytics
Current Use
Lease Details
Single-tenant
Tenancy
Yes
Highway access
Yes
Paved road access
Location Intelligence
Trade Area within ½ mile
209
Businesses Nearby
Explore this area
Business Placement
Demographics for 01860, MA
6,723
Population
2,851
Households
2.4
Avg Household Size
47
Median Age
37%
College-Educated
95%
High-School Grad
8.5 sq mi
ZIP Area
791
Density / Sq Mi
$116,477
Median Household Income
$60,643
Median Earnings
$1,236
Median Rent
$531,300
Median Home Value
Check the figures for this property
Cap Rate, Value Estimation, Potential NOI and more
View Realmo Analytics
Market
Vacancy Rate% for Office in Northeast region


Frequently Asked Questions
What type of property is this?
Mixed-use property - Village Center-zoned asset combining leased professional office space with two residential apartments.
Where is this mixed-use property located?
The property is located at 22-26 School St Merrimac, MA.
What is the asking price?
The asking price for this property is $1,925,000.
What are key features of this property?
This property features: 6,721 SF mixed‑use property with separate office and residential buildings; 2,962 SF professional office building constructed in 2013; Office building leased to an established dental practice