Nursing Home Property with Two
For Sale
$937,000
219 Bass Rd, Florence, MS 39073
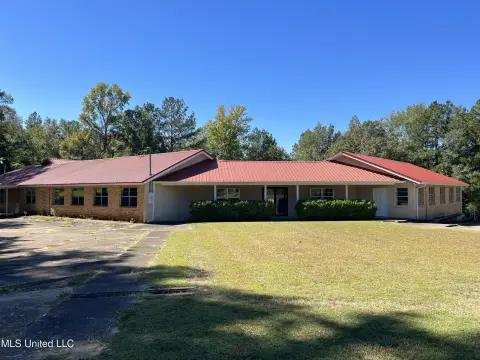
Two updated brick residences provide extensive group accommodations, shared gathering areas, and separate kitchen and laundry facilities.
Property Size7,401 SF
Price / SF$126.60
Days on Market88
Property Features for 219 Bass Rd
General Information
Standard status
Active
Size
7,401 SF
Listing Agency:
NextHome Realty Experience
Listed By:
Ryan Porter · License #B22802
(601) 238-6620
Source:
Fiorellaavenue
Added: Jul 20
Changed: Oct 3
Last Checked: Oct 7 at 2:28PM
Displayed information is deemed reliable but is not guaranteed and should be independently verified. All listing content including descriptions, pricing, images are the copyrighted material of NextHome Realty Experience

Ask AI about this property
Review the available facts, identify missing information and prepare questions for the agent.
Investment Insights
Based on property information with market context.
Located at 219 Bass Rd in Florence, MS, this five-acre property includes two substantial brick residences of approximately 3,000 square feet each. Both homes have new roofs and layouts suited to large-group occupancy. The first residence contains six bedrooms, 16 closets, three full bathrooms, a dining and entertainment room, kitchen, and dedicated laundry room. The second offers six oversized bedrooms, 16 closets, three remodeled bathrooms, two kitchen areas, laundry hookups for three washers and three dryers, a dining room, den with fireplace, screened-in back porch, and new central HVAC.
Three mobile homes are positioned behind the second house and require rehabilitation before use. The property was previously operated as a country nursing home and includes accommodations described as capable of housing 30+ people. Its acreage, multiple residences, and extensive common-area features create a substantial existing framework for continued care-related use or other group-oriented applications explicitly contemplated for the property.
Three mobile homes are positioned behind the second house and require rehabilitation before use. The property was previously operated as a country nursing home and includes accommodations described as capable of housing 30+ people. Its acreage, multiple residences, and extensive common-area features create a substantial existing framework for continued care-related use or other group-oriented applications explicitly contemplated for the property.
Key Highlights
- Five‑acre property at 219 Bass Rd, Florence, MS 39073
- Two brick homes, each approximately 3,000 square feet
- Each residence includes six bedrooms, 16 closets, and three bathrooms
Financial Insights
Estimated NOI and Cap Rate
NOI / Yr
$83,461
Cap Rate
8.91%
Suggested Prices Based on Cap Rates
Cap Rate 5%
$1,669,220
$1.7M
Cap Rate 7%
$1,192,300
$1.2M
Cap Rate 9%
$927,344
$927.3K
Market Conditions
NOI Build-Up for 7,401 SF
Gross rent
$155.4K $21.00/SF
− Vacancy
−$16.3K −$2.21/SF
EGI
$139.1K $18.80/SF
− OpEx
−$55.6K −$7.52/SF
NOI
$83.5K $11.28/SF
Area
Rankin County, MS
Vacancy
10.50%
Lease Rate
$21.00 /SF/Yr
Expense Ratio
40.00%
Simulate Cap Rate and NOI
Suggested Prices Based on Cap Rates
Cap Rate 5%
$1,669,220
Cap Rate 7%
$1,192,300
Cap Rate 9%
$927,344
Alternative Uses
Best Use
Healthcare Medical
$1.19M
$1.04M – $1.39M
NOI $83,461 @ 7.0% cap · market cap 8.91%
Second Best
—
—
no second resolved use
Theoretical Best
Office A
$2.03M
$1.78M – $2.37M
NOI $142,099 @ 7.0% cap · market cap 15.17%
Zoning and permitted uses should be independently verified with authorities.
How Realmo checks its estimates
Property Analytics
Unlock full access to Insights
Subscribe to Realmo Intelligence
Open Analytics
Current Use
Location Intelligence
Trade Area within ½ mile
7
Businesses Nearby
Well-served
Demand for This Use
Explore this area
Business Placement
Demographics for 39073, MS
20,613
Population
8,707
Households
2.4
Avg Household Size
40
Median Age
21%
College-Educated
85%
High-School Grad
161.1 sq mi
ZIP Area
128
Density / Sq Mi
$72,099
Median Household Income
$38,123
Median Earnings
$886
Median Rent
$180,900
Median Home Value
Check the figures for this property
Cap Rate, Value Estimation, Potential NOI and more
View Realmo Analytics


Frequently Asked Questions
What type of property is this?
Nursing home - Two updated brick residences provide extensive group accommodations, shared gathering areas, and separate kitchen and laundry facilities.
Where is this nursing home located?
The property is located at 219 Bass Rd Florence, MS.
What is the asking price?
The asking price for this property is $937,000.
What are key features of this property?
This property features: Five‑acre property at 219 Bass Rd, Florence, MS 39073; Two brick homes, each approximately 3,000 square feet; Each residence includes six bedrooms, 16 closets, and three bathrooms