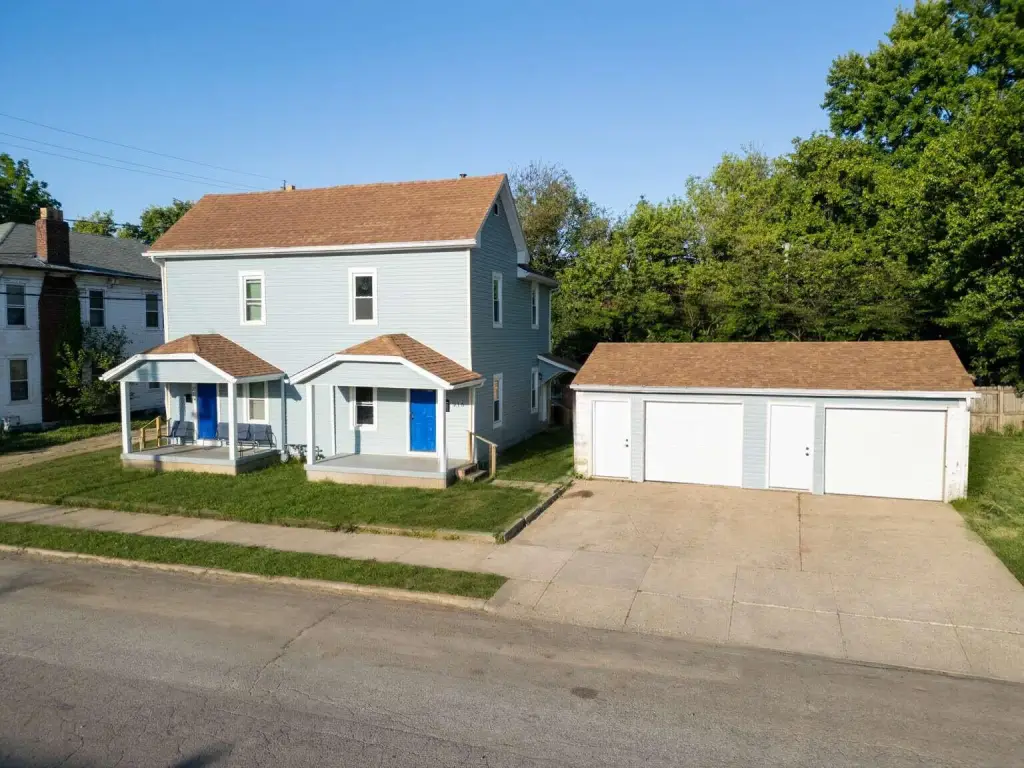
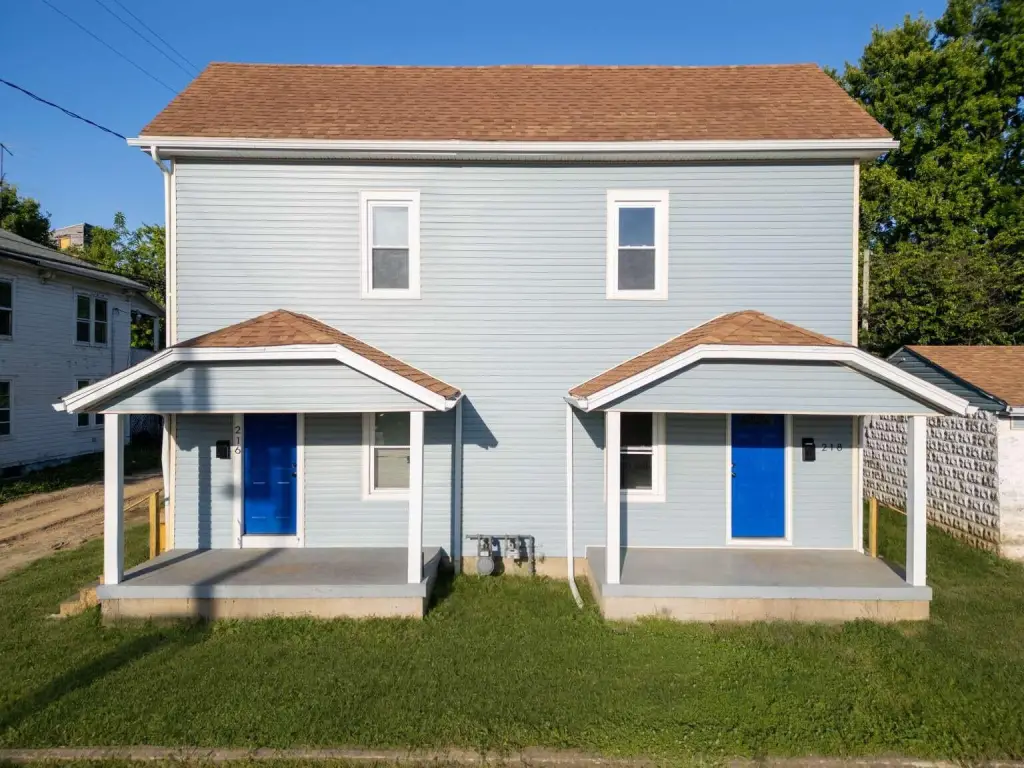
Remodeled Duplex with New
For Sale
$259,950
218 N Jackson Street, Springfield, OH 45504
Multi-Family, Springfield, OH
Property Size2,400 SF
Lot Size0.01 Acres
Price / SF$108.31
Days on Market96
Property Features for 218 N Jackson Street
General Information
Property type
Residential Multi Family
Property subtype
Other
Bedrooms
8
Bathrooms
4
Full bathrooms
4
Rooms
Bedroom 1, Bathroom 1, Bedroom 3, Bathroom 3, Bathroom 4, Bedroom 4, Bedroom 5, Bedroom 6, Bathroom 2, Bedroom 7, Bedroom 2, Bedroom 8
Basement
Full
Appliances
Dryer, Microwave, Range, Refrigerator
Elementary school district
1206 Springfield CSD
Middle school district
1206 Springfield CSD
High school district
1206 Springfield CSD
Directions
From: Clark County Fairgrounds, Exit the parking lot, Turn left, Turn left onto State Rte 41 N, Turn right onto S Belmont Ave, Turn left onto US-40 W/E Main St, Turn right onto N Jackson St, Destination will be on the right
Subdivision
011 N O MAIN / W OF LIMESTONE
Standard status
Active
APN
3400600005417026
Size
2,400 SF
Lot size
0.01 Acres
Taxes and HOA fees
Tax Year
2025
Utilities
Sewer type
Public Sewer
Heating system
Forced Air
Building Details
Year built
1913
Number of units
2
Flooring type
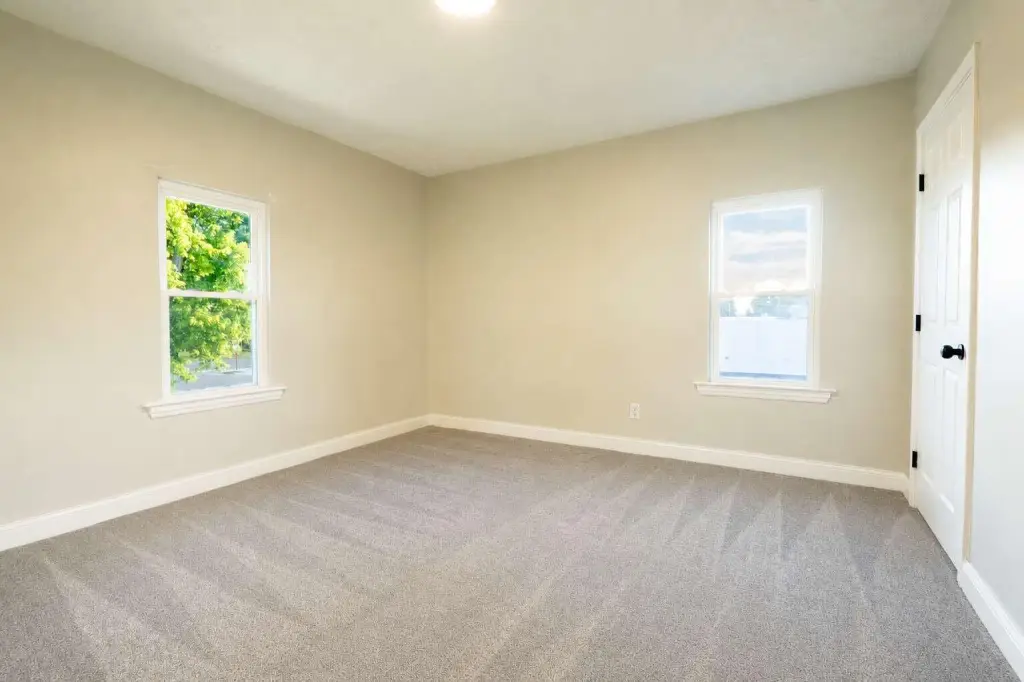
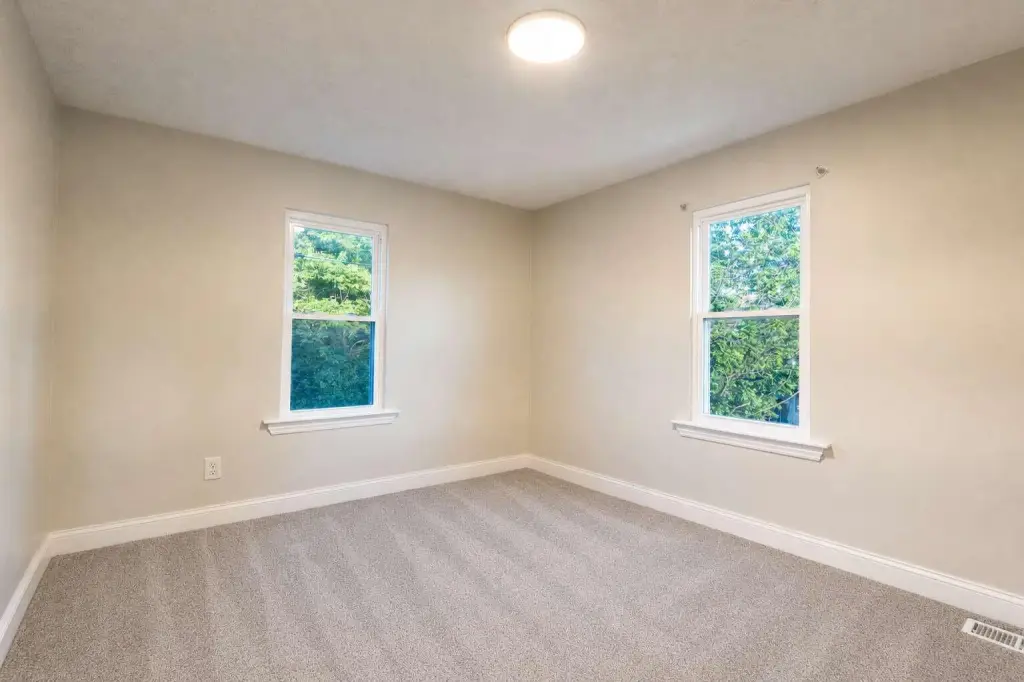
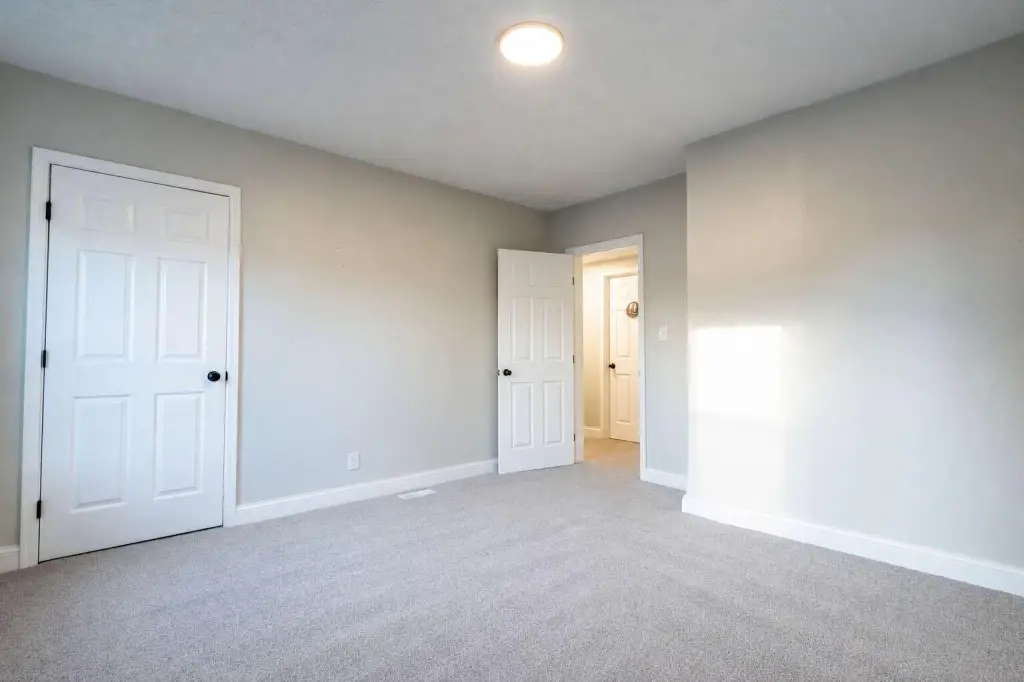
Carpet, Laminate, Tile
Building materials
Vinyl Siding
Listing Agency:
Chosen Real Estate Group
(330) 249-3499
Listed By:
Nicholas Huscroft · License #346906
(330) 858-5322
Added: Jul 3
Changed: Sep 16
Last Checked: Oct 6 at 2:06PM
MLS# 1046845
Copyright © 2026 Western Regional Information System & Technology, Inc. All rights reserved. All information provided by the listing agent/broker is deemed reliable but is not guaranteed and should be independently verified.
Investment Insights
Based on property information with market context.
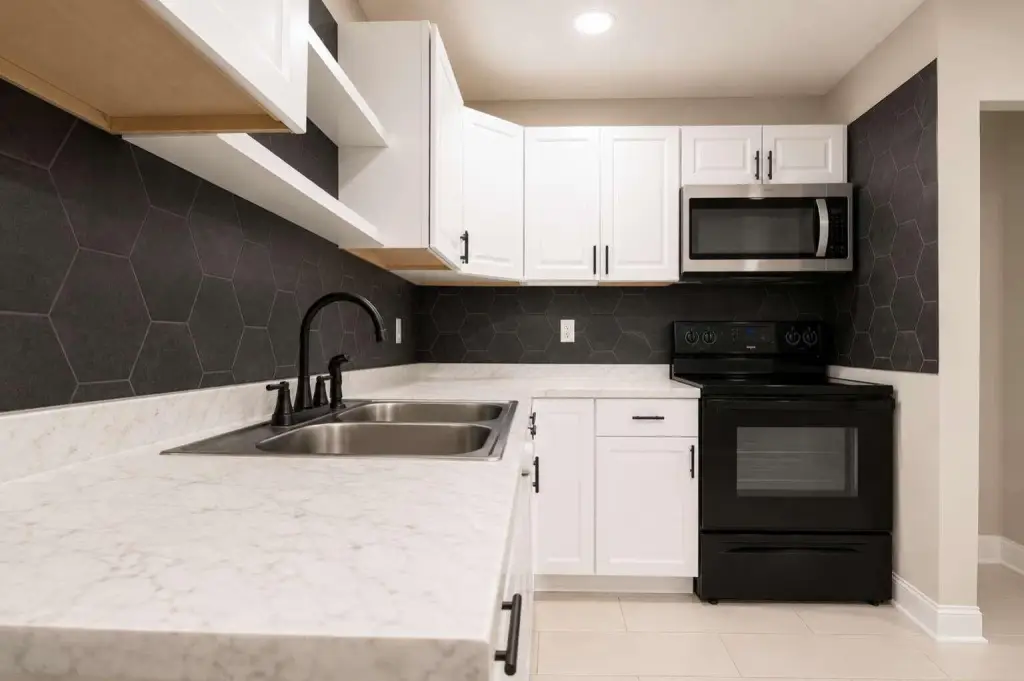
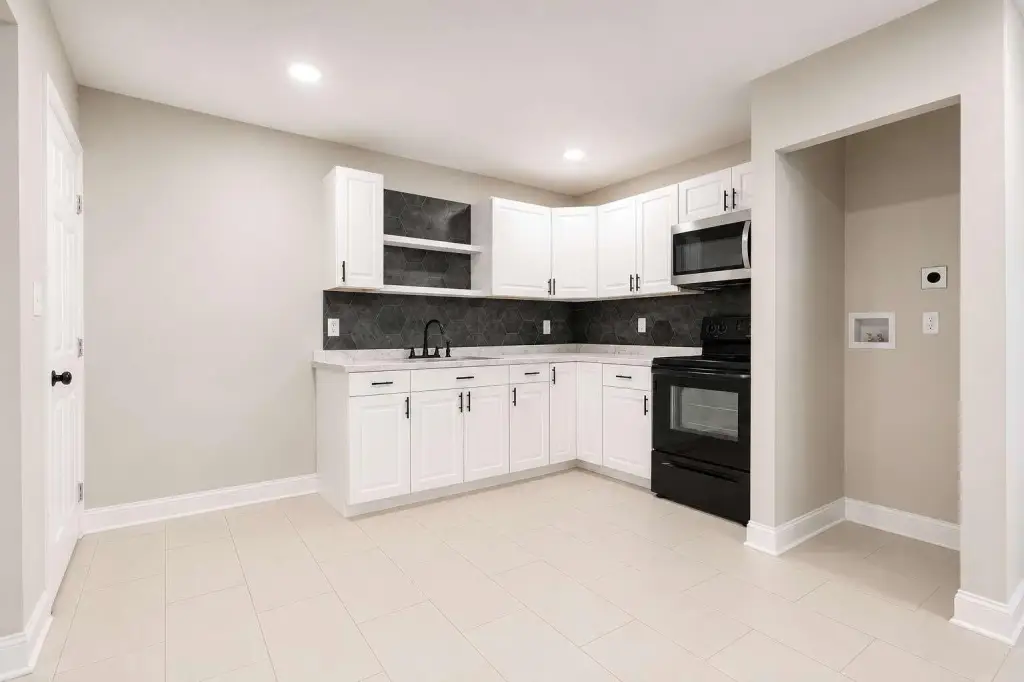
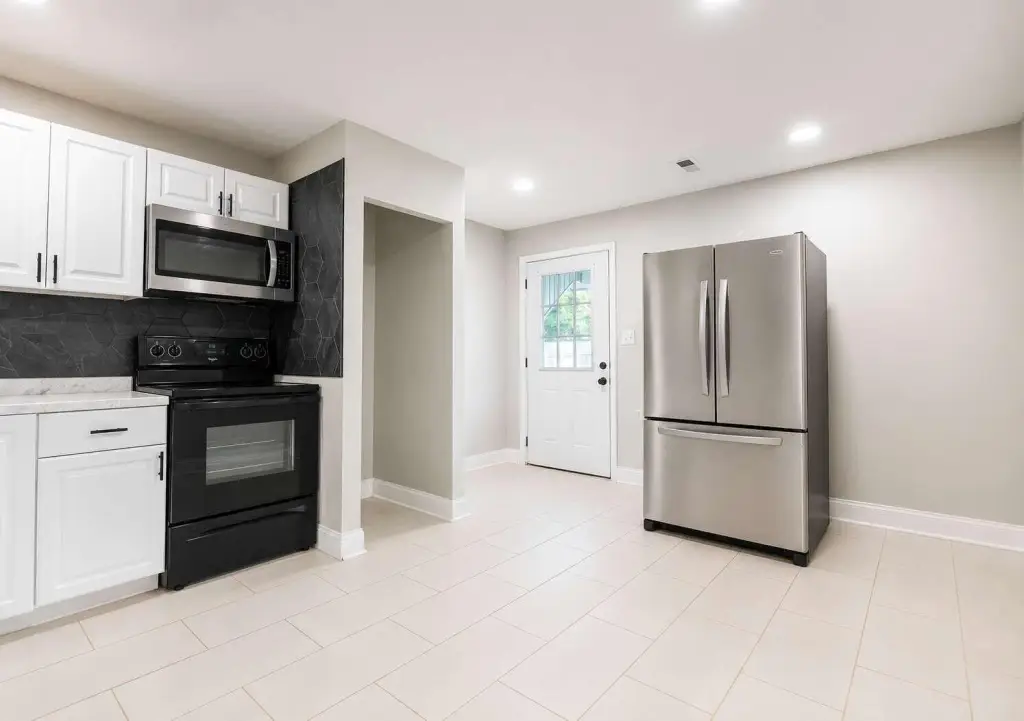
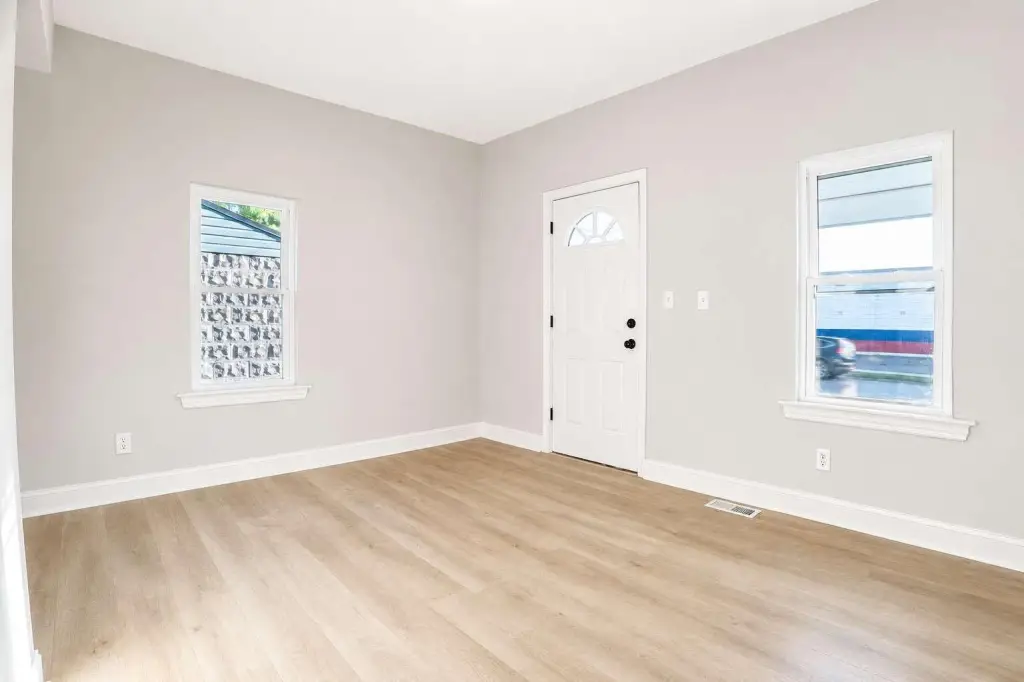
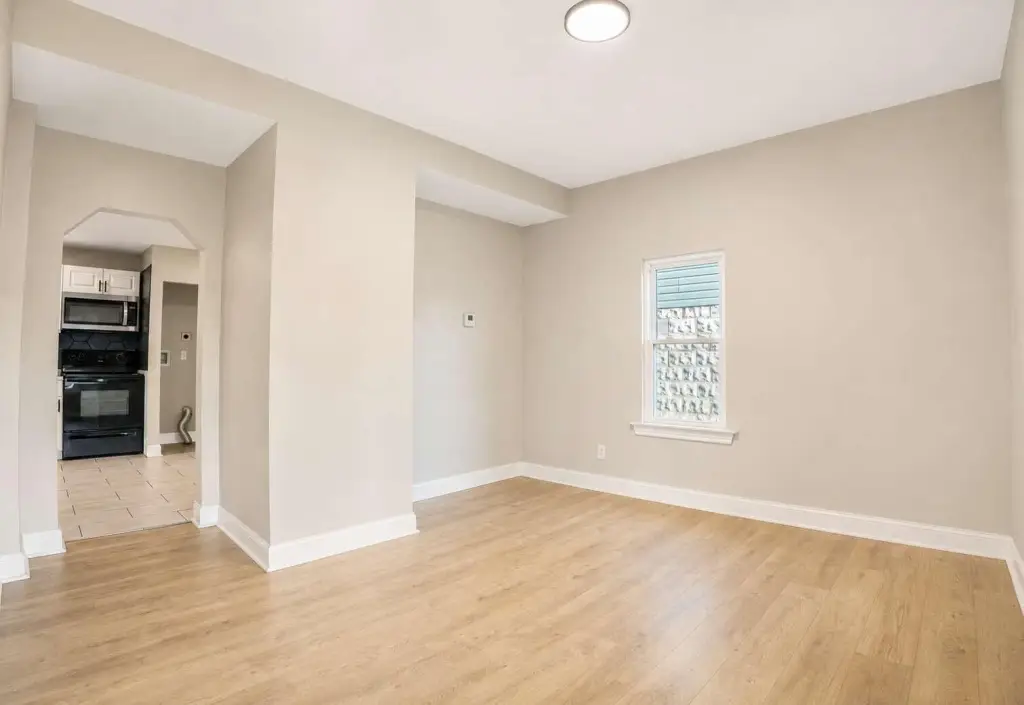
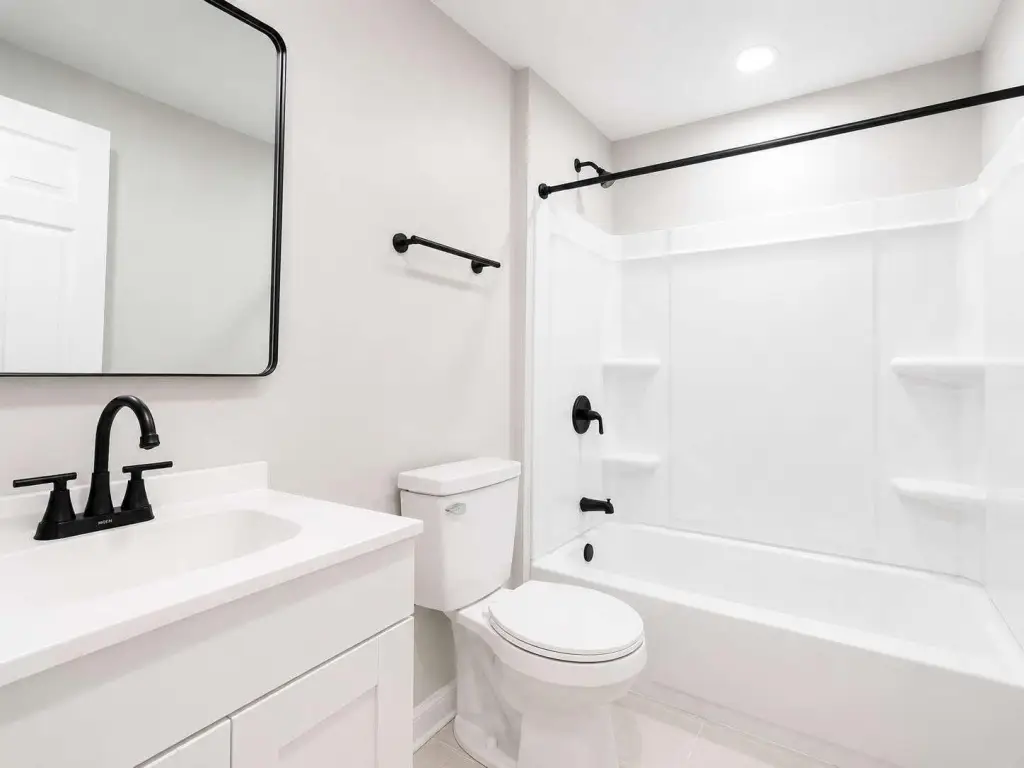
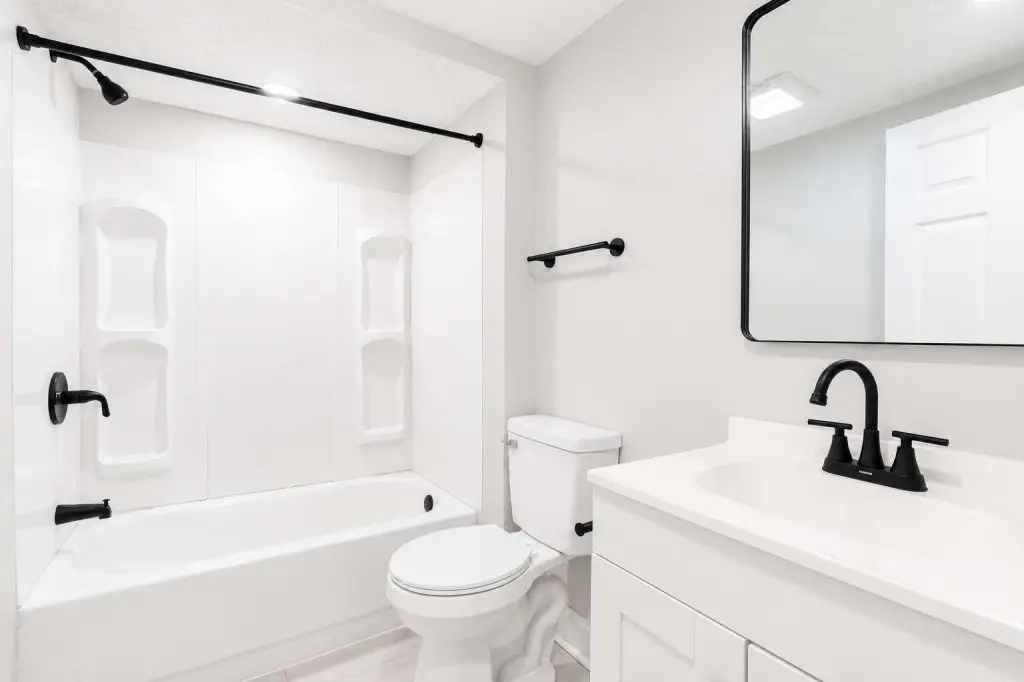
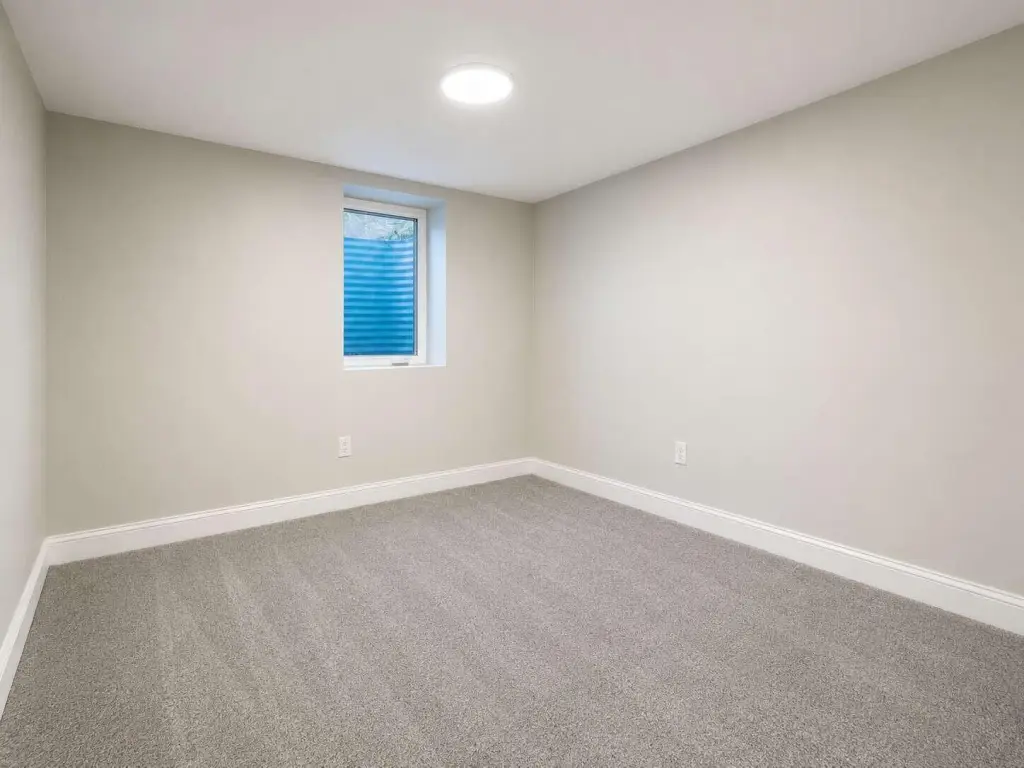
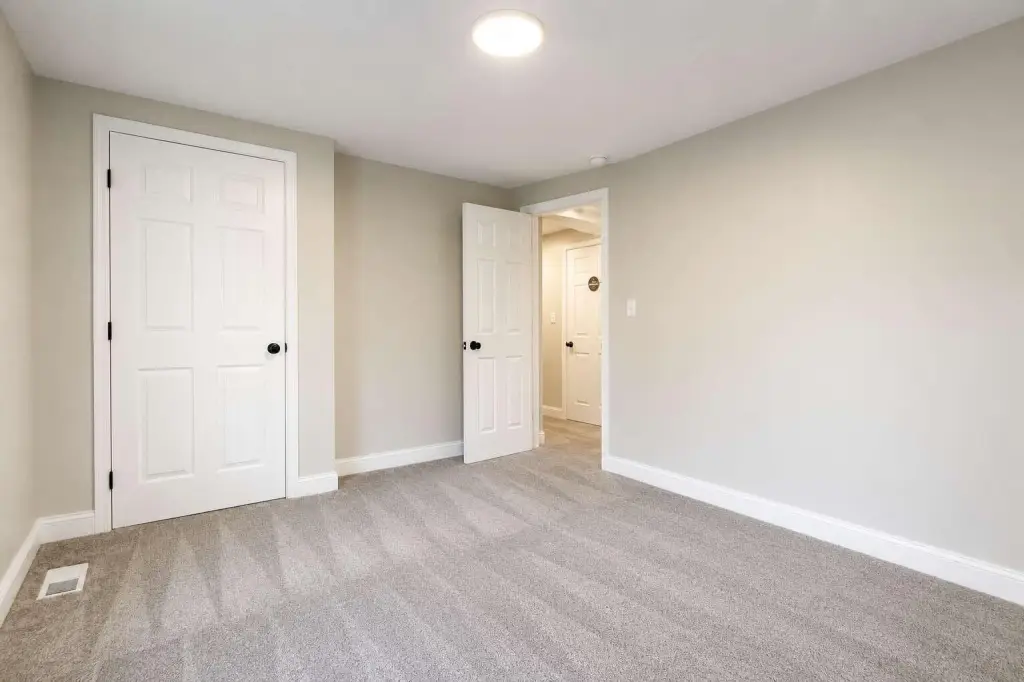
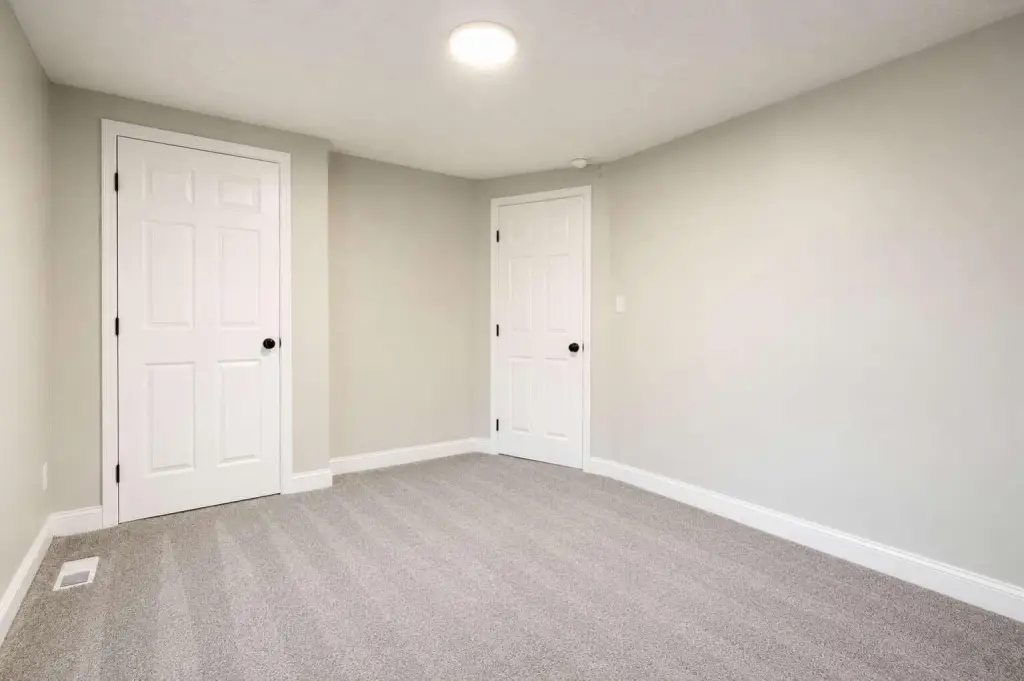
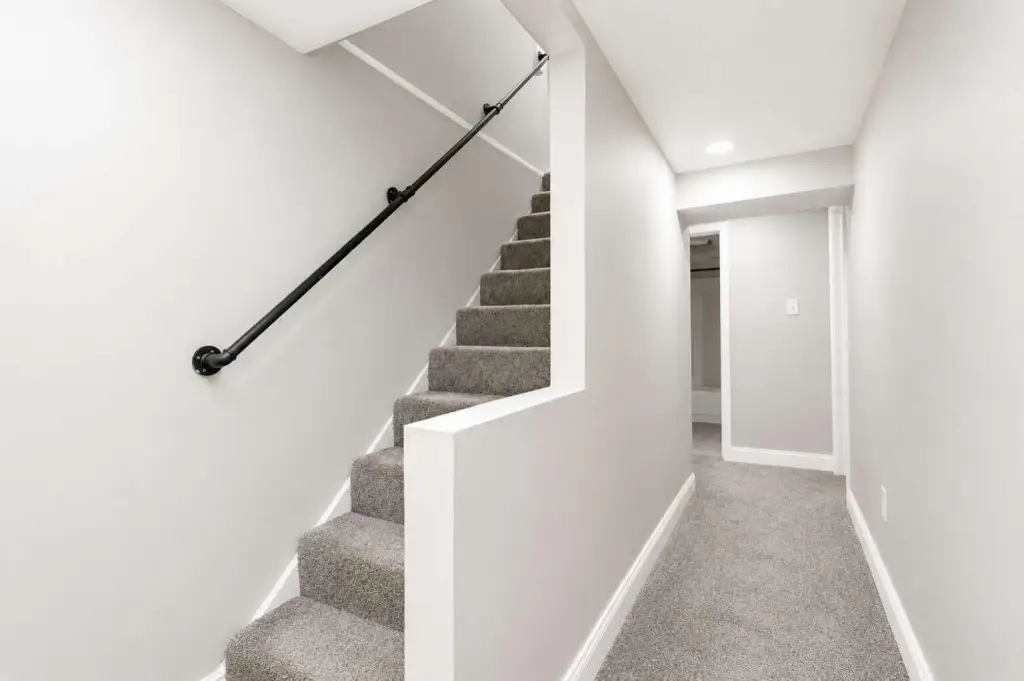
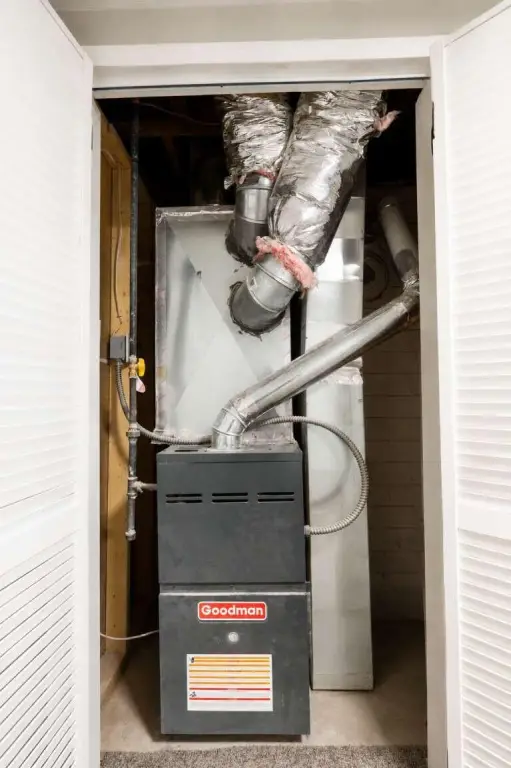
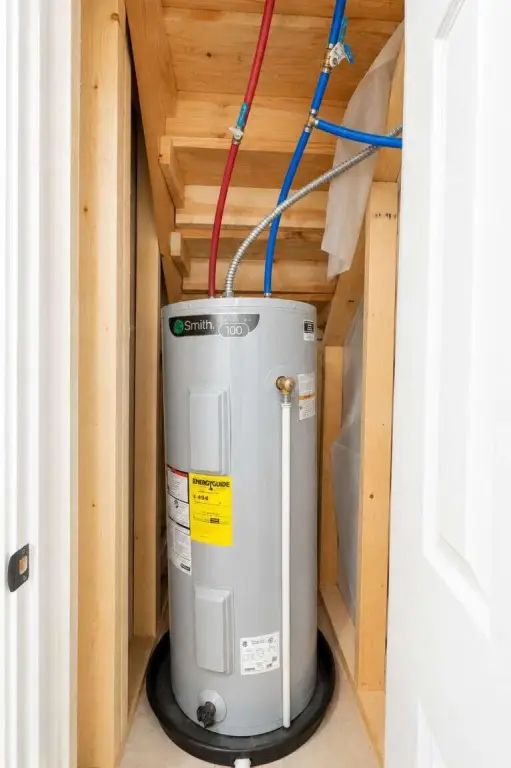
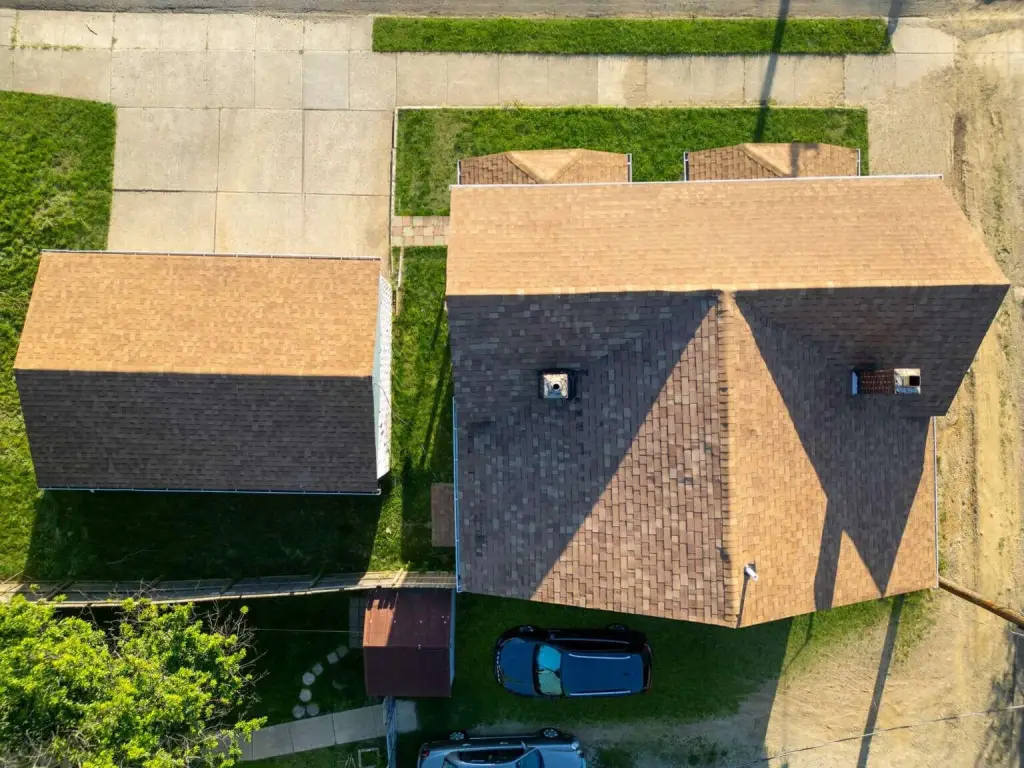
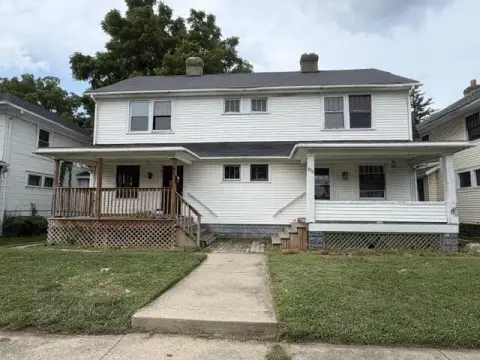
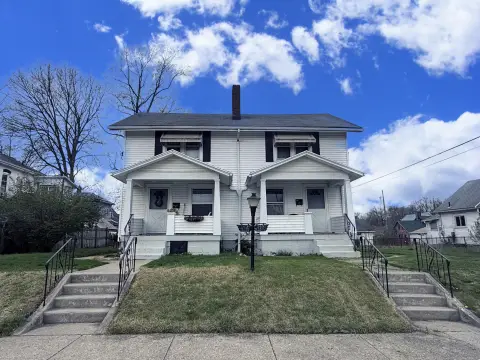
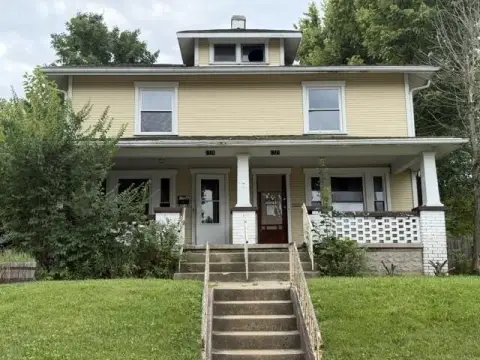
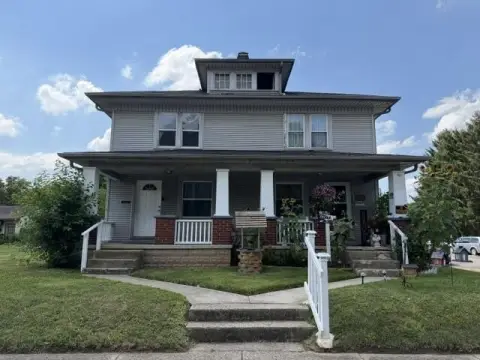
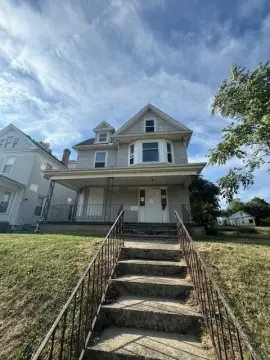
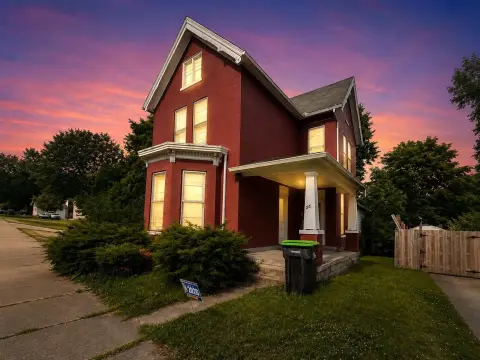
This duplex contains 2,400 square feet with two occupied units supported by long-term tenants on 3-year leases. Improvements include updated electrical service, new plumbing, furnaces, kitchens, bathrooms, windows, doors, drywall, trim, paint, siding, fascia, and a new roof. Interior finishes include tile in the kitchens and bathrooms, along with LVP in the living areas. The property also includes forced-air heating, vinyl siding, public sewer, and appliances including ranges, refrigerators, microwaves, and dryers.
Built in 1913, the property is located at 218 N Jackson Street in Springfield, Ohio. The recorded room inventory includes 8 bedrooms and 4 bathrooms. Flooring includes carpet, laminate, and tile, providing a mix of finished surfaces across the units.
Built in 1913, the property is located at 218 N Jackson Street in Springfield, Ohio. The recorded room inventory includes 8 bedrooms and 4 bathrooms. Flooring includes carpet, laminate, and tile, providing a mix of finished surfaces across the units.
Key Highlights
- 2,400‑square‑foot duplex with 2 occupied units
- Both units have long‑term tenants with 3‑year leases
- New roof, furnaces, plumbing, electrical, windows, and doors
Financial Insights
Estimated NOI and Cap Rate
NOI / Yr
$8,146
Cap Rate
3.13%
Suggested Prices Based on Cap Rates
Cap Rate 5%
$162,920
$162.9K
Cap Rate 7%
$116,371
$116.4K
Cap Rate 9%
$90,511
$90.5K
Market Conditions
NOI Build-Up for 2,400 SF
Gross rent
$12.7K $5.28/SF
− Vacancy
−$1.0K −$0.43/SF
EGI
$11.6K $4.85/SF
− OpEx
−$3.5K −$1.45/SF
NOI
$8.1K $3.39/SF
Area
Clark County, OH
Vacancy
8.17%
Lease Rate
$5.28 /SF/Yr
Expense Ratio
30.00%
Simulate Cap Rate and NOI
Suggested Prices Based on Cap Rates
Cap Rate 5%
$162,920
Cap Rate 7%
$116,371
Cap Rate 9%
$90,511
Alternative Uses
Best Use
Multifamily LT 5
$116.4K
$101.8K – $135.8K
NOI $8,146 @ 7.0% cap · market cap 3.13%
Second Best
Apartment 5plus
$100.8K
$88.2K – $117.6K
NOI $7,058 @ 7.0% cap · market cap 2.72%
Theoretical Best
Specialty Retail
$669.4K
$585.8K – $781.0K
NOI $46,860 @ 7.0% cap · market cap 18.03%
Zoning and permitted uses should be independently verified with authorities.
Property Analytics
Unlock full access to Insights
Subscribe to Realmo Intelligence
Open Analytics
Current Use
Lease Details
2
Residential units
100%
Occupancy
Multi-tenant
Tenancy
Location Intelligence
Trade Area within ½ mile
526
Businesses Nearby
Explore this area
Business Placement
Demographics for 45504, OH
17,343
Population
7,100
Households
2.4
Avg Household Size
41
Median Age
27%
College-Educated
92%
High-School Grad
22.0 sq mi
ZIP Area
788
Density / Sq Mi
$67,334
Median Household Income
$38,813
Median Earnings
$889
Median Rent
$167,700
Median Home Value
Check the figures for this property
Cap Rate, Value Estimation, Potential NOI and more
View Realmo Analytics
Market
Vacancy Rate% for Multifamily in Midwest region

Questions? Ask Rey
Realmo’s AI knows this listing — price, zoning, demand, history. Ask anything.





Frequently Asked Questions
What type of property is this?
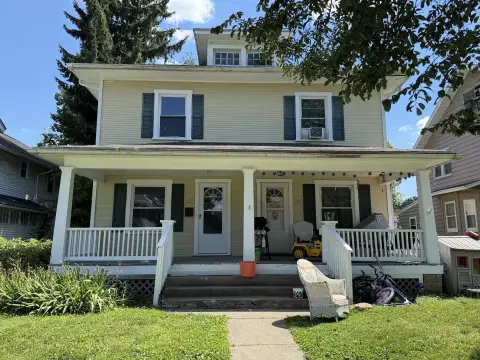
Duplex - Two occupied units feature updated systems, durable flooring, and three-year leases.
Where is this duplex located?
The property is located at 218 N Jackson Street Springfield, OH.
What is the asking price?
The asking price for this property is $259,950.
What are key features of this property?
This property features: 2,400‑square‑foot duplex with 2 occupied units; Both units have long‑term tenants with 3‑year leases; New roof, furnaces, plumbing, electrical, windows, and doors


