Renovated Mixed-Use
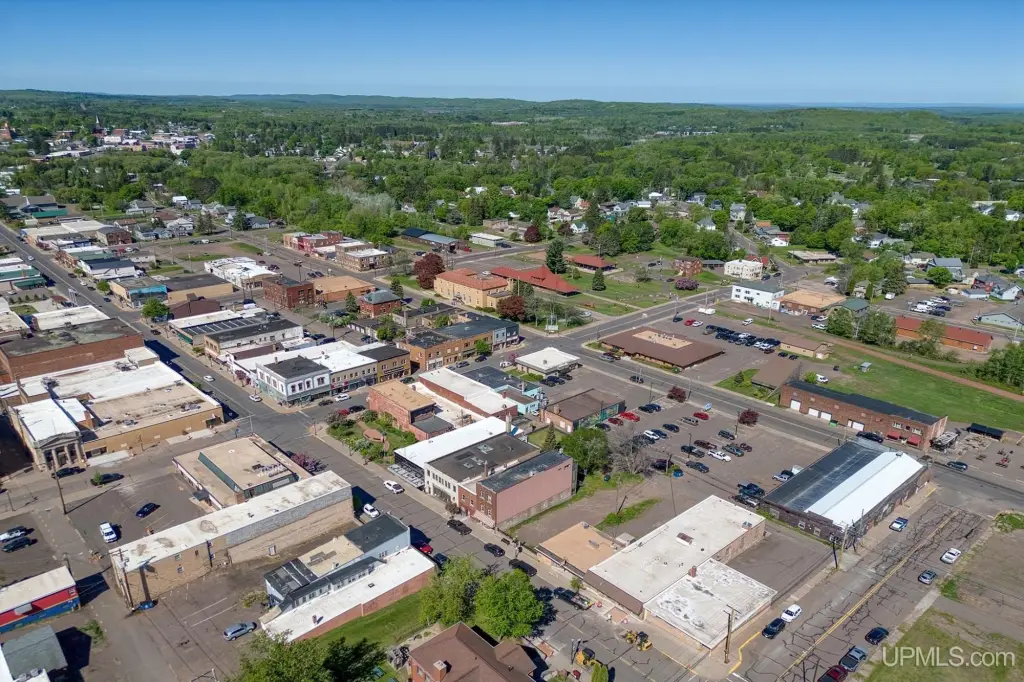
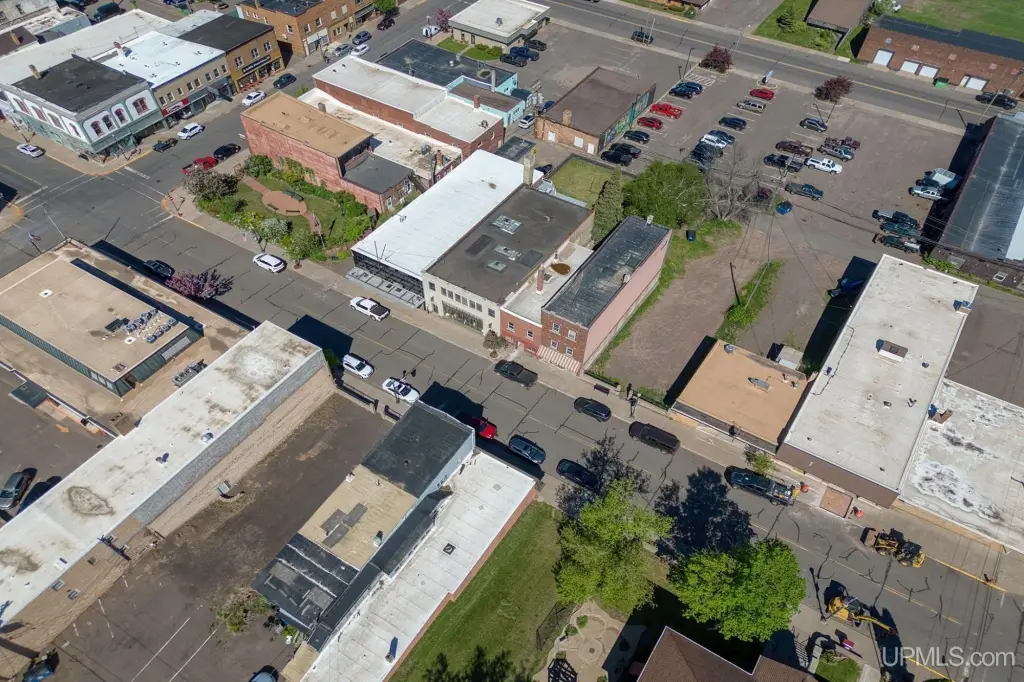
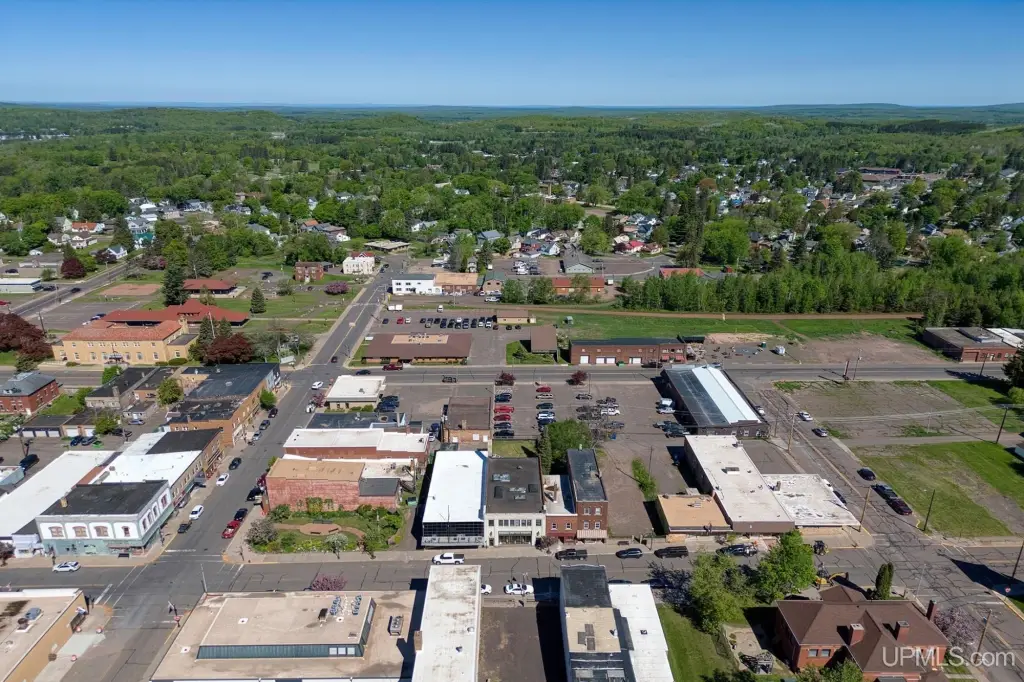
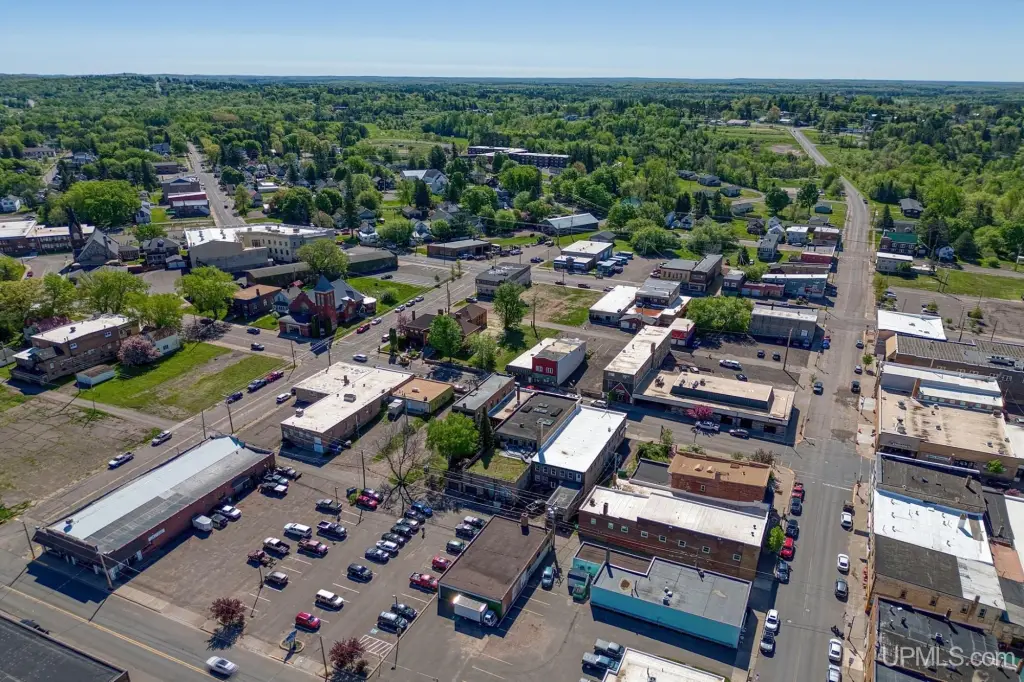
For Sale
$499,900
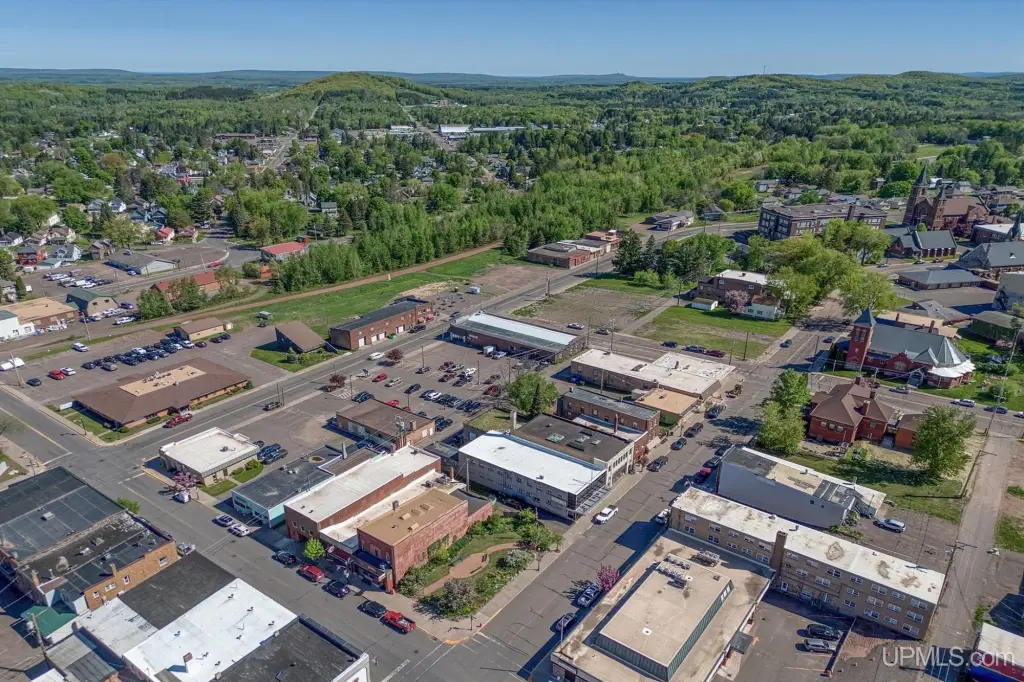
216 E Aurora Street, Ironwood, MI 49938
COM/IND/BUS OPP, Ironwood, MI
Property Size7,093 SF
Lot Size0.13 Acres
Price / SF$70.48
Days on Market143
Property Features for 216 E Aurora Street
General Information
Property type
Commercial Sale
Property subtype
Other
Zoning
Other
Lot features
Main Street
Subdivision
Ironwood (27006)
Standard status
Active
Size
7,093 SF
Lot size
0.13 Acres
Utilities
Heating system
Forced Air
Cooling system
Central Air
Water source
Public
Amenities
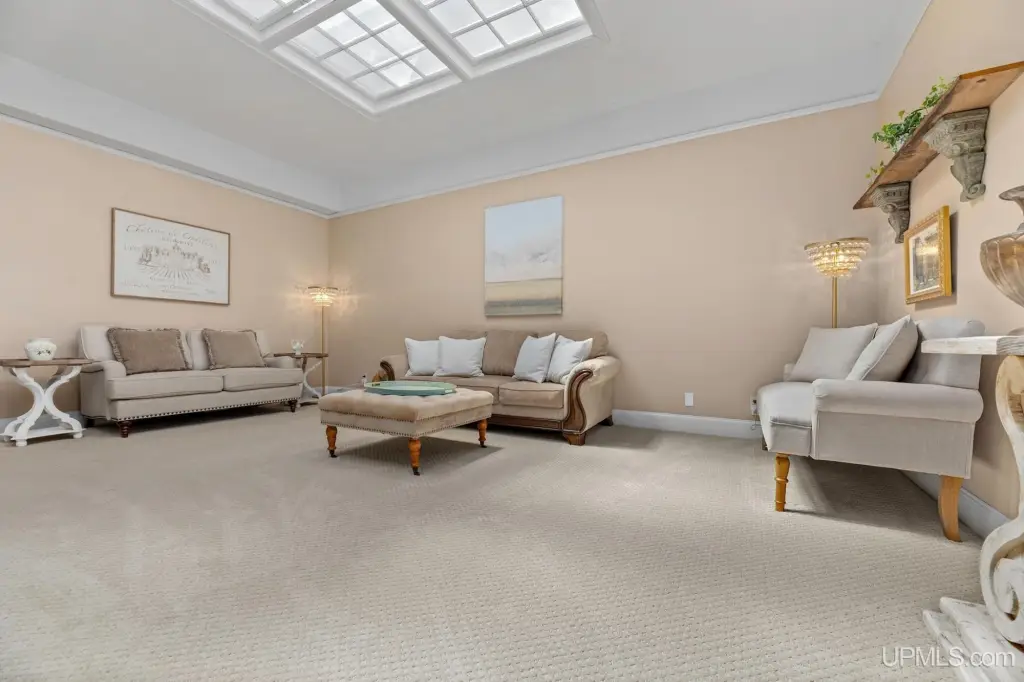
skylights
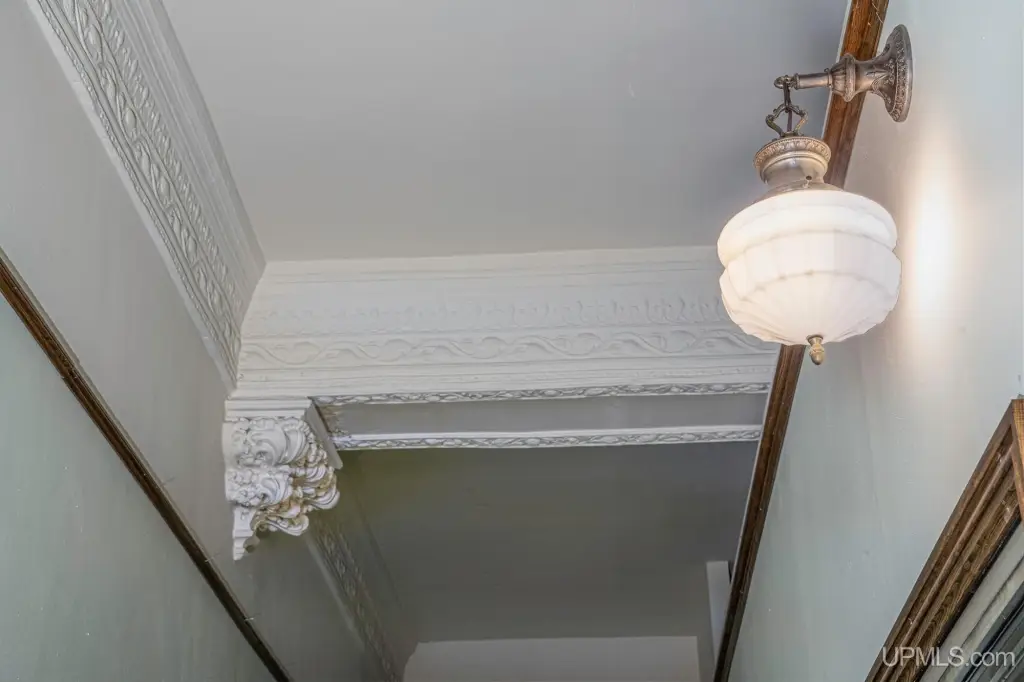
crown molding
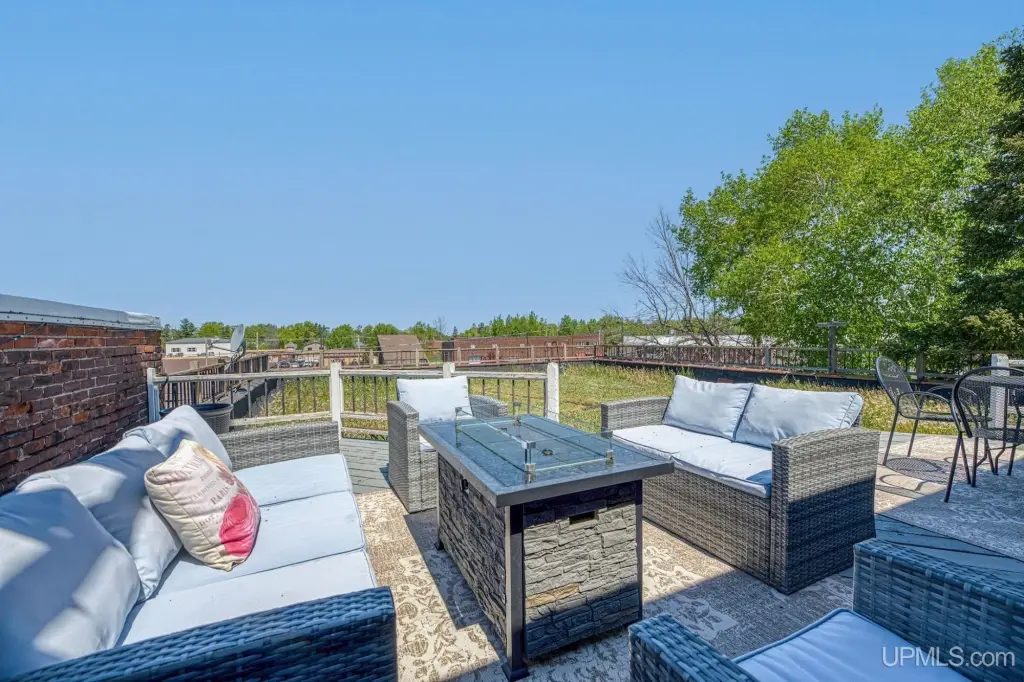
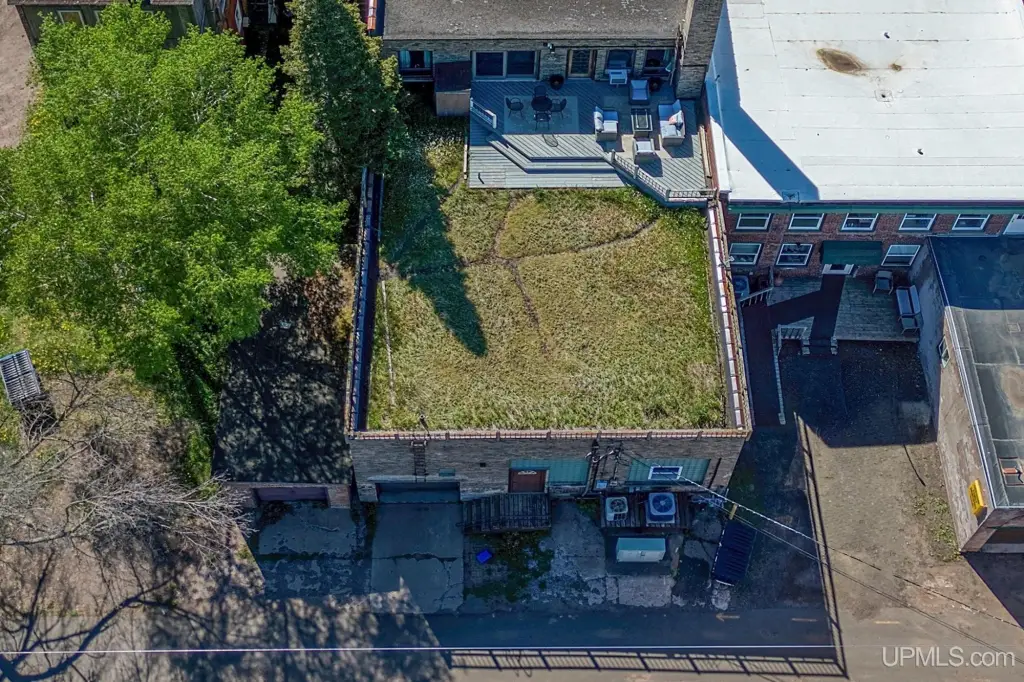
patio
green area
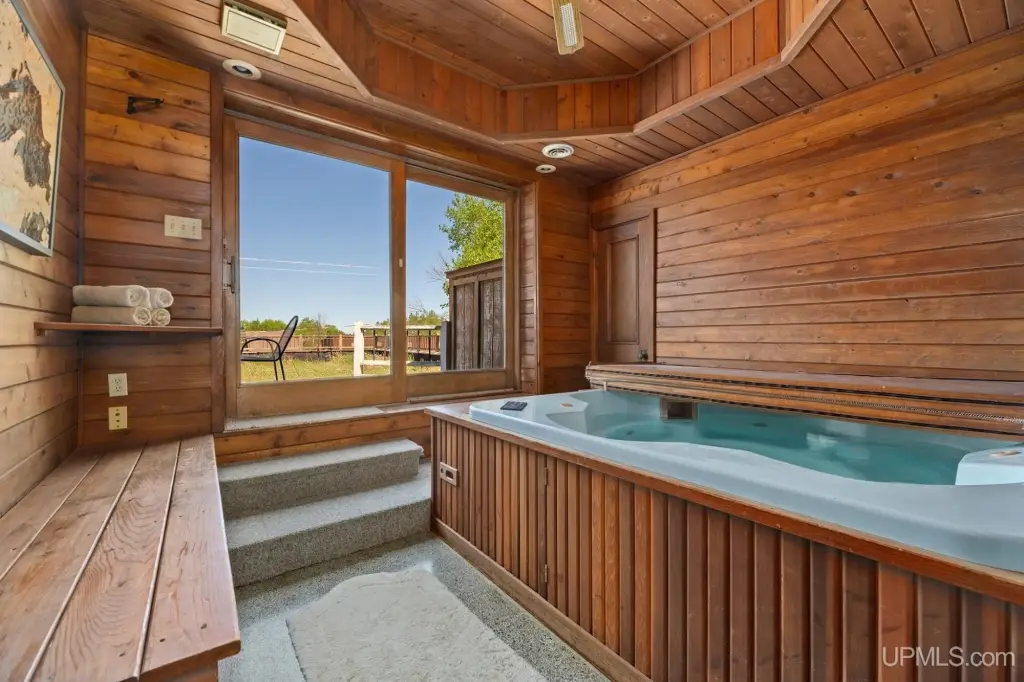
hot tub room
Building Details
Year built
1900
Listing Agency:
REDMAN REALTY GROUP, LLC
Listed By:
RACHEL MARTIN
(715) 891-6686
Added: Jun 3
Changed: Oct 8
Last Checked: Oct 23 at 12:06AM
MLS# 50210165
Copyright © 2026 Upper Peninsula Association of Realtors. All rights reserved. All information provided by the listing agent/broker is deemed reliable but is not guaranteed and should be independently verified.

Ask AI about this property
Review the available facts, identify missing information and prepare questions for the agent.
Investment Insights
Based on property information with market context.
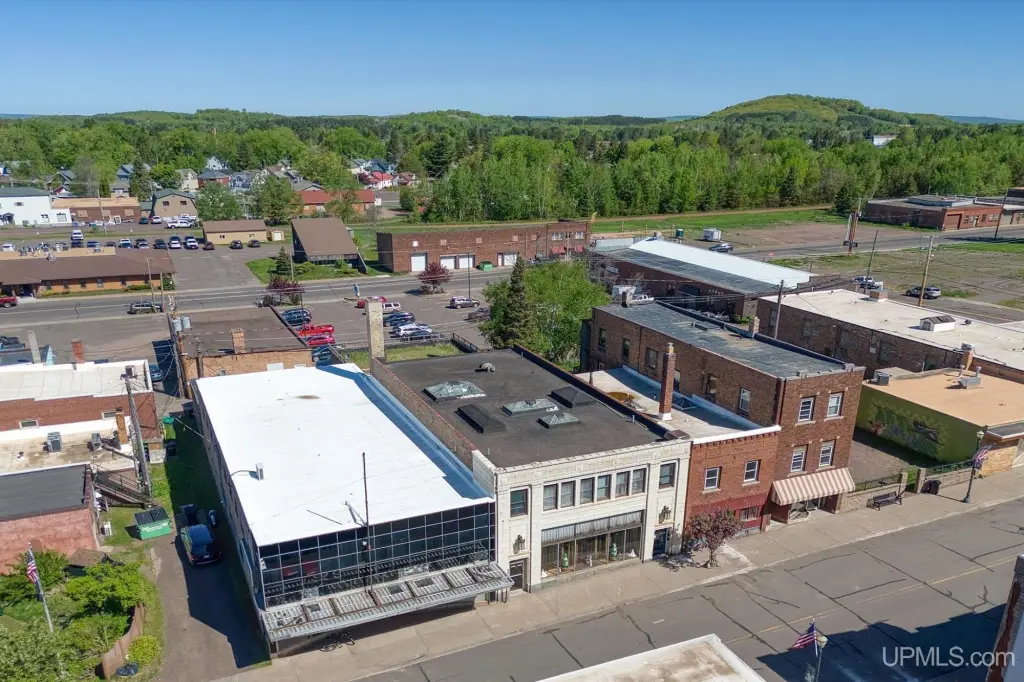
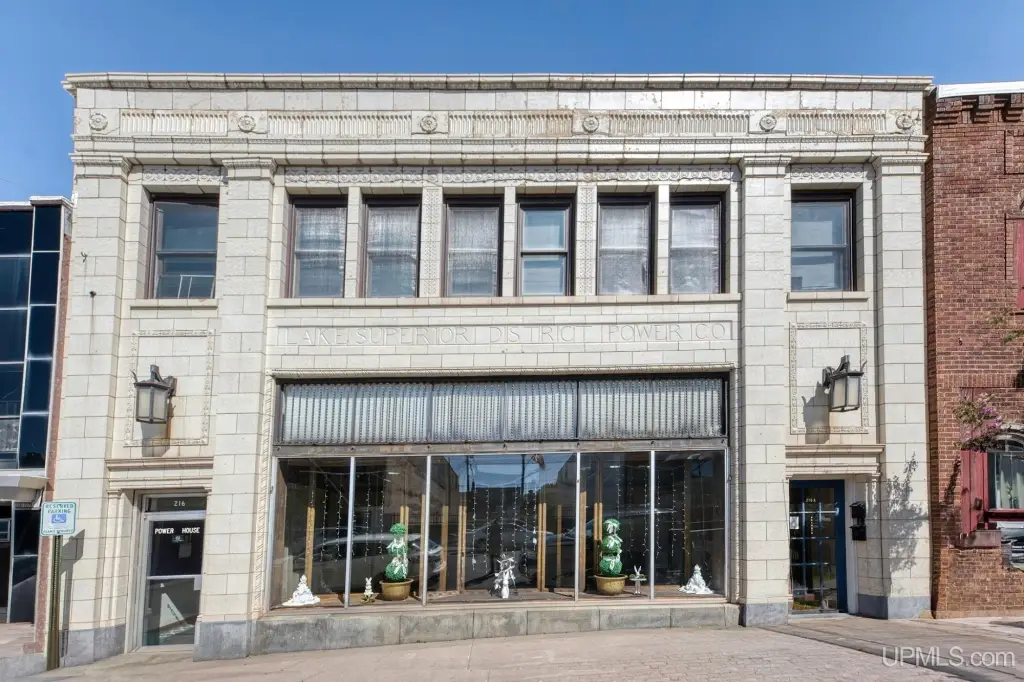
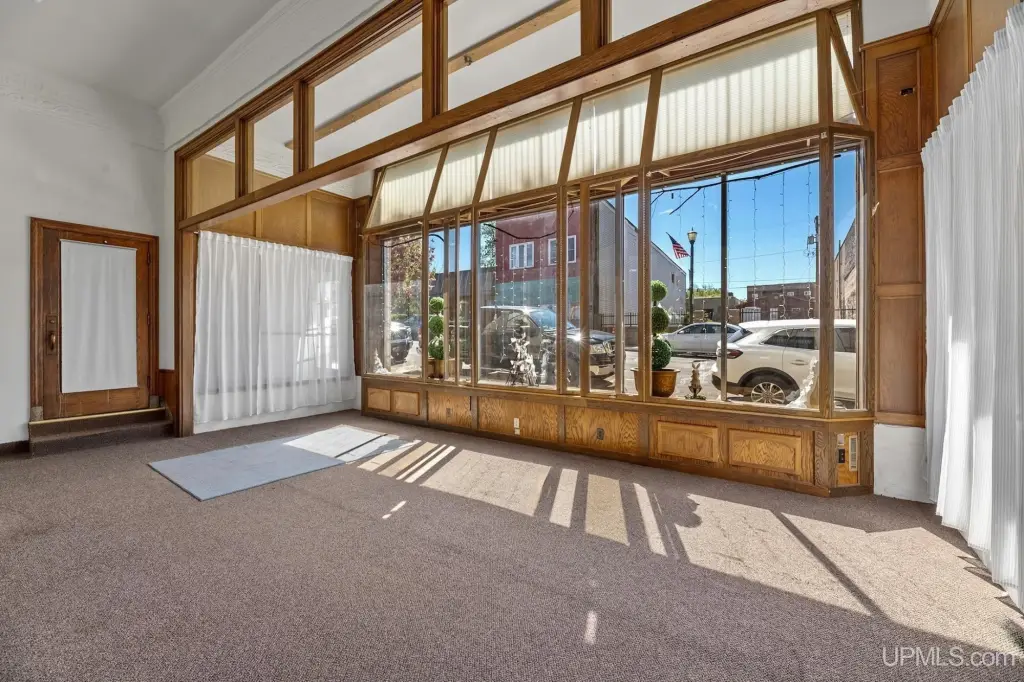
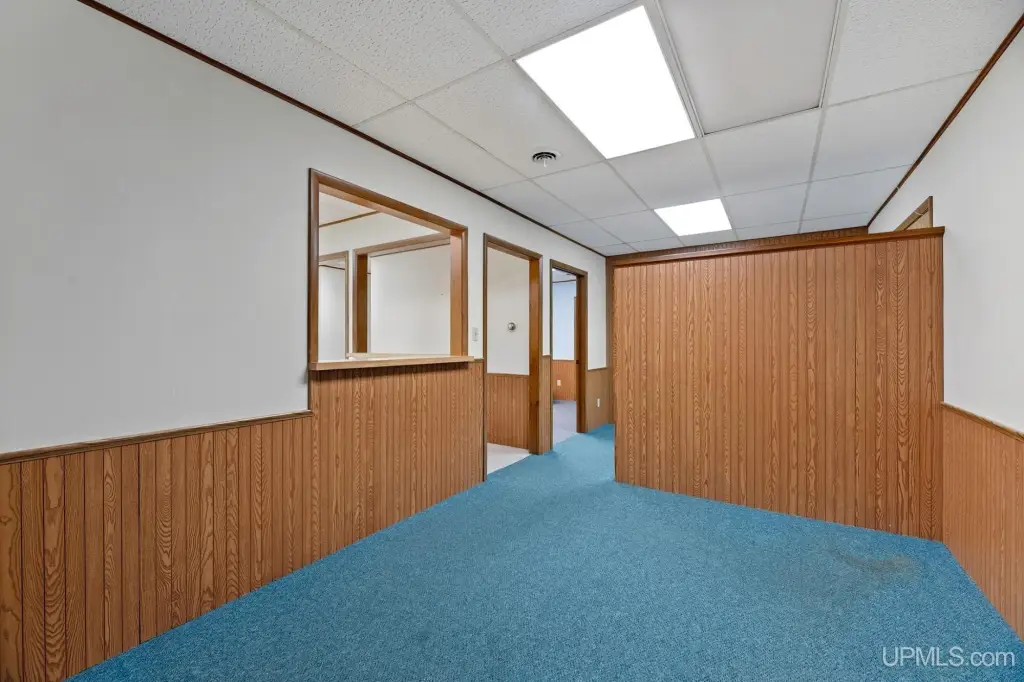
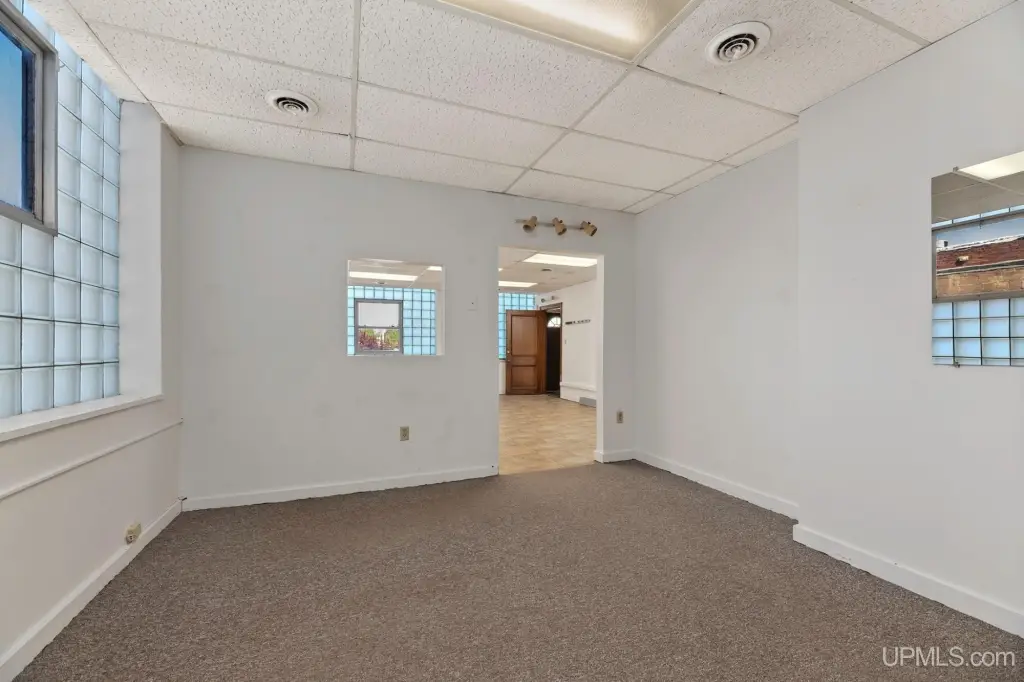
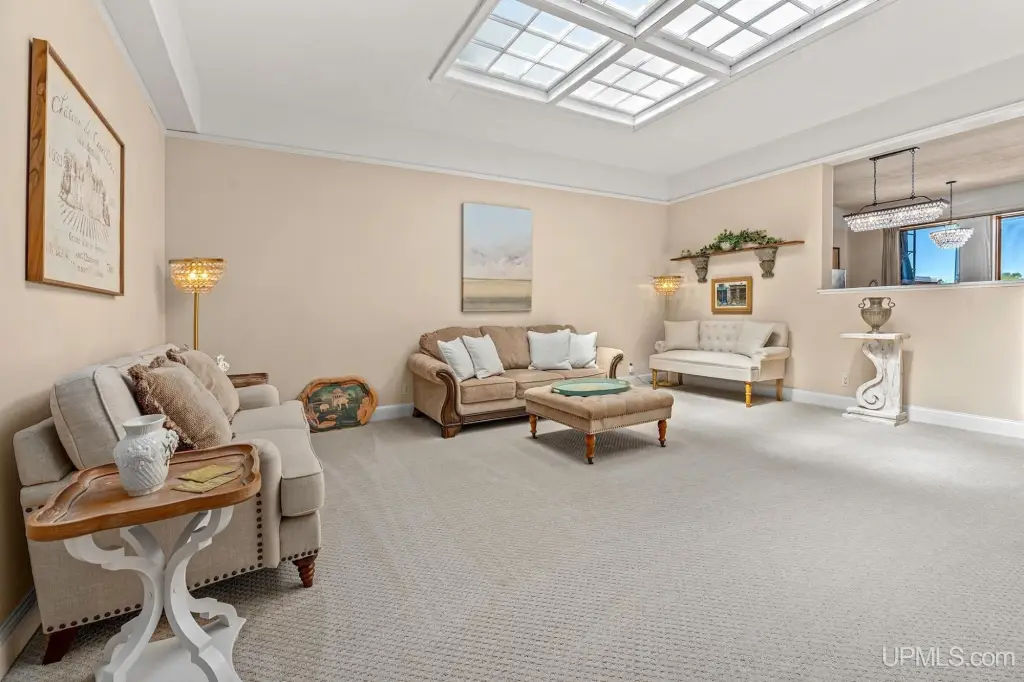
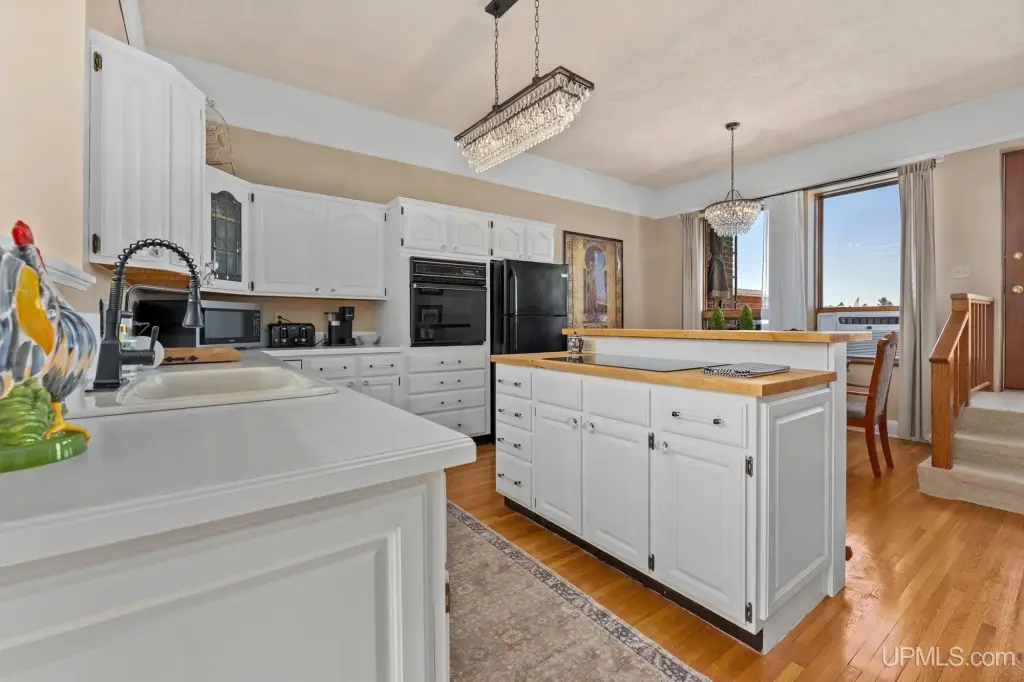
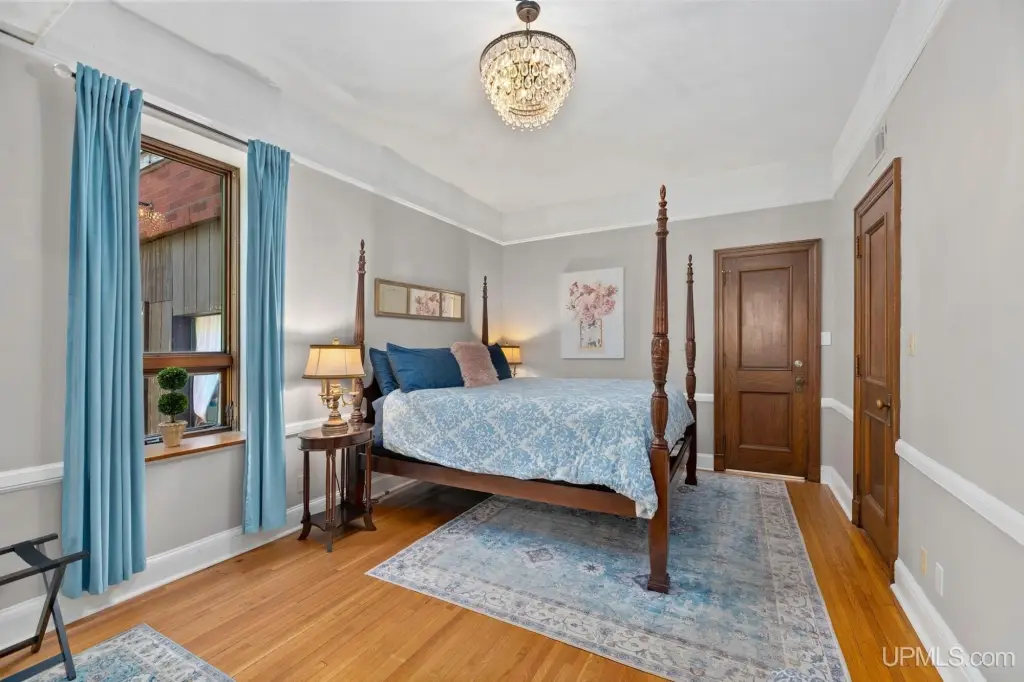
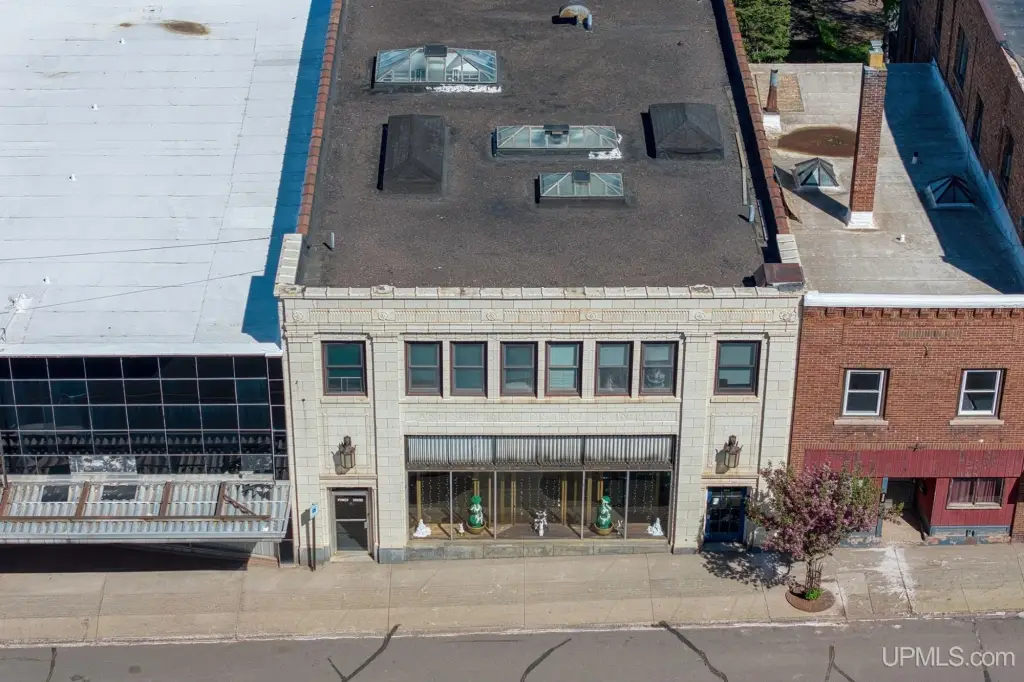
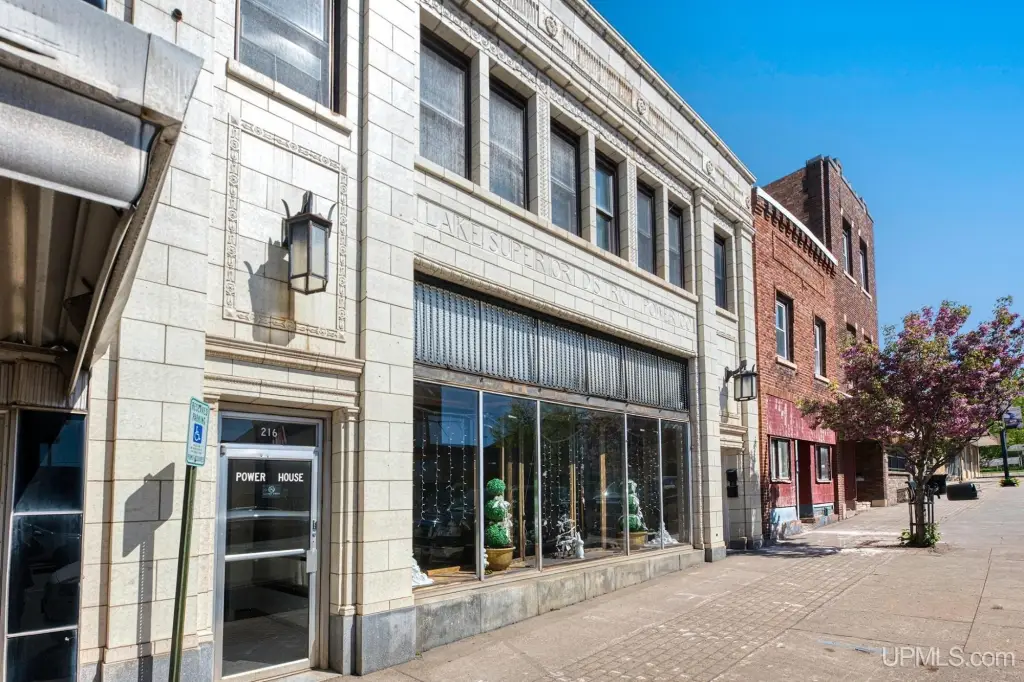
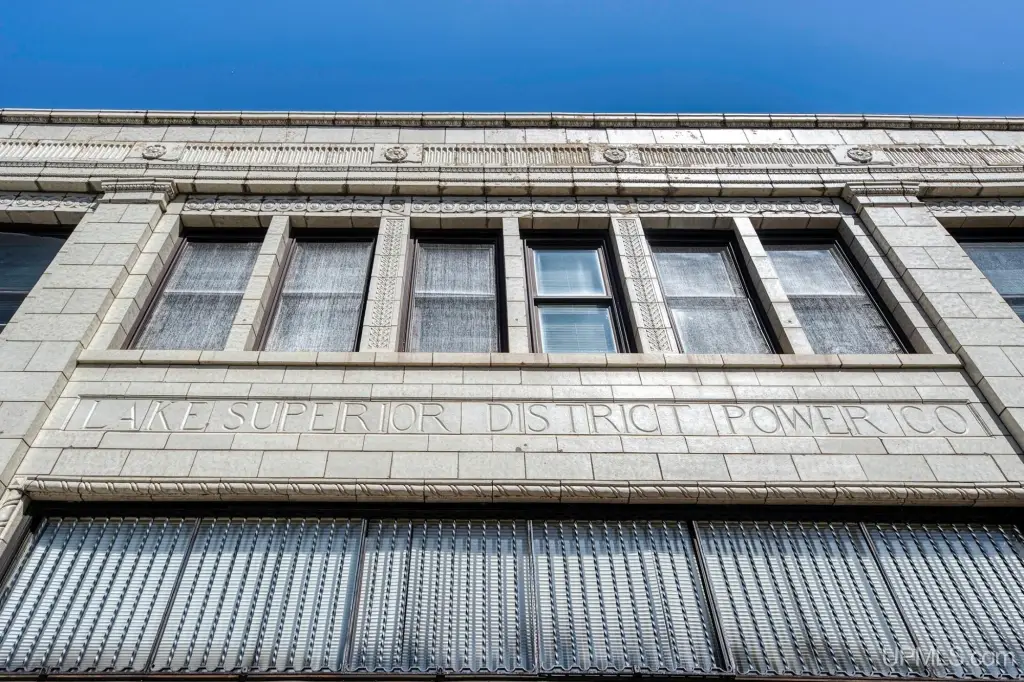
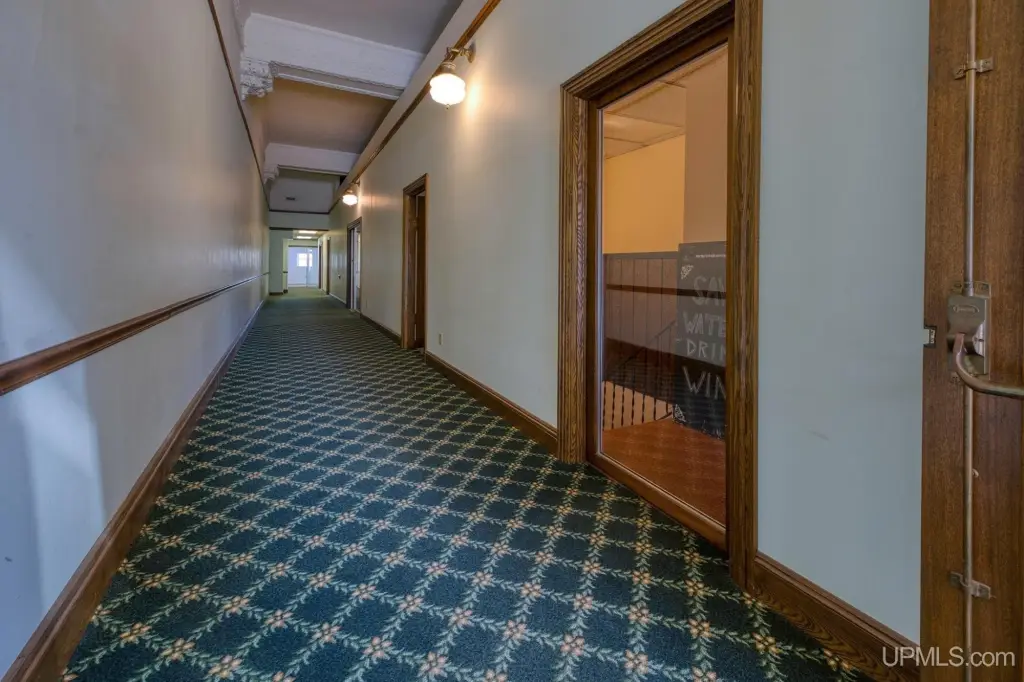
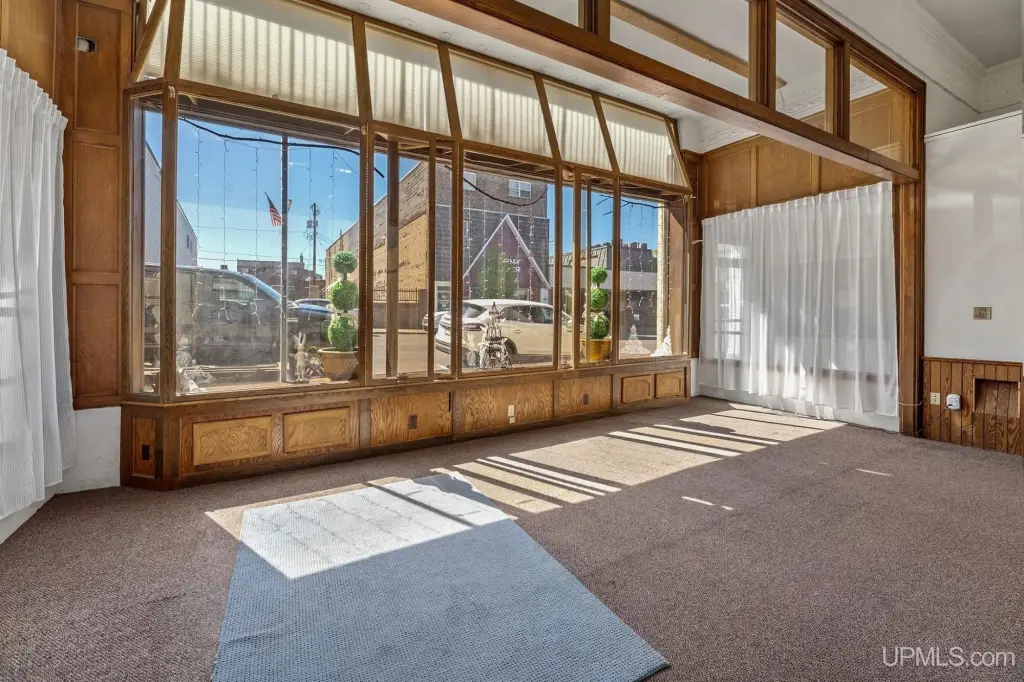
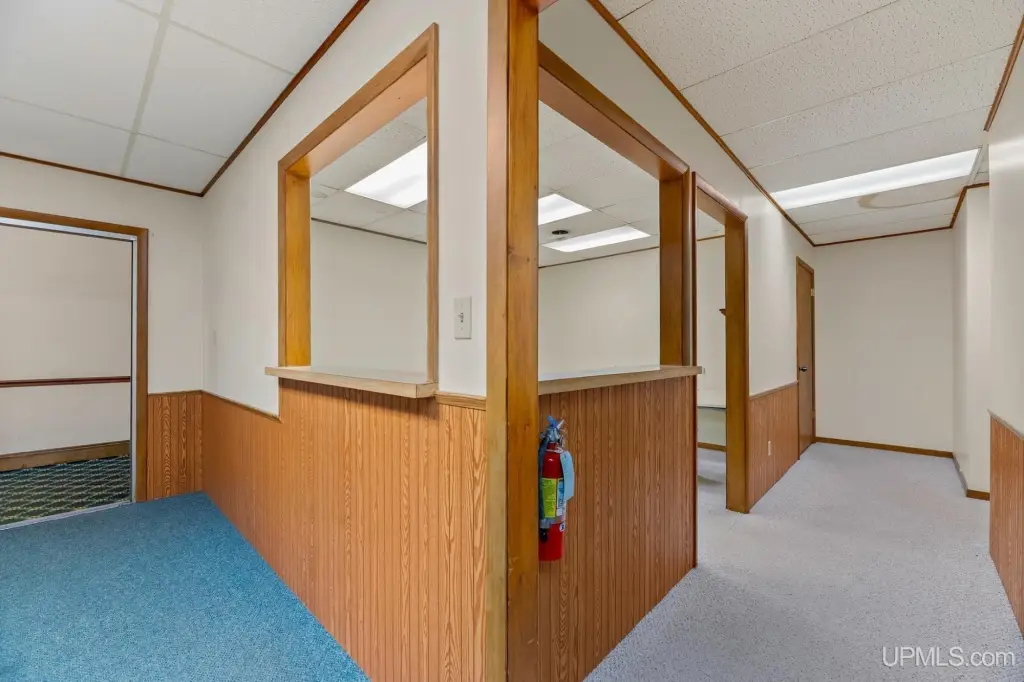
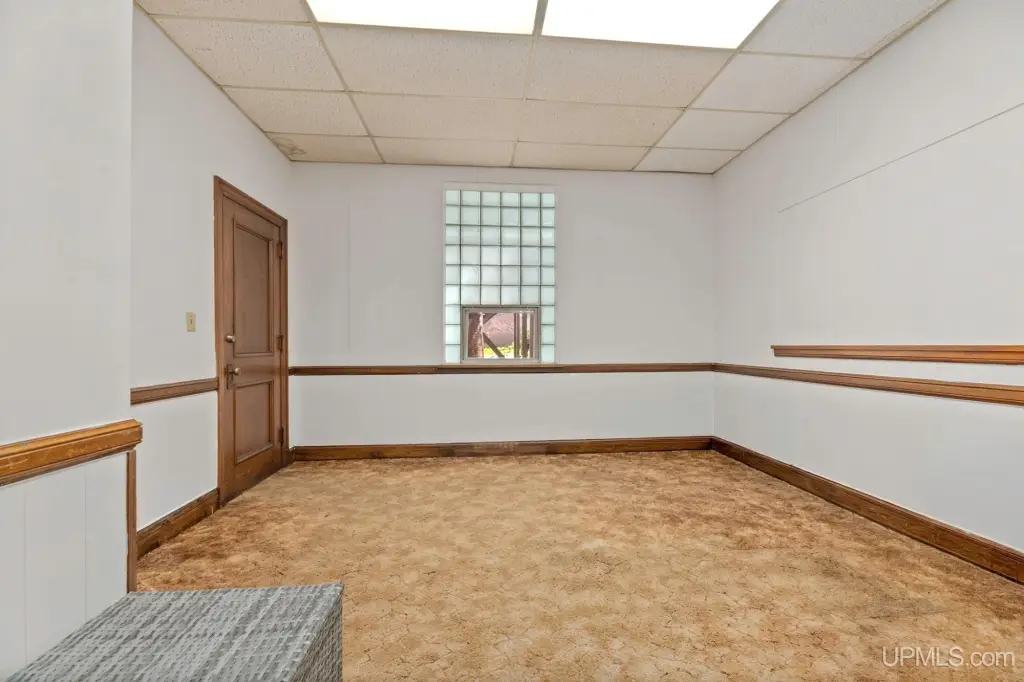
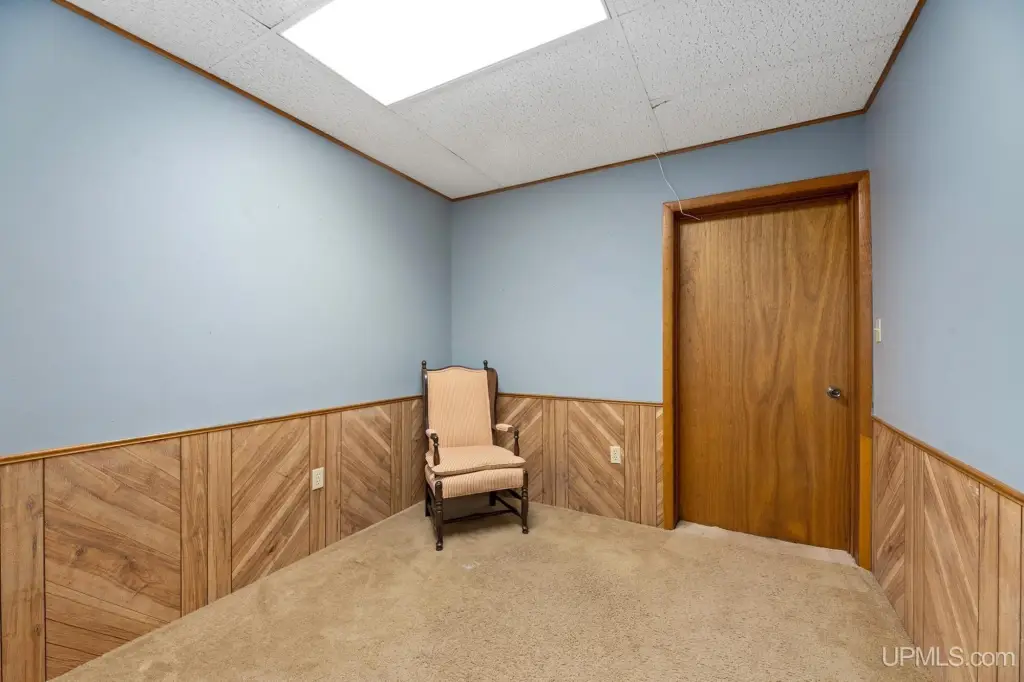
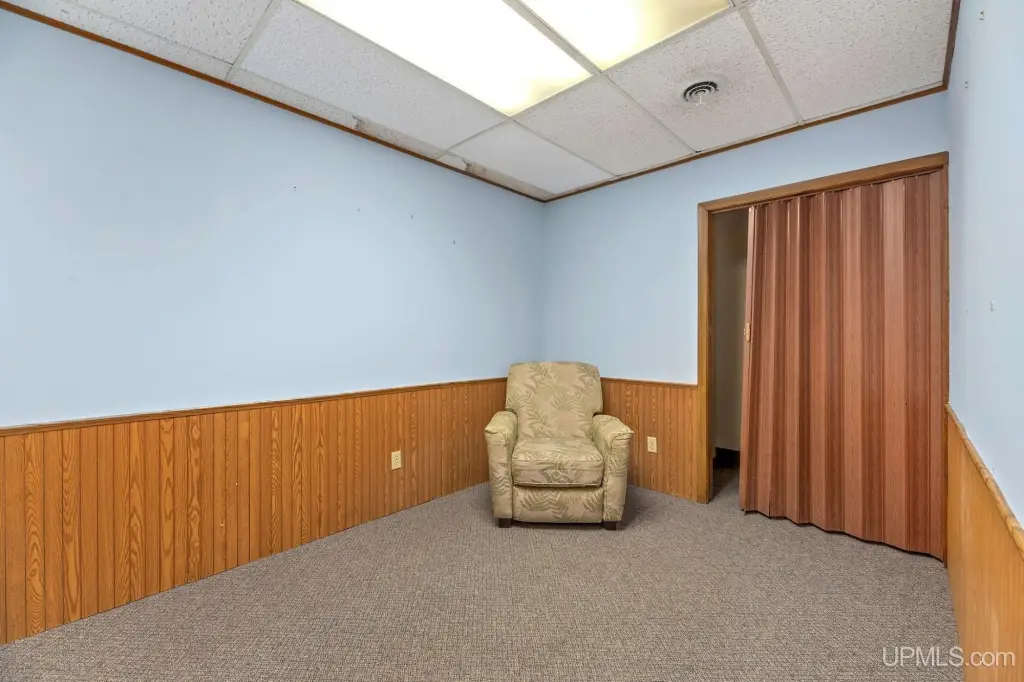
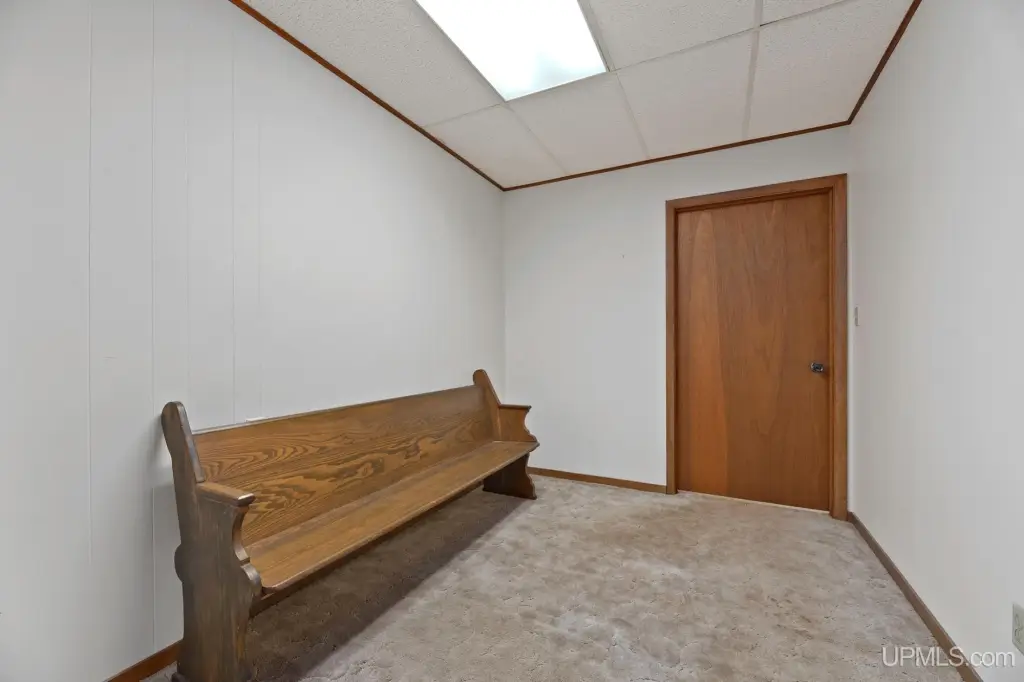
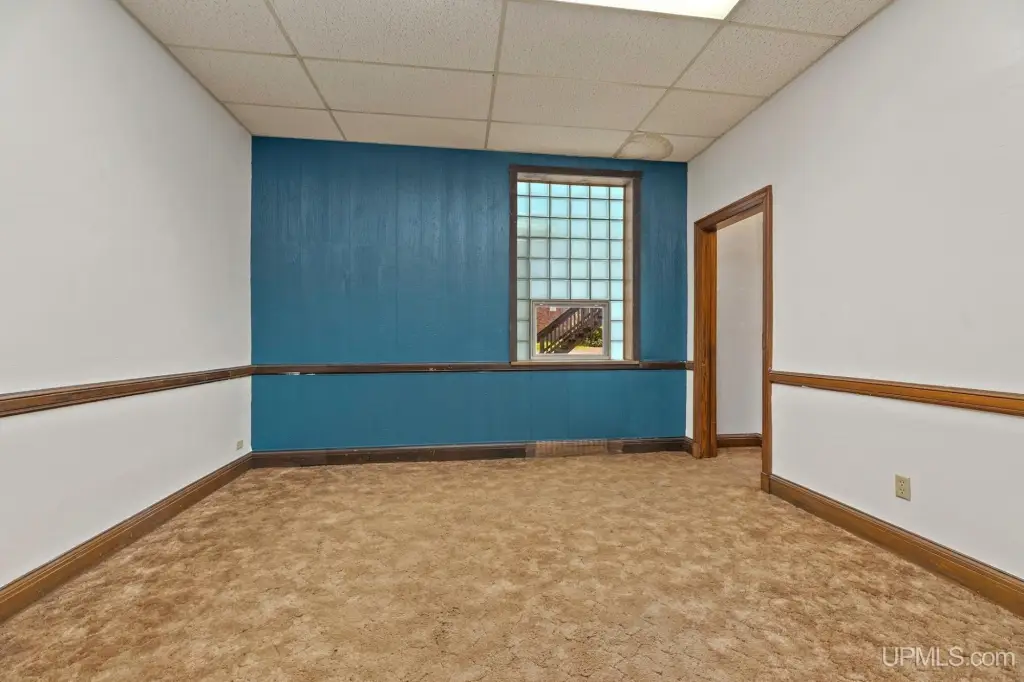
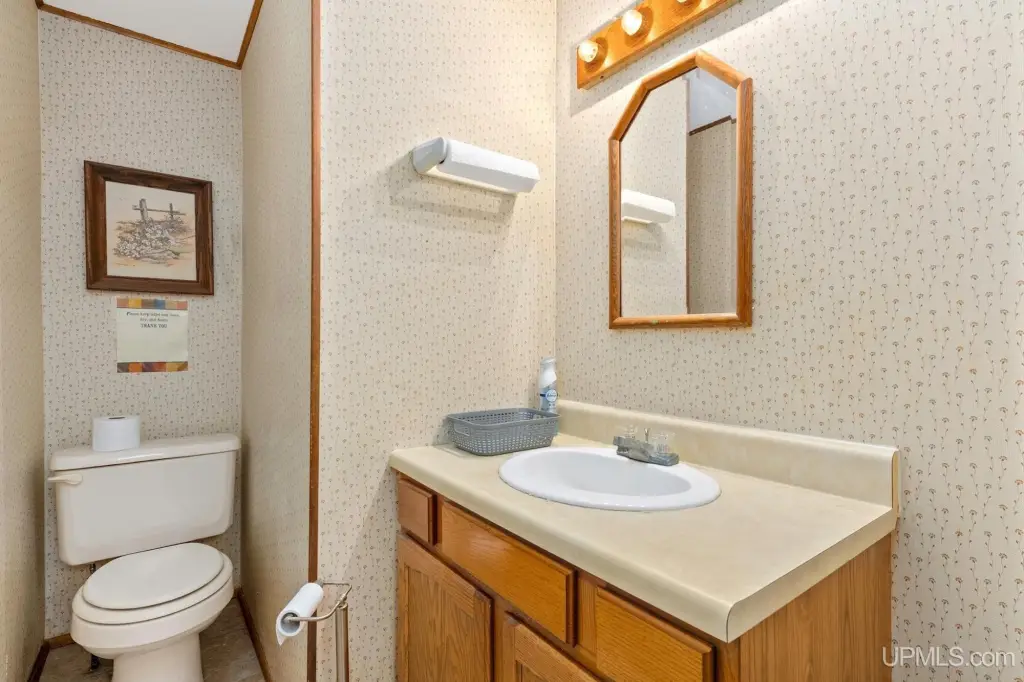
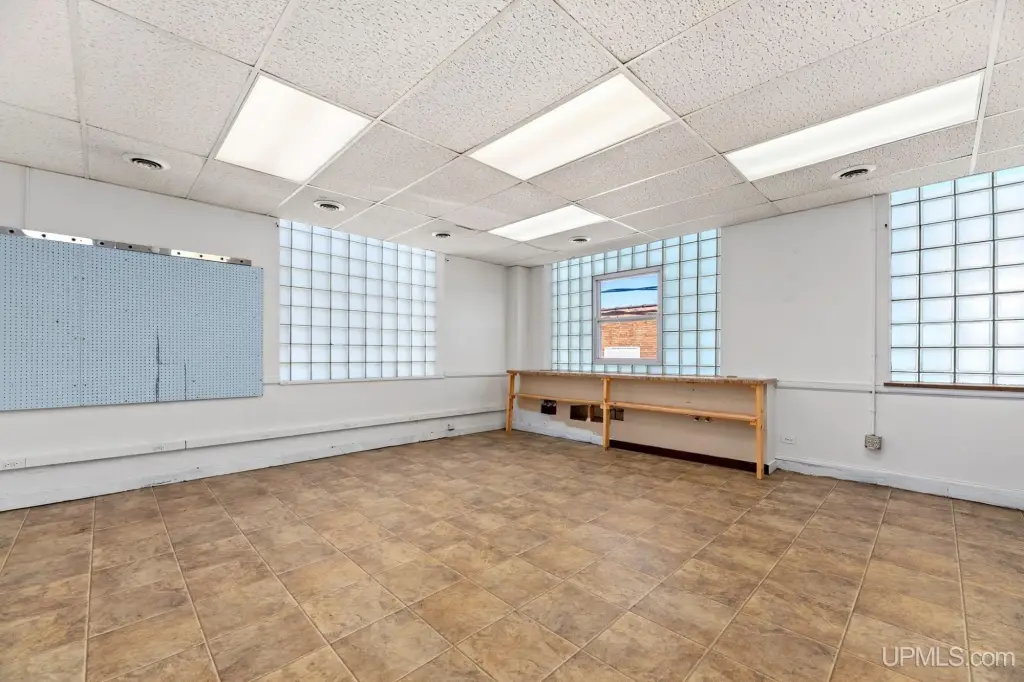
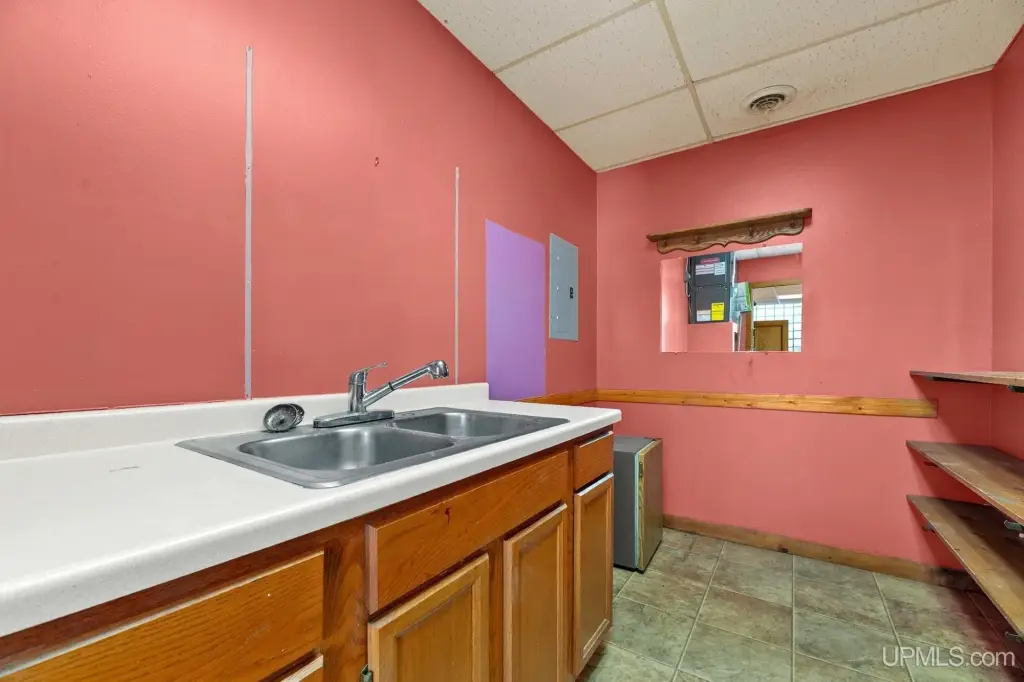
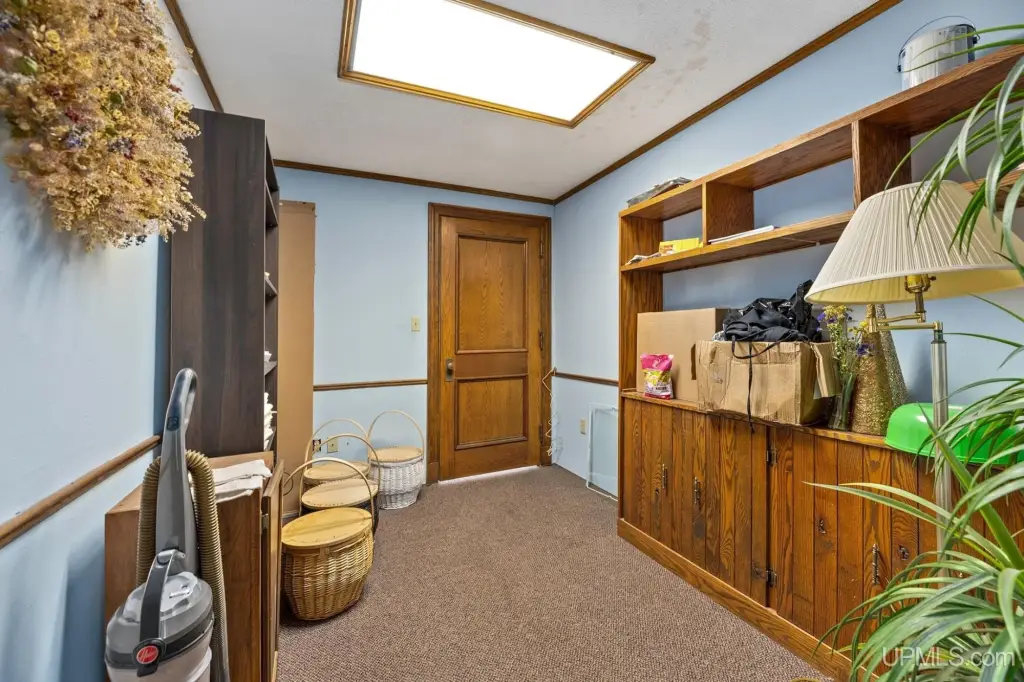
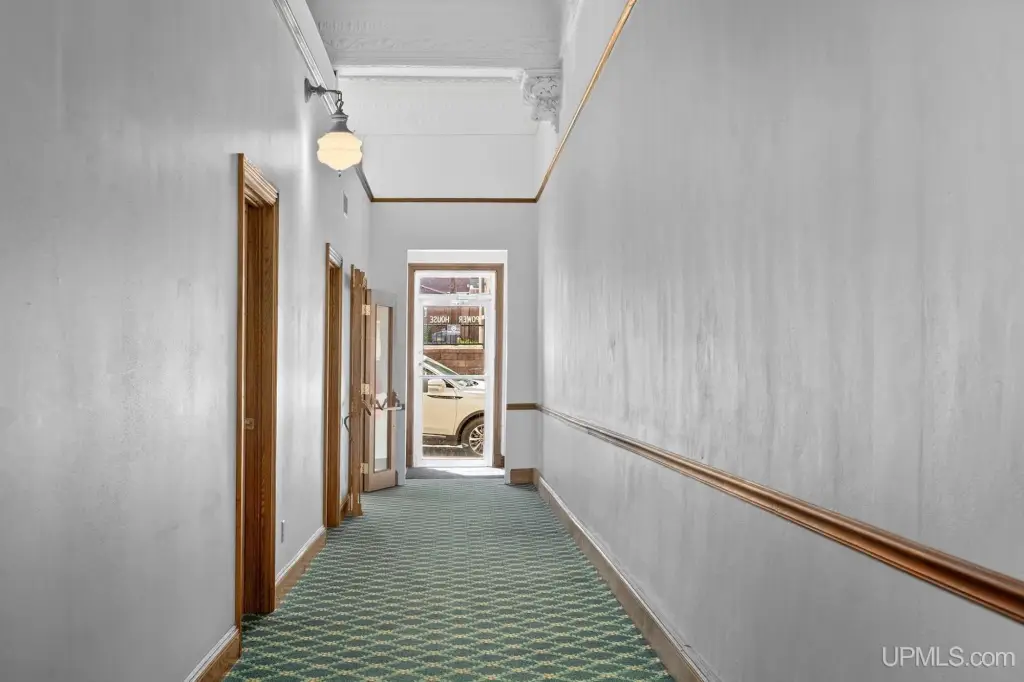
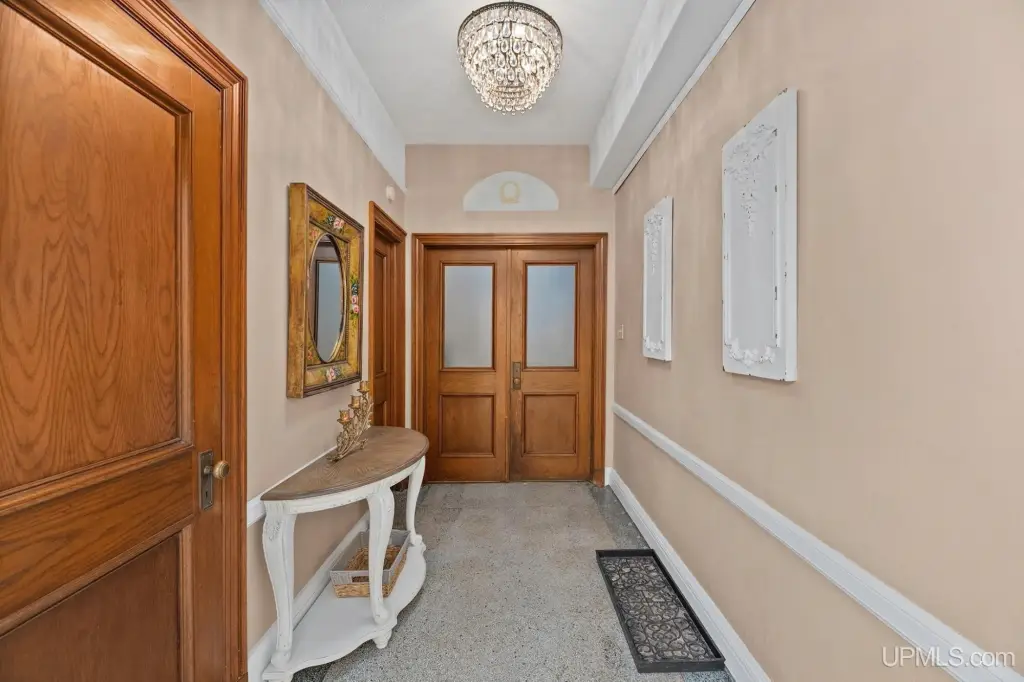
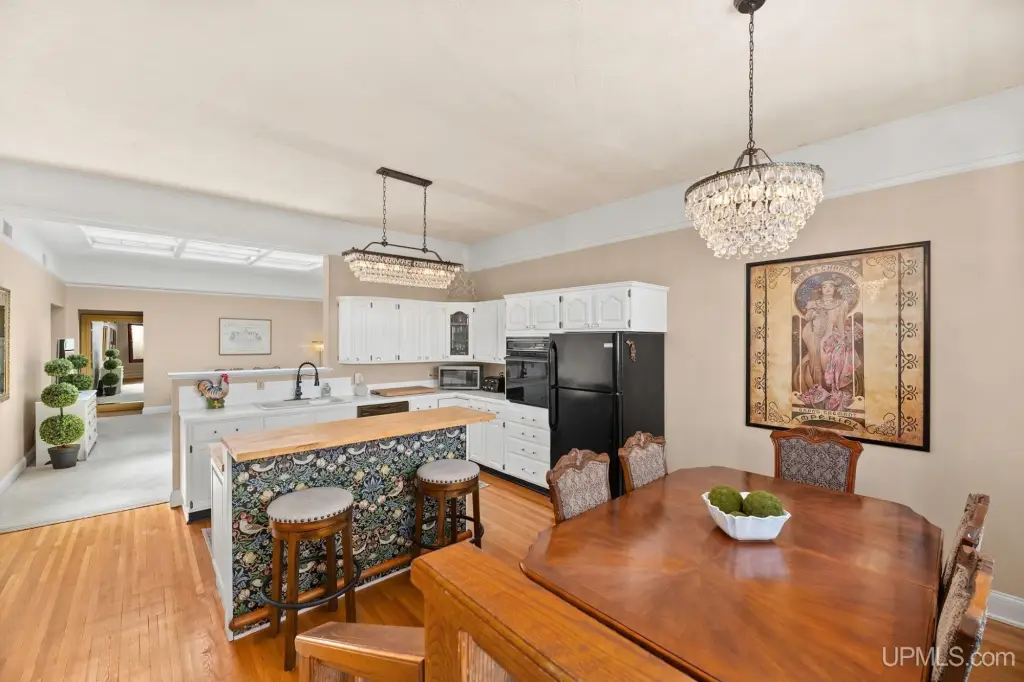
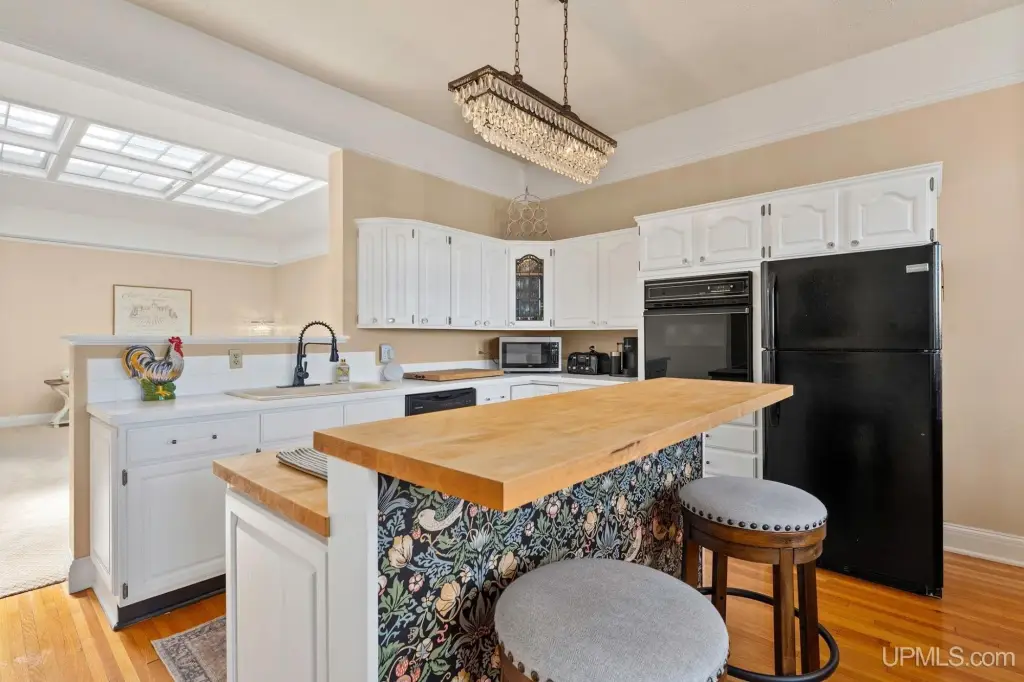
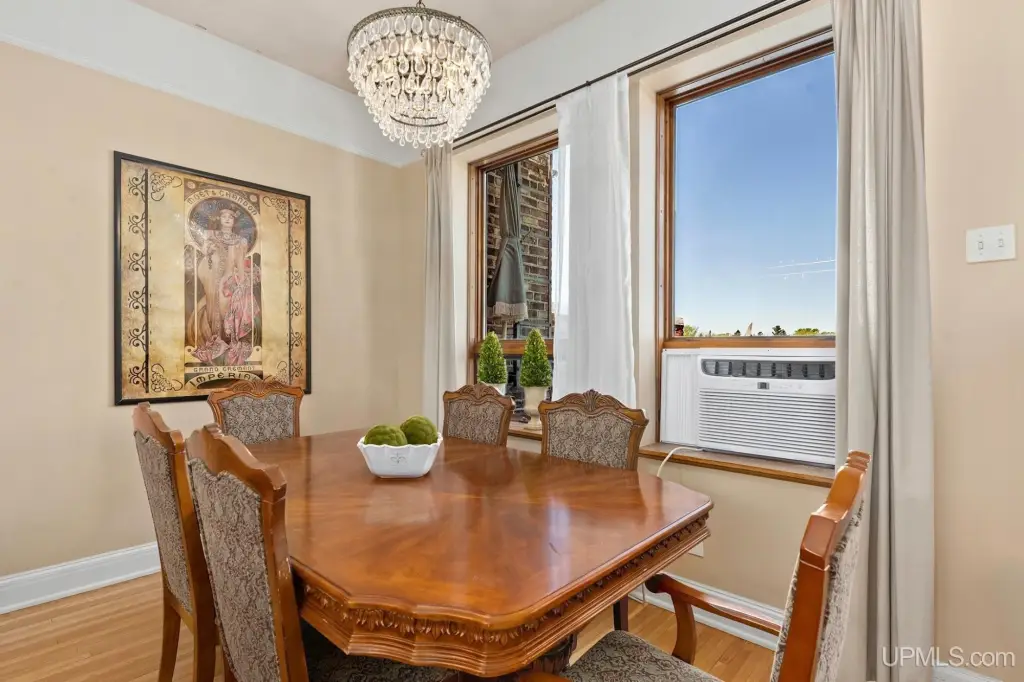
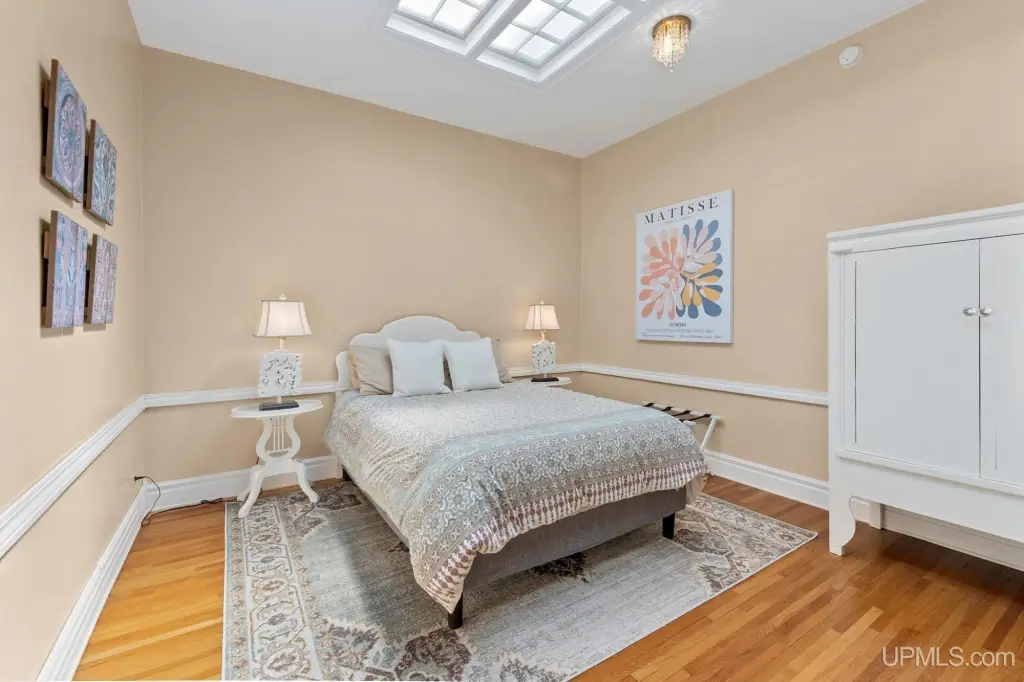
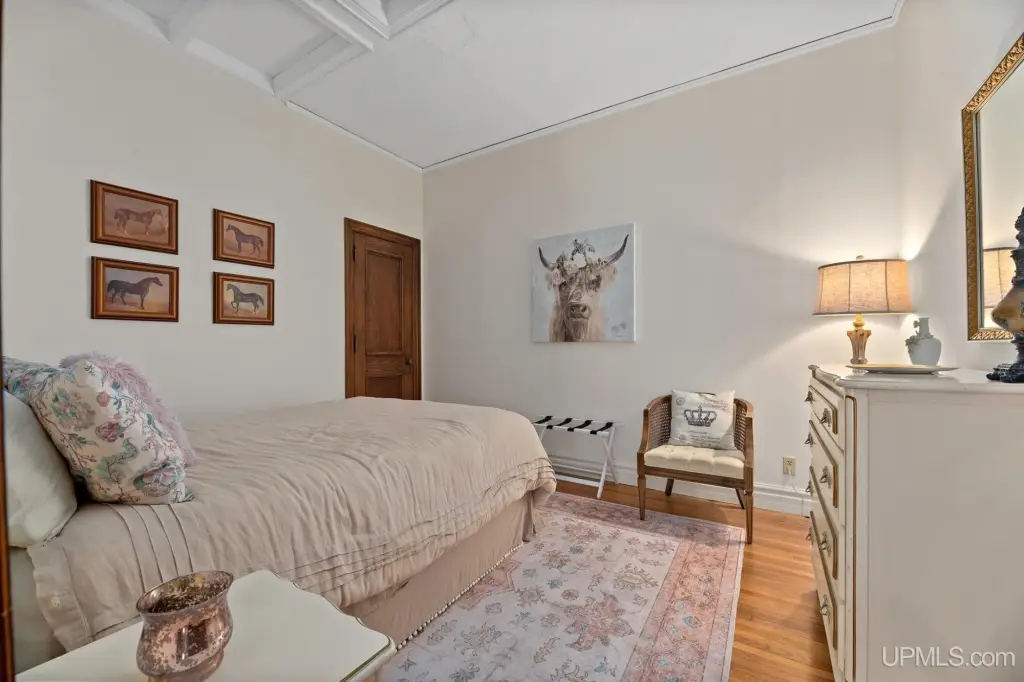
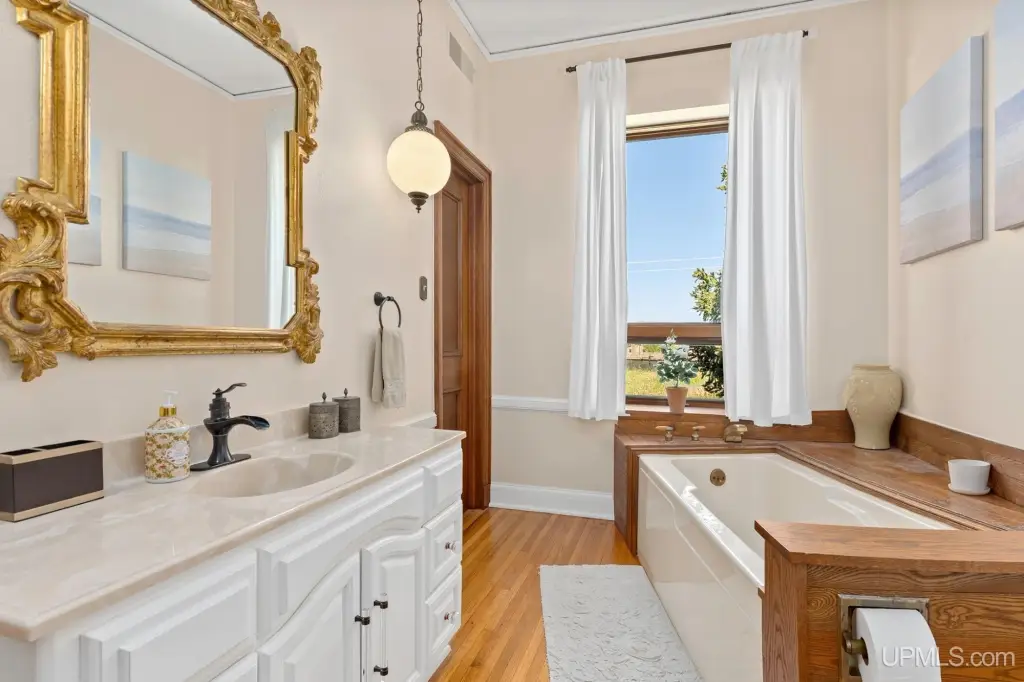
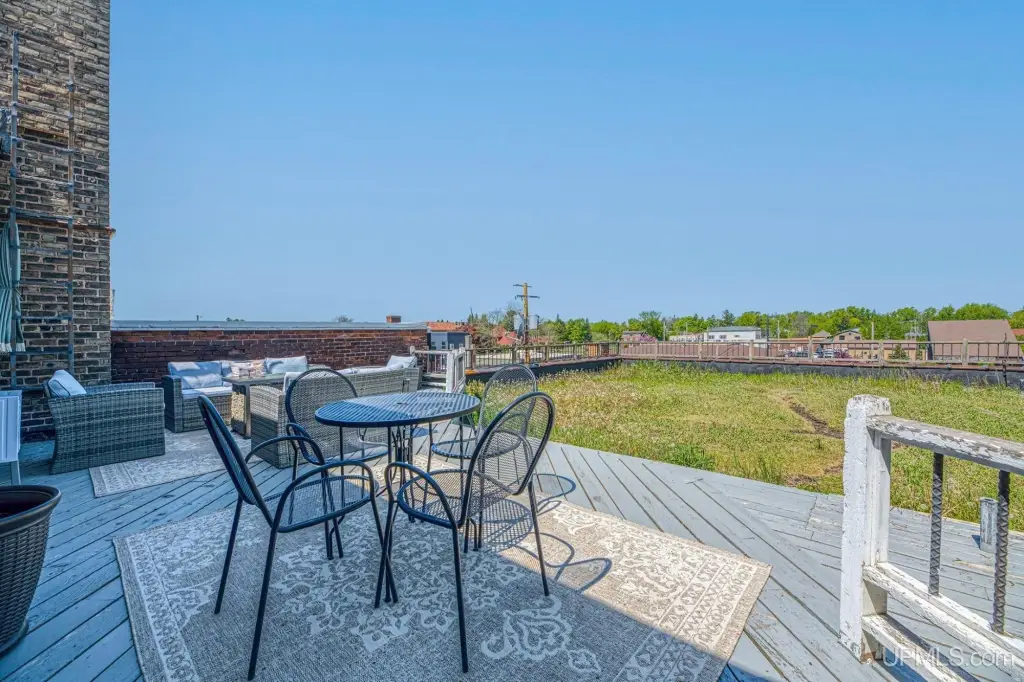
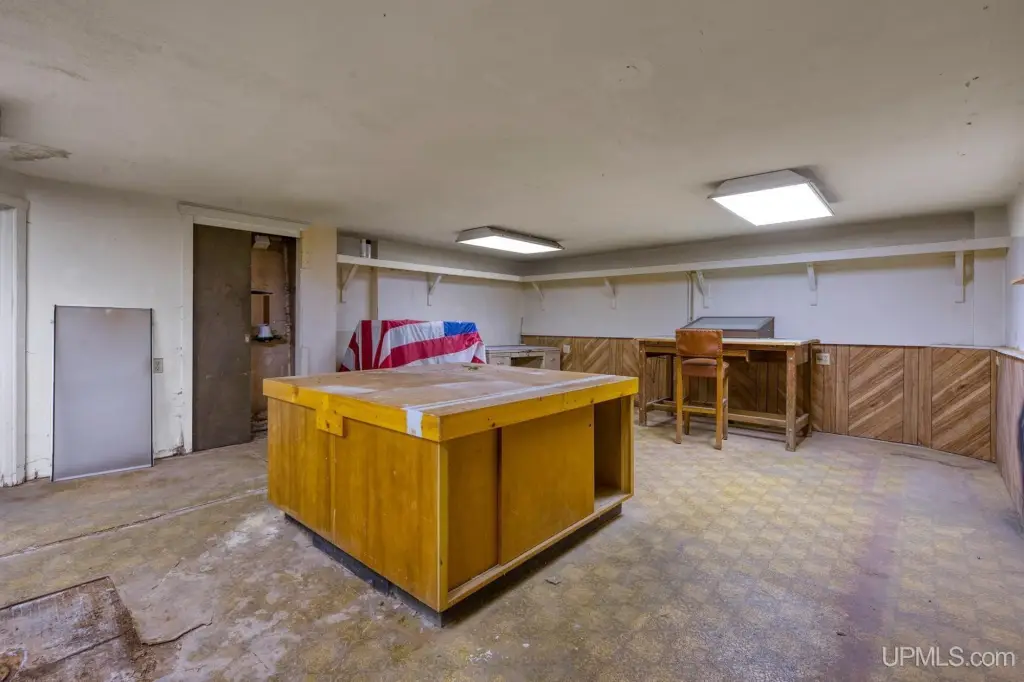
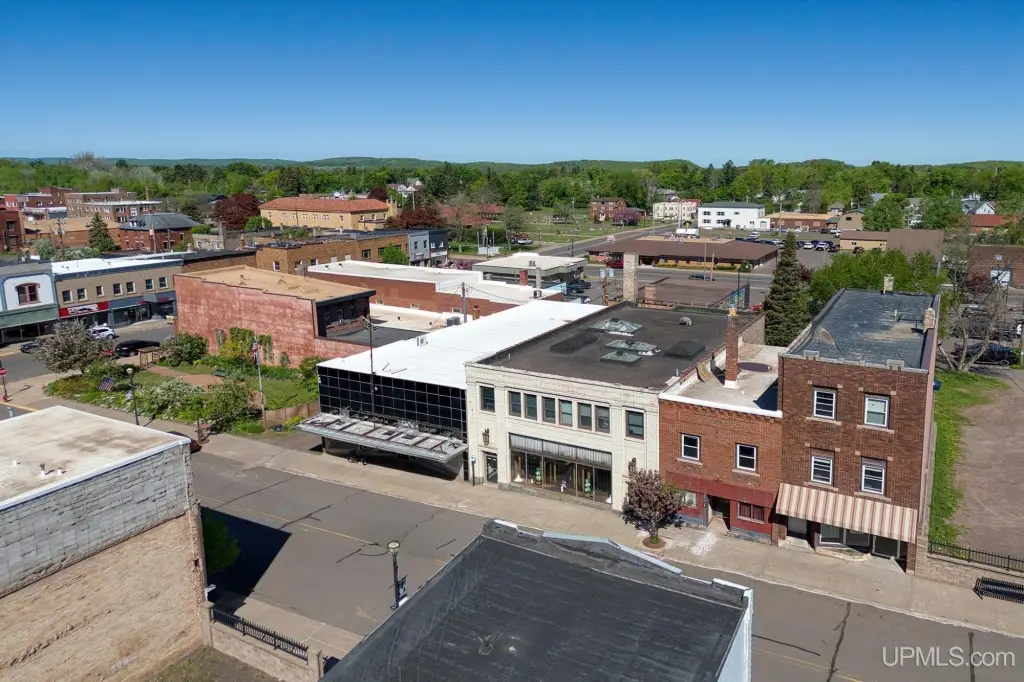
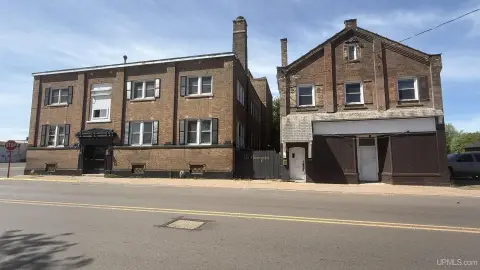
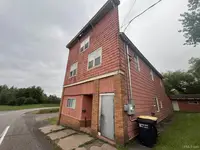
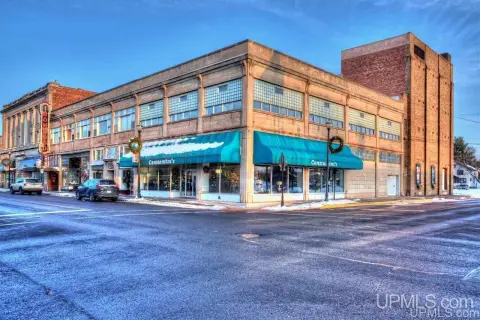
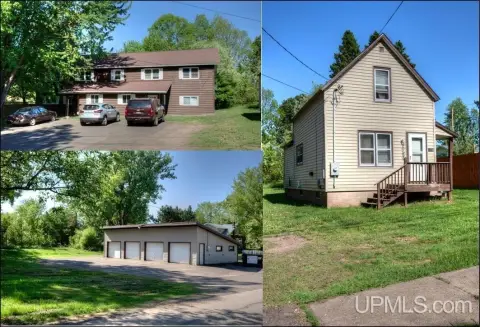
Built in 1900, this 7,093-square-foot mixed-use property combines adaptable commercial space with renovated residential accommodations. The main level provides over 4,200 square feet, multiple office areas, terrazzo flooring beneath carpet, and a shared hallway. Interior improvements include updated electrical and lighting systems, while the upper level has a separate entrance and a renovated loft featuring skylights, red oak flooring, a kitchen with newer appliances, three bedrooms, one and a half bathrooms, laundry, living space, dining space, and access to a patio and green area. A two-bedroom, one-bath apartment is also located on the second level and has a long-term renter.
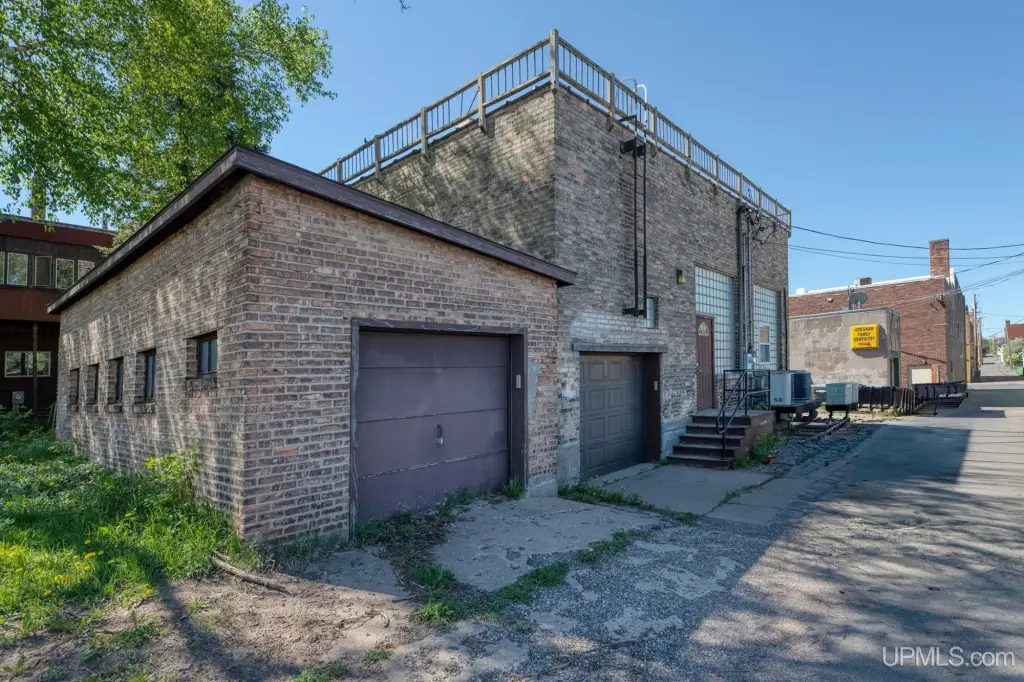
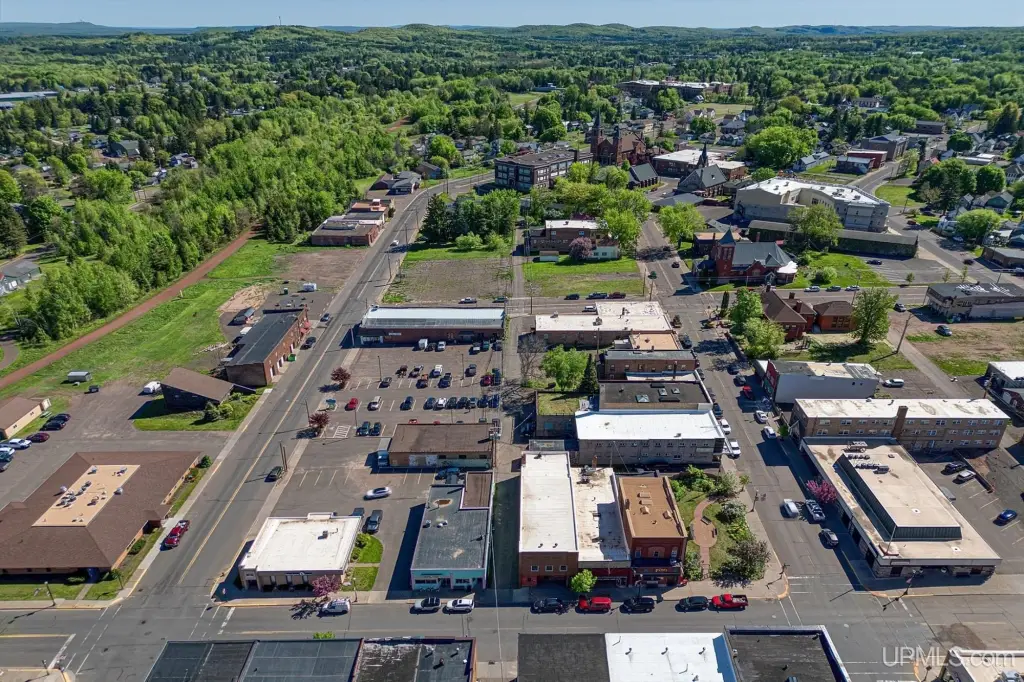
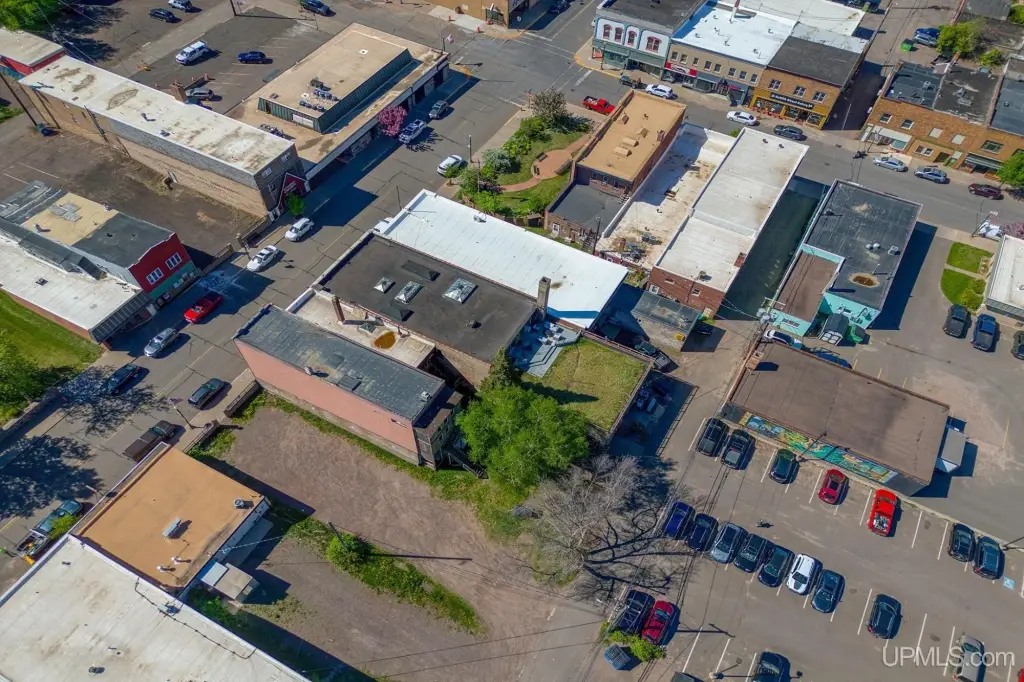
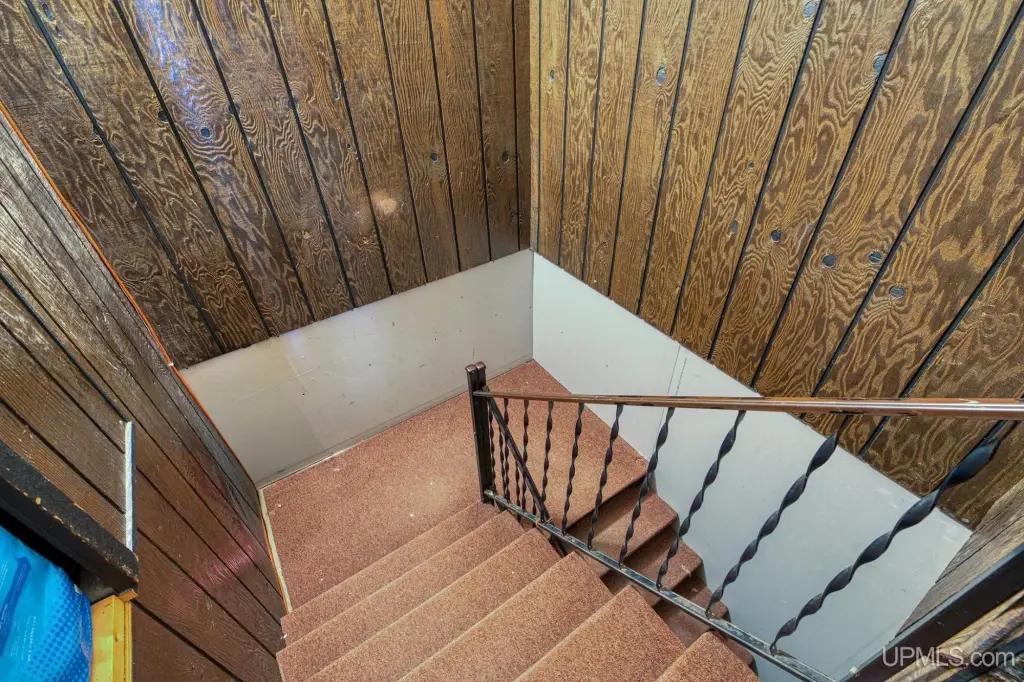
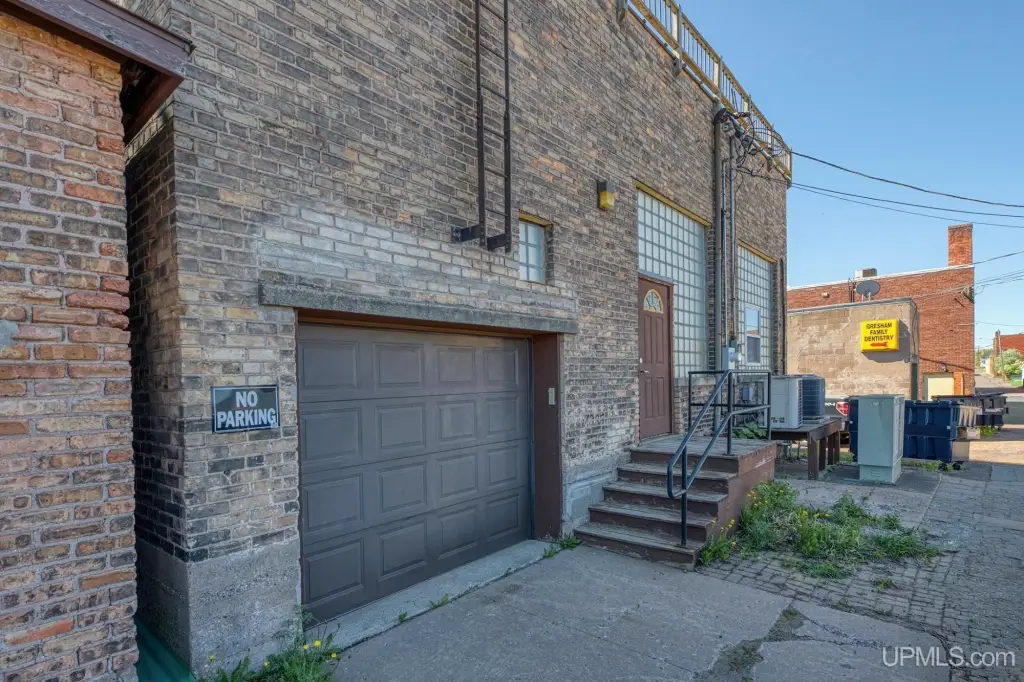
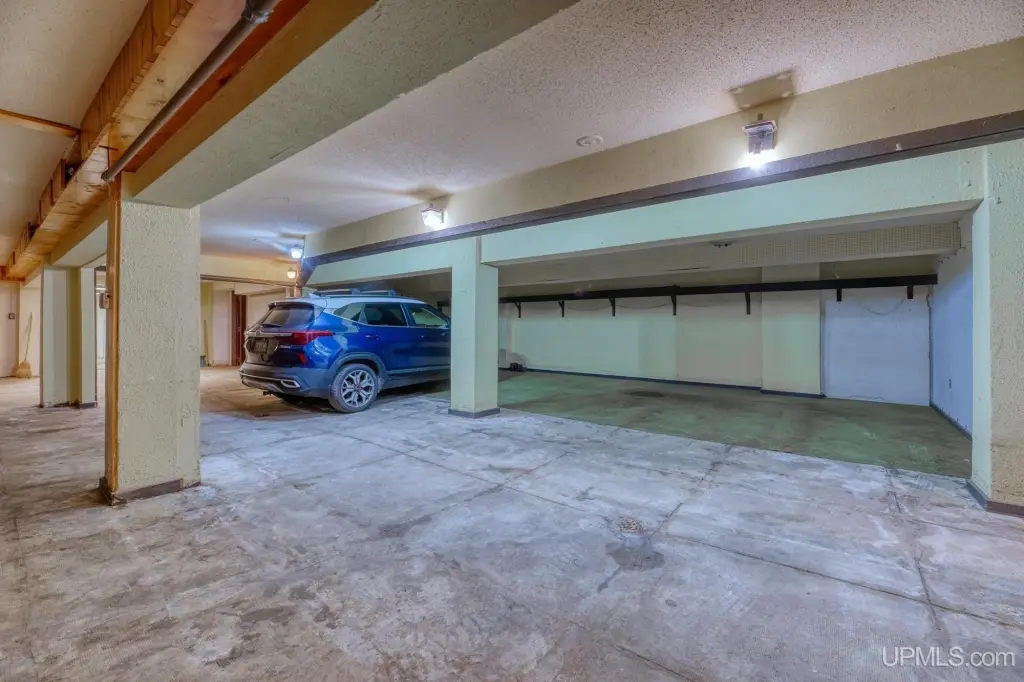
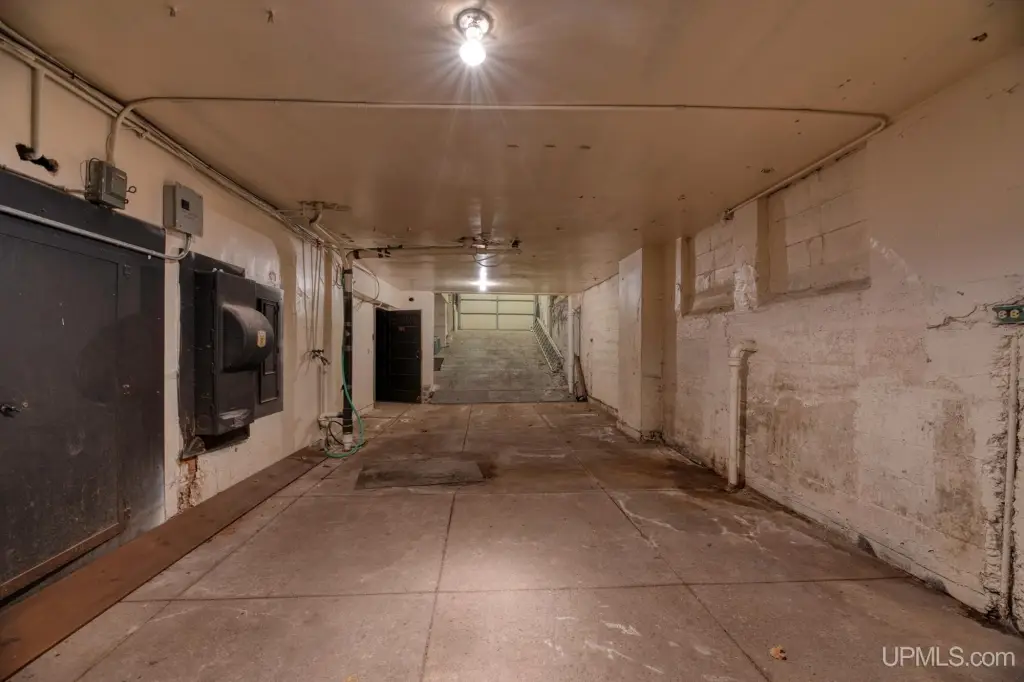
An underground, climate-controlled garage accommodates up to 8 vehicles and has two access points from the main level. The building is served by forced-air heat, central air, and public water. Located at 216 E Aurora Street in Ironwood, the property offers a varied configuration for commercial, office, residential, and short-term lodging uses identified in the existing property information.
An underground, climate-controlled garage accommodates up to 8 vehicles and has two access points from the main level. The building is served by forced-air heat, central air, and public water. Located at 216 E Aurora Street in Ironwood, the property offers a varied configuration for commercial, office, residential, and short-term lodging uses identified in the existing property information.
Key Highlights
- 7,093‑square‑foot mixed‑use building constructed in 1900
- Main level offers over 4,200 square feet with multiple office areas
- Renovated loft includes 3 bedrooms, 1.5 bathrooms, laundry, kitchen, and patio access
Financial Insights
Estimated NOI and Cap Rate
NOI / Yr
$25,237
Cap Rate
5.05%
Suggested Prices Based on Cap Rates
Cap Rate 5%
$504,740
$504.7K
Cap Rate 7%
$360,529
$360.5K
Cap Rate 9%
$280,411
$280.4K
Market Conditions
NOI Build-Up for 7,093 SF
Gross rent
$74.9K $10.56/SF
− Vacancy
−$29.0K −$4.09/SF
EGI
$45.9K $6.47/SF
− OpEx
−$20.6K −$2.91/SF
NOI
$25.2K $3.56/SF
Area
Gogebic County, MI
Vacancy
38.74%
Lease Rate
$10.56 /SF/Yr
Expense Ratio
45.00%
Simulate Cap Rate and NOI
Suggested Prices Based on Cap Rates
Cap Rate 5%
$504,740
Cap Rate 7%
$360,529
Cap Rate 9%
$280,411
Alternative Uses
Best Use
Office B
$1.26M
$1.10M – $1.47M
NOI $88,306 @ 7.0% cap · market cap 17.66%
Second Best
Mixed Use
$1.19M
$1.04M – $1.39M
NOI $83,329 @ 7.0% cap · market cap 16.67%
Theoretical Best
Office A
$1.51M
$1.32M – $1.76M
NOI $105,449 @ 7.0% cap · market cap 21.09%
Zoning and permitted uses should be independently verified with authorities.
How Realmo checks its estimates
Property Analytics
Unlock full access to Insights
Subscribe to Realmo Intelligence
Open Analytics
Current Use
Lease Details
Multi-tenant
Tenancy
Location Intelligence
Trade Area within ½ mile
403
Businesses Nearby
Explore this area
Business Placement
Demographics for 49938, MI
7,340
Population
4,728
Households
1.6
Avg Household Size
49
Median Age
23%
College-Educated
95%
High-School Grad
225.6 sq mi
ZIP Area
33
Density / Sq Mi
$44,379
Median Household Income
$34,553
Median Earnings
$590
Median Rent
$95,500
Median Home Value
Check the figures for this property
Cap Rate, Value Estimation, Potential NOI and more
View Realmo Analytics
Market
Vacancy Rate% for Office in Midwest region



Frequently Asked Questions
What type of property is this?
Mixed-use property - Flexible commercial and residential configuration with renovated interiors, office suites, a loft, and an apartment.
Where is this mixed-use property located?
The property is located at 216 E Aurora Street Ironwood, MI.
What is the asking price?
The asking price for this property is $499,900.
What are key features of this property?
This property features: 7,093‑square‑foot mixed‑use building constructed in 1900; Main level offers over 4,200 square feet with multiple office areas; Renovated loft includes 3 bedrooms, 1.5 bathrooms, laundry, kitchen, and patio access


