Mixed-Use Property in San
For Sale
$995,000
2144 Alvarado St, San Leandro, CA 94577
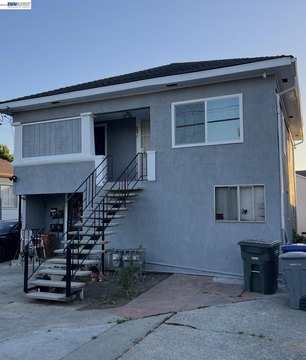
Industrial/Residential property with office and residential units, remodeled/upgraded.
Property Size1,933 SF
Price / SF$514.74
Days on Market465
Property Features for 2144 Alvarado St
General Information
Standard status
Active
Size
1,933 SF
Property subtype
Commercial/Industrial
Building Details
Year Built
1943
Listing Agency:
Michael Tanzillo R.E. Brkr
(510) 889-9157
Listed By:
Paul Mader · License #00795784
(510) 206-3156
Source:
Exitrealty
Added: Jul 15, 2025
Changed: Sep 9
Last Checked: Sep 15 at 5:53AM
Displayed information is deemed reliable but is not guaranteed and should be independently verified. All listing content including descriptions, pricing, images are the copyrighted material of Michael Tanzillo R.E. Brkr

Ask AI about this property
Review the available facts, identify missing information and prepare questions for the agent.
Investment Insights
Based on property information with market context.
This mixed-use property features a total gross building area of 1,933 square feet. Constructed in 1996, the office space measures approximately 672 square feet and includes a large room and a restroom. The residential component is a 3-bedroom, 1-bathroom house with approximately 1,261 square feet. The property has been remodeled and upgraded and is in good overall condition. The rear yard includes a covered parking area measuring 19 feet by 76 feet, as well as a detached garage/office area of approximately 351 square feet. This property is suitable for a small business owner or contractor seeking supplemental income from the 3-bedroom residential structure. The property will be delivered vacant at the close of escrow. Please do not disturb the tenants.
Key Highlights
- Industrial/Residential property ideal for small business owner/contractor.
- Includes a 3‑bedroom, 1‑bathroom residential house (1,261+/- sq ft) for supplemental income.
- Features office space (672+/- sq ft) constructed in 1996.
Financial Insights
Estimated NOI and Cap Rate
NOI / Yr
$39,143
Cap Rate
3.93%
Suggested Prices Based on Cap Rates
Cap Rate 5%
$782,860
$782.9K
Cap Rate 7%
$559,186
$559.2K
Cap Rate 9%
$434,922
$434.9K
Market Conditions
NOI Build-Up for 1,933 SF
Gross rent
$69.6K $36.00/SF
− Vacancy
−$7.0K −$3.60/SF
EGI
$62.6K $32.40/SF
− OpEx
−$23.5K −$12.15/SF
NOI
$39.1K $20.25/SF
Area
Alameda County, CA
Vacancy
10.00%
Lease Rate
$36.00 /SF/Yr
Expense Ratio
37.50%
Simulate Cap Rate and NOI
Suggested Prices Based on Cap Rates
Cap Rate 5%
$782,860
Cap Rate 7%
$559,186
Cap Rate 9%
$434,922
Alternative Uses
Best Use
Mixed Use
$559.2K
$489.3K – $652.4K
NOI $39,143 @ 7.0% cap · market cap 3.93%
Second Best
Office B
$558.1K
$488.3K – $651.1K
NOI $39,064 @ 7.0% cap · market cap 3.93%
Theoretical Best
Retail
$8.81M
$7.71M – $10.28M
NOI $616,872 @ 7.0% cap · market cap 62.00%
Zoning and permitted uses should be independently verified with authorities.
How Realmo checks its estimates
Property Analytics
Contact the owner directly
Get the owner's phone numbers and email
Open Analytics
Current Use
Location Intelligence
Trade Area within ½ mile
1,579
Businesses Nearby
Explore this area
Business Placement
Demographics for 94577, CA
48,868
Population
17,681
Households
2.8
Avg Household Size
41
Median Age
39%
College-Educated
86%
High-School Grad
8.1 sq mi
ZIP Area
6,033
Density / Sq Mi
$110,989
Median Household Income
$56,382
Median Earnings
$2,199
Median Rent
$824,900
Median Home Value
Check the figures for this property
Cap Rate, Value Estimation, Potential NOI and more
View Realmo Analytics
Market
Vacancy Rate% for Office in West region




Frequently Asked Questions
What type of property is this?
Mixed-use property - Industrial/Residential property with office and residential units, remodeled/upgraded.
Where is this mixed-use property located?
The property is located at 2144 Alvarado St San Leandro, CA.
What is the asking price?
The asking price for this property is $995,000.
What are key features of this property?
This property features: Industrial/Residential property ideal for small business owner/contractor.; Includes a 3‑bedroom, 1‑bathroom residential house (1,261+/- sq ft) for supplemental income.; Features office space (672+/- sq ft) constructed in 1996.


