Two-Building Apartment
For Sale
Contact for pricing
2139 Aberdeen Avenue, North Charleston, SC 29405
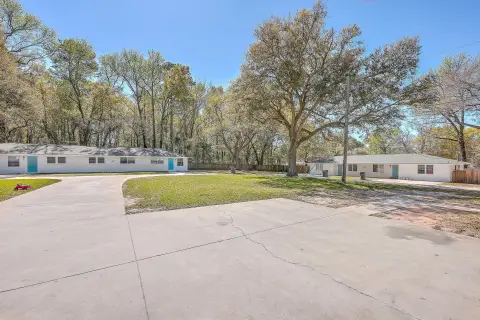
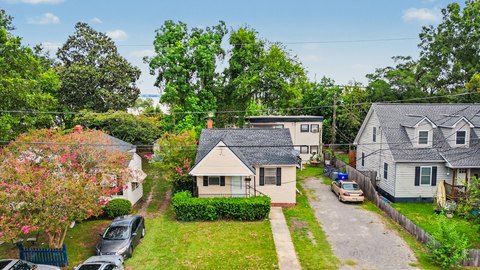
Two separate apartment buildings total eight 2-bedroom units, with seven currently leased and one recently renovated.
Property Size7,764 SF
Price / SF$166.80
Days on Market102
Property Features for 2139 Aberdeen Avenue
General Information
Standard status
Active
Size
7,764 SF
Class
B
Property subtype
Multifamily
Zoning
City of North Charleston - B-2 - General Business District
Occupancy
88%
Investment Type
Value Add
Additional Details
Business Included
Yes
Multifamily Units
8
Building Details
Year Built
1978
Units
8
Tenancy
Multi
Listing Agency:
The Boulevard Company
Listed By:
Al Simmons · License #SC 94799
Source:
Crexi
Added: Jul 4
Changed: Oct 5
Last Checked: Oct 12 at 8:24PM
Displayed information is deemed reliable but is not guaranteed and should be independently verified. All listing content including descriptions, pricing, images are the copyrighted material of The Boulevard Company
Investment Insights
Based on property information with market context.
This apartment complex consists of two separate buildings containing four 2-bedroom, 1.5-bath units per building. Seven of the eight units are currently leased, and one unit is being renovated. Additional space is available at the rear of the apartment complexes, where another rental property could possibly be added, subject to verification of feasibility.
The property is located at 2139 Aberdeen Avenue in North Charleston, SC 29405. The lot is accessible via Graverly Avenue.
Under the current setup, tenants pay all utilities except for water and sewer, which are paid by the seller. Please do not disturb tenants in place. Requests to view the unit that is being renovated require at least 24 to 48 hours’ notice, and the sellers will require an LOI or PSA before viewing any occupied unit. All information is furnished for buyer verification.
The property is located at 2139 Aberdeen Avenue in North Charleston, SC 29405. The lot is accessible via Graverly Avenue.
Under the current setup, tenants pay all utilities except for water and sewer, which are paid by the seller. Please do not disturb tenants in place. Requests to view the unit that is being renovated require at least 24 to 48 hours’ notice, and the sellers will require an LOI or PSA before viewing any occupied unit. All information is furnished for buyer verification.
Key Highlights
- Two separate apartment buildings with total of 8 units
- Each building has four 2‑bedroom, 1.5‑bath units (8 total)
- 7 units are currently leased, with 1 unit recently renovated
Financial Insights
Estimated NOI and Cap Rate
NOI / Yr
$95,516
Cap Rate
7.38%
Suggested Prices Based on Cap Rates
Cap Rate 5%
$1,910,320
$1.9M
Cap Rate 7%
$1,364,514
$1.4M
Cap Rate 9%
$1,061,289
$1.1M
Market Conditions
NOI Build-Up for 7,764 SF
Gross rent
$186.3K $24.00/SF
− Vacancy
−$12.7K −$1.63/SF
EGI
$173.7K $22.37/SF
− OpEx
−$78.1K −$10.07/SF
NOI
$95.5K $12.30/SF
Area
North Charleston, SC
Vacancy
6.80%
Lease Rate
$24.00 /SF/Yr
Expense Ratio
45.00%
Simulate Cap Rate and NOI
Suggested Prices Based on Cap Rates
Cap Rate 5%
$1,910,320
Cap Rate 7%
$1,364,514
Cap Rate 9%
$1,061,289
Alternative Uses
Best Use
Apartment 5plus
$1.36M
$1.19M – $1.59M
NOI $95,516 @ 7.0% cap · market cap 7.38%
Second Best
—
—
no second resolved use
Theoretical Best
Office A
$2.11M
$1.84M – $2.46M
NOI $147,578 @ 7.0% cap · market cap 11.40%
Zoning and permitted uses should be independently verified with authorities.
How Realmo checks its estimates
Property Analytics
Unlock full access to Insights
Subscribe to Realmo Intelligence
Open Analytics
Current Use
Lease Details
8
Residential units
87.5%
Occupancy
Turnkey business
Opportunity
Location Intelligence
Trade Area within ½ mile
458
Businesses Nearby
Explore this area
Business Placement
Demographics for 29405, SC
25,620
Population
13,058
Households
2
Avg Household Size
37
Median Age
27%
College-Educated
84%
High-School Grad
14.7 sq mi
ZIP Area
1,743
Density / Sq Mi
$54,566
Median Household Income
$35,887
Median Earnings
$1,196
Median Rent
$266,200
Median Home Value
Check the figures for this property
Cap Rate, Value Estimation, Potential NOI and more
View Realmo Analytics
Market
Vacancy Rate% for Multifamily in South region

Questions? Ask Rey
Realmo’s AI knows this listing — price, zoning, demand, history. Ask anything.


Frequently Asked Questions
What type of property is this?
Apartment building - Two separate apartment buildings total eight 2-bedroom units, with seven currently leased and one recently renovated.
Where is this apartment building located?
The property is located at 2139 Aberdeen Avenue North Charleston, SC.
What is the asking price?
The asking price for this property is $1,295,000.
What are key features of this property?
This property features: Two separate apartment buildings with total of 8 units; Each building has four 2‑bedroom, 1.5‑bath units (8 total); 7 units are currently leased, with 1 unit recently renovated


