Renovated Triplex with Off-Street
For Sale
$725,000
213 S Main St, Oxford, OH 45056
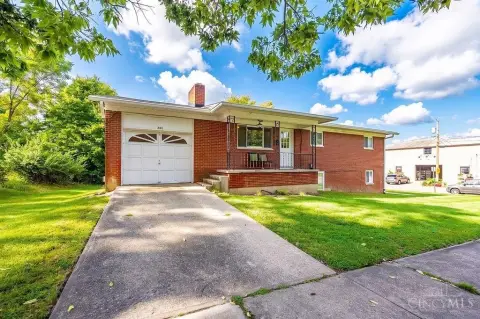
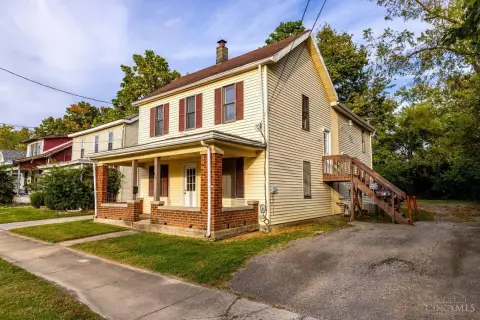
Three two-bedroom units feature updated interiors, private yard space, and assigned parking.
Property Size2,900 SF
Price / SF$250
Days on Market84
Property Features for 213 S Main St
General Information
Standard status
Active
Size
2,900 SF
Property subtype
Multi-Family
Building Details
Year Built
1973
Listing Agency:
RE/MAX Alpha Real Estate
Listed By:
Brian Revalee · License #RB15000186
(513) 523-6358
Source:
Missyfriede
Added: Jul 24
Changed: Oct 3
Last Checked: Oct 7 at 3:51PM
Displayed information is deemed reliable but is not guaranteed and should be independently verified. All listing content including descriptions, pricing, images are the copyrighted material of RE/MAX Alpha Real Estate
Investment Insights
Based on property information with market context.
This 2,900-square-foot triplex, built in 1973, contains three residential units with a consistent two-bedroom, 1.5-bath layout. Renovations include refreshed flooring, interior paint, air-conditioning systems, kitchens, and doors, providing updated finishes throughout the property.
The property is positioned approximately a block and a half from Uptown Oxford and High Street. Exterior features include a large yard and assigned off-street parking, adding practical site amenities to the multifamily configuration.
The property is positioned approximately a block and a half from Uptown Oxford and High Street. Exterior features include a large yard and assigned off-street parking, adding practical site amenities to the multifamily configuration.
Key Highlights
- Three‑unit triplex with 2 bedrooms and 1.5 baths in each unit
- 2,900 SF multifamily property built in 1973
- Renovated flooring, paint, A/C, kitchens, and doors
Financial Insights
Estimated NOI and Cap Rate
NOI / Yr
$28,282
Cap Rate
3.90%
Suggested Prices Based on Cap Rates
Cap Rate 5%
$565,640
$565.6K
Cap Rate 7%
$404,029
$404.0K
Cap Rate 9%
$314,244
$314.2K
Market Conditions
NOI Build-Up for 2,900 SF
Gross rent
$43.5K $15.00/SF
− Vacancy
−$3.1K −$1.07/SF
EGI
$40.4K $13.93/SF
− OpEx
−$12.1K −$4.18/SF
NOI
$28.3K $9.75/SF
Area
Butler County, OH
Vacancy
7.12%
Lease Rate
$15.00 /SF/Yr
Expense Ratio
30.00%
Simulate Cap Rate and NOI
Suggested Prices Based on Cap Rates
Cap Rate 5%
$565,640
Cap Rate 7%
$404,029
Cap Rate 9%
$314,244
Alternative Uses
Best Use
Multifamily LT 5
$404.0K
$353.5K – $471.4K
NOI $28,282 @ 7.0% cap · market cap 3.90%
Second Best
Apartment 5plus
$371.8K
$325.3K – $433.8K
NOI $26,026 @ 7.0% cap · market cap 3.59%
Theoretical Best
Office A
$573.4K
$501.7K – $669.0K
NOI $40,137 @ 7.0% cap · market cap 5.54%
Zoning and permitted uses should be independently verified with authorities.
How Realmo checks its estimates
Property Analytics
Current Use
Location Intelligence
Trade Area within ½ mile
1,073
Businesses Nearby
Explore this area
Business Placement
Demographics for 45056, OH
28,892
Population
9,702
Households
3
Avg Household Size
25
Median Age
54%
College-Educated
97%
High-School Grad
74.7 sq mi
ZIP Area
387
Density / Sq Mi
$53,413
Median Household Income
$9,944
Median Earnings
$1,004
Median Rent
$247,700
Median Home Value
Market
Vacancy Rate% for Multifamily in Midwest region

Questions? Ask Rey
Realmo’s AI knows this listing — price, zoning, demand, history. Ask anything.



Frequently Asked Questions
What type of property is this?
Triplex - Three two-bedroom units feature updated interiors, private yard space, and assigned parking.
Where is this triplex located?
The property is located at 213 S Main St Oxford, OH.
What is the asking price?
The asking price for this property is $725,000.
What are key features of this property?
This property features: Three‑unit triplex with 2 bedrooms and 1.5 baths in each unit; 2,900 SF multifamily property built in 1973; Renovated flooring, paint, A/C, kitchens, and doors