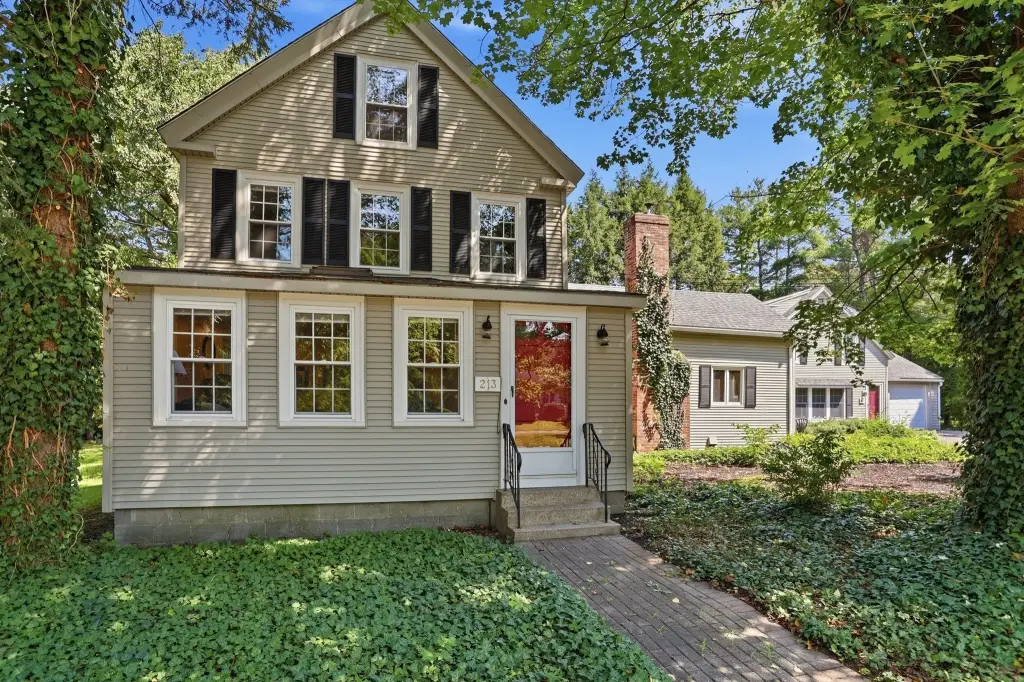
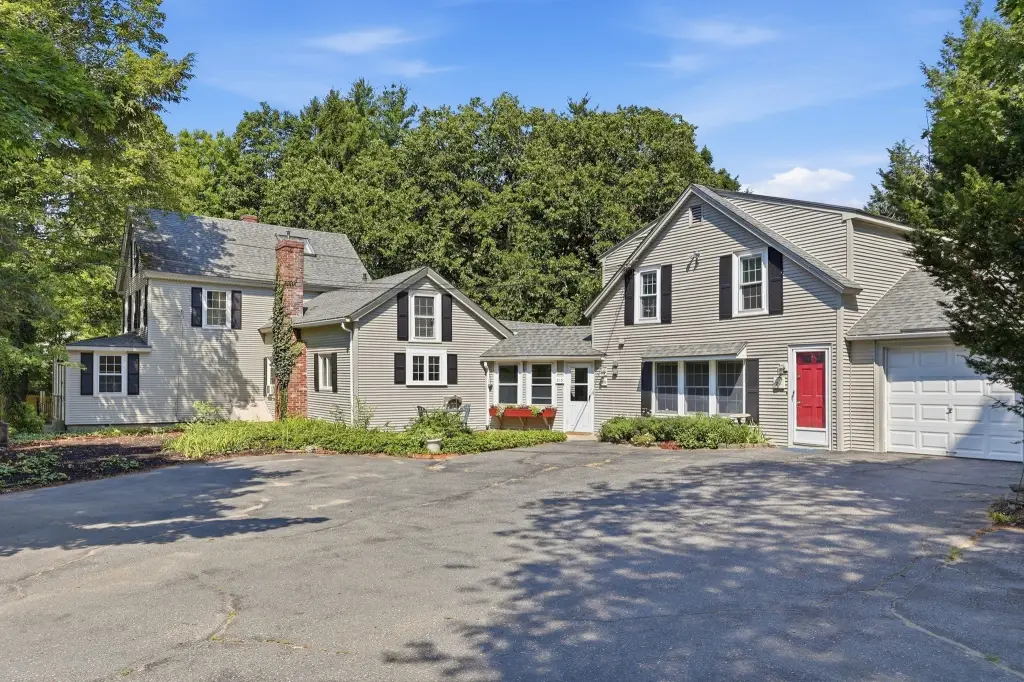
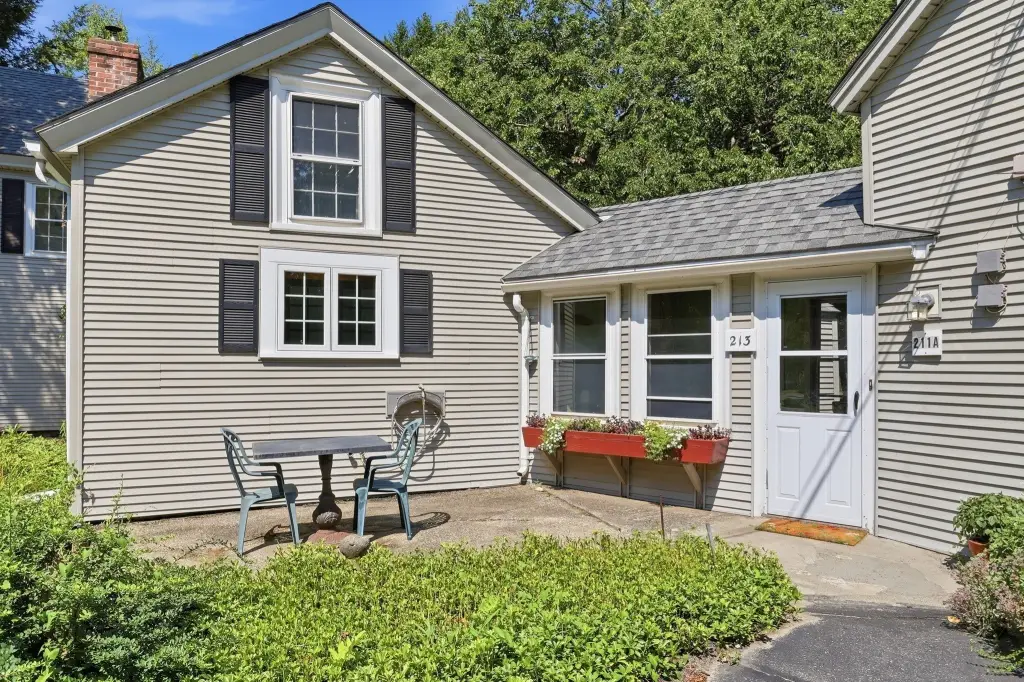
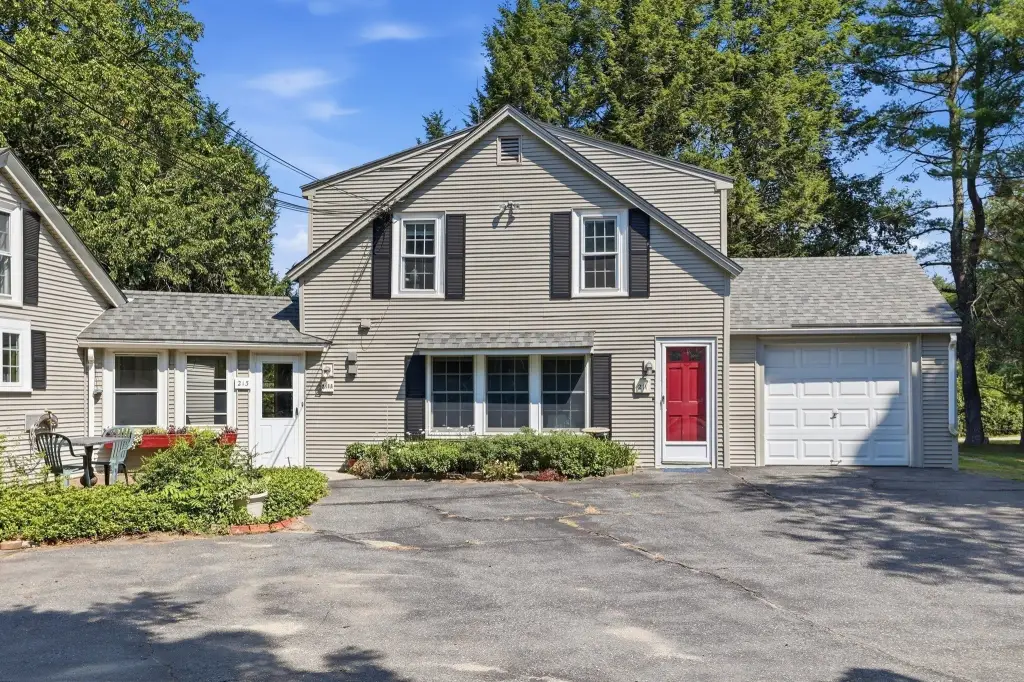
Triplex with Detached Three-Bay
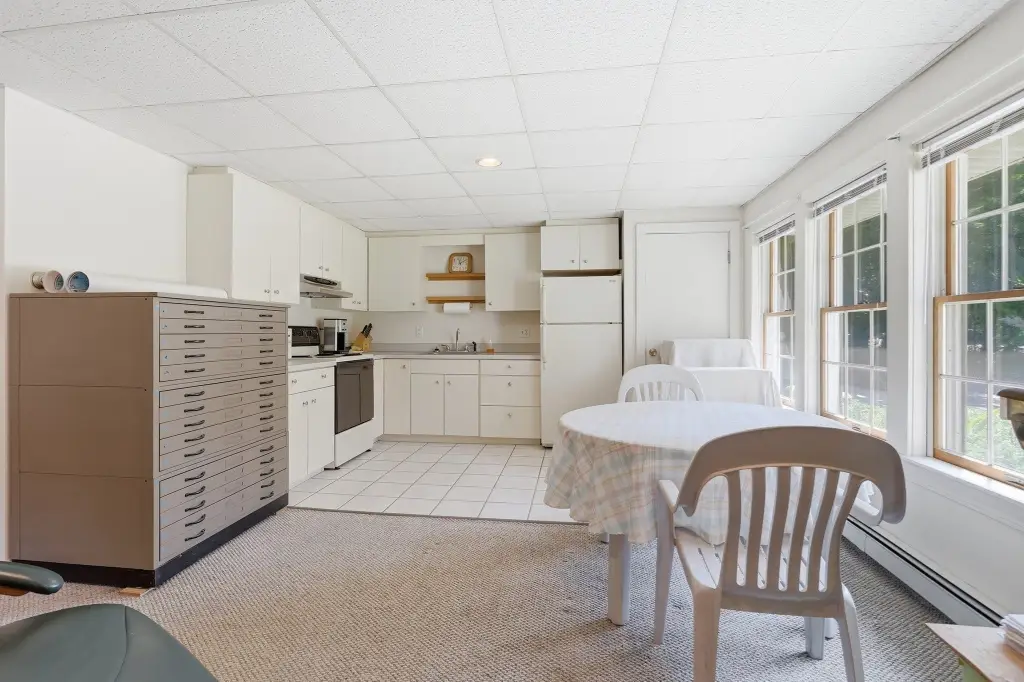
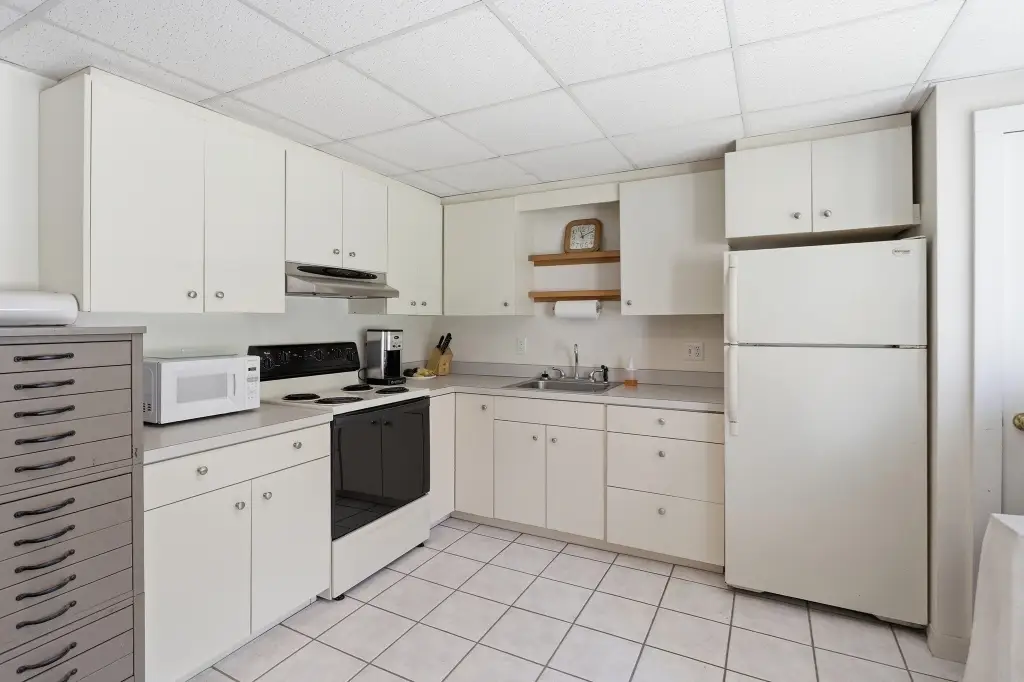
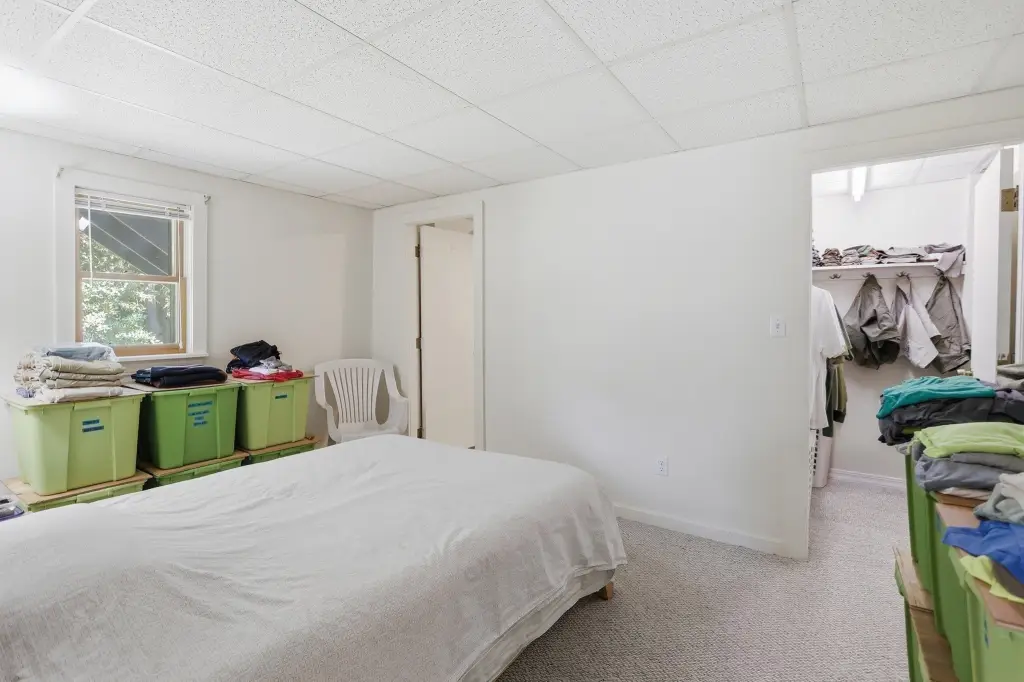
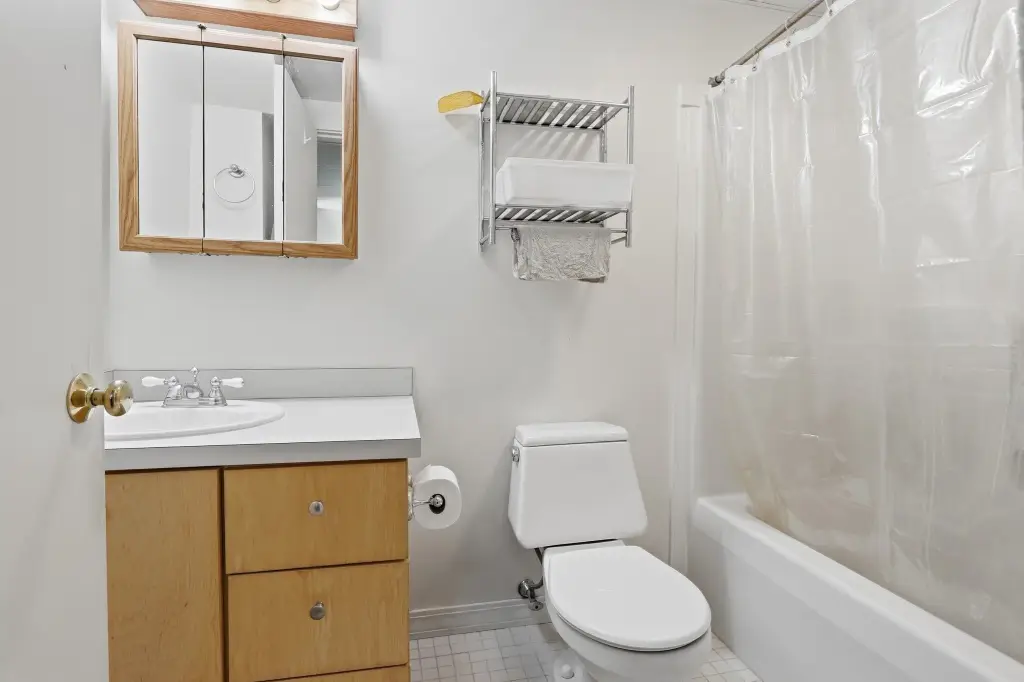
For Sale
$849,000
Pending
213 Great Road, Stow, MA 01775
Residential Income, Stow, MA
Property Size3,323 SF
Lot Size1.60 Acres
Days on Market47
Property Features for 213 Great Road
General Information
Property type
Residential Multi Family
Property subtype
Other
Zoning
R
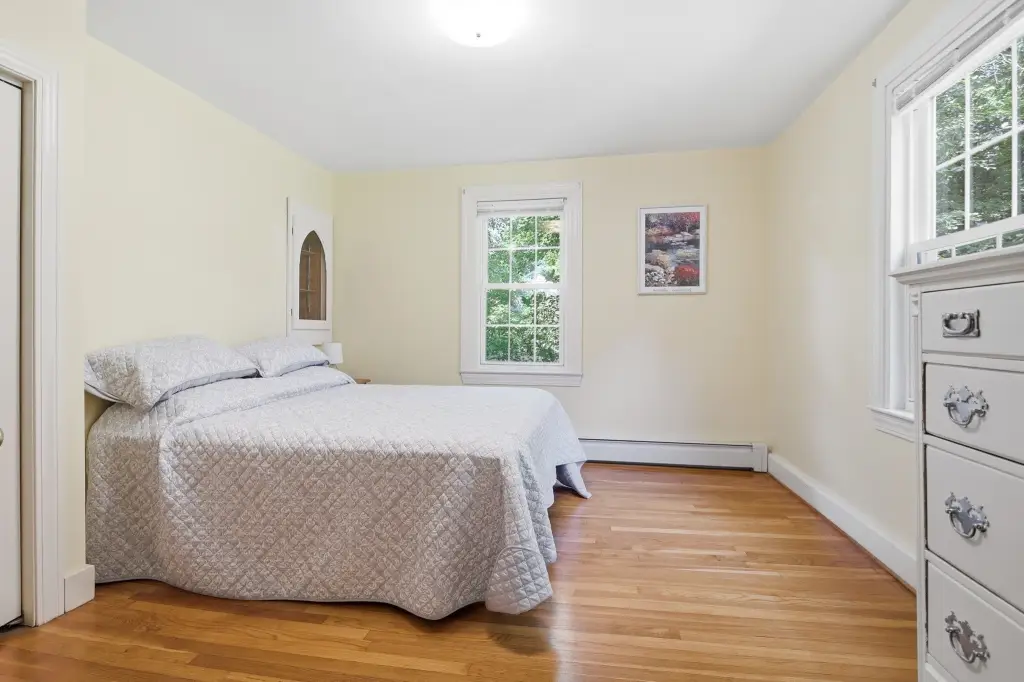
Bedrooms
5
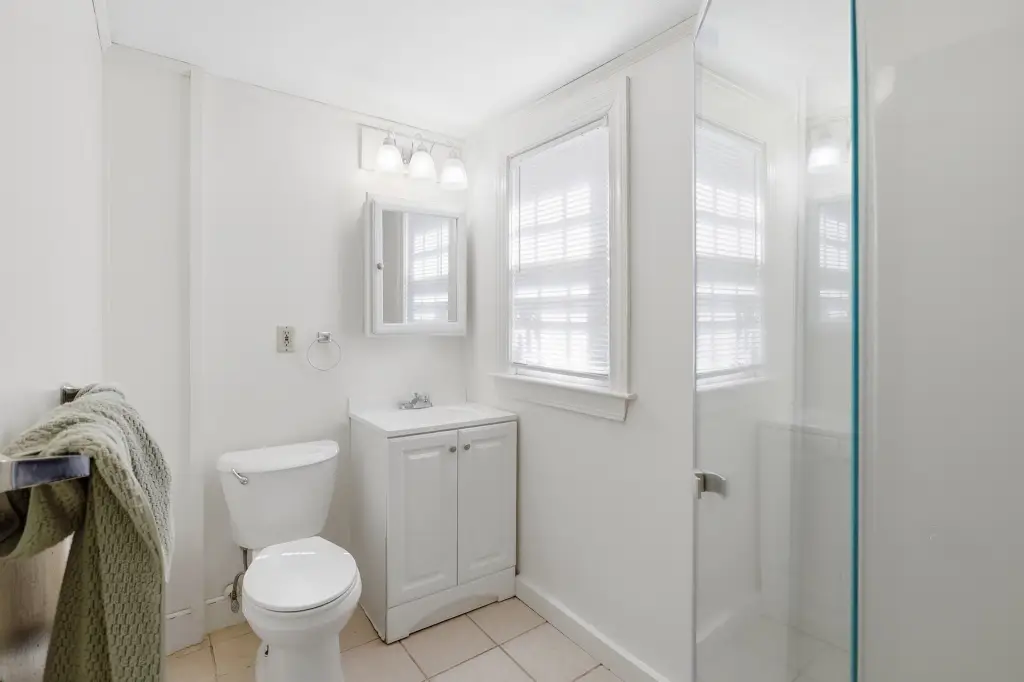
Bathrooms
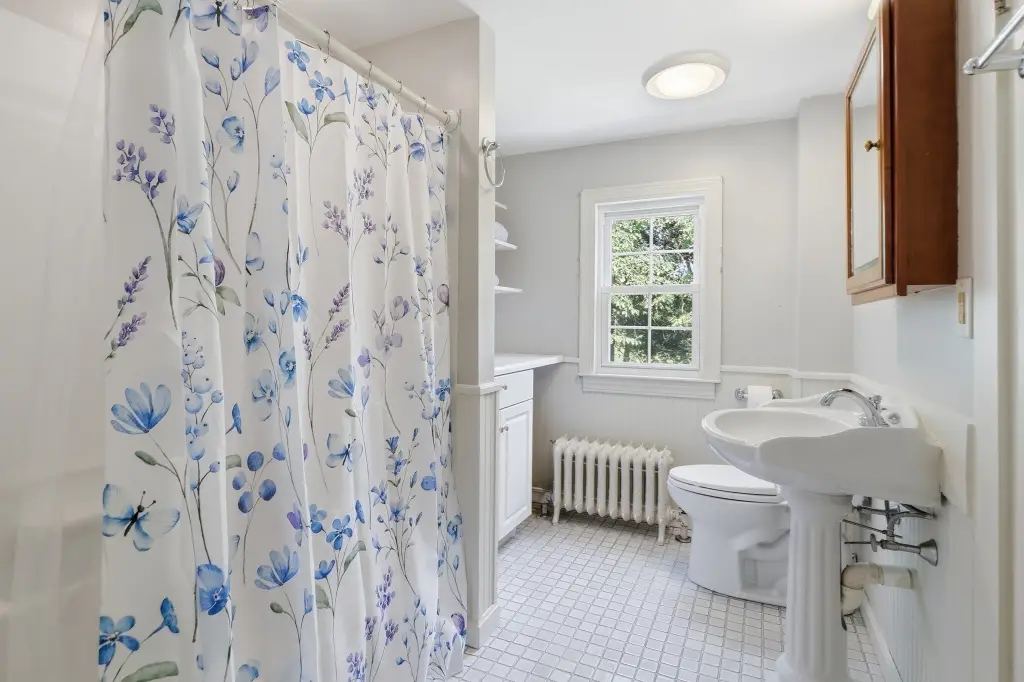
4
Full bathrooms
4
Rooms
Bedroom 5, Bedroom 2, Bedroom 3, Bedroom 4, Bathroom 4, Bathroom 3, Bathroom 1, Bedroom 1, Bathroom 2
Parking
14
Fireplace
1
Elementary school
The Center School
Middle school
Hale Middle School
High school
Nashoba Regional High School
Directions
Great Rd at the corner of Deerfield Ln
Standard status
Pending
APN
778052
Size
3,323 SF
Lot size
1.60 Acres
Taxes and HOA fees
Tax Year
2026
Tax Annual Amount
12930
Amenities
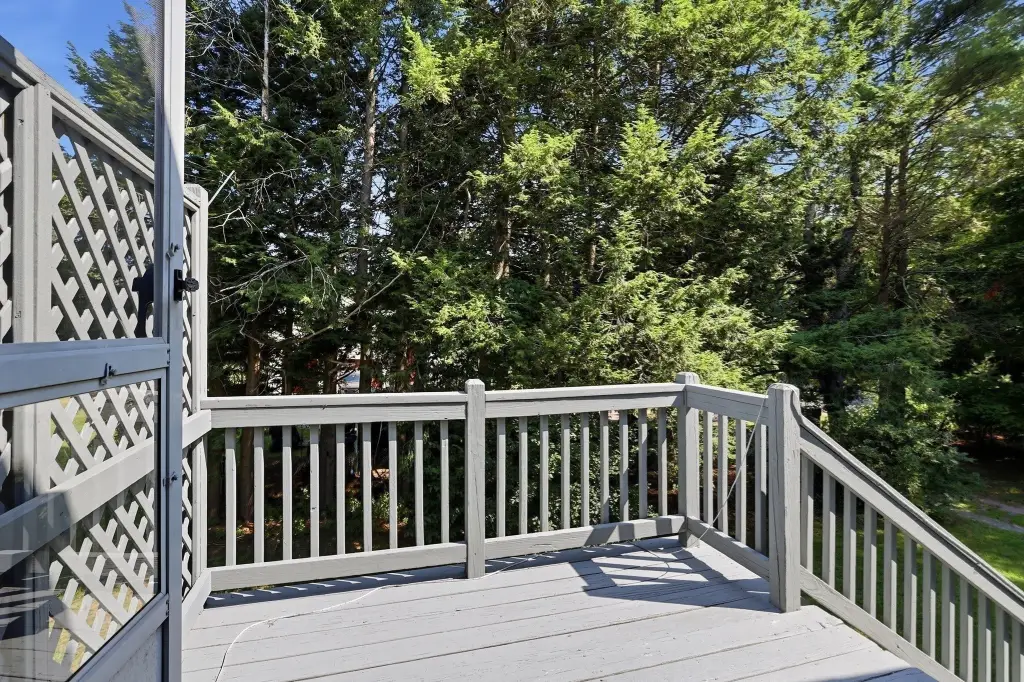
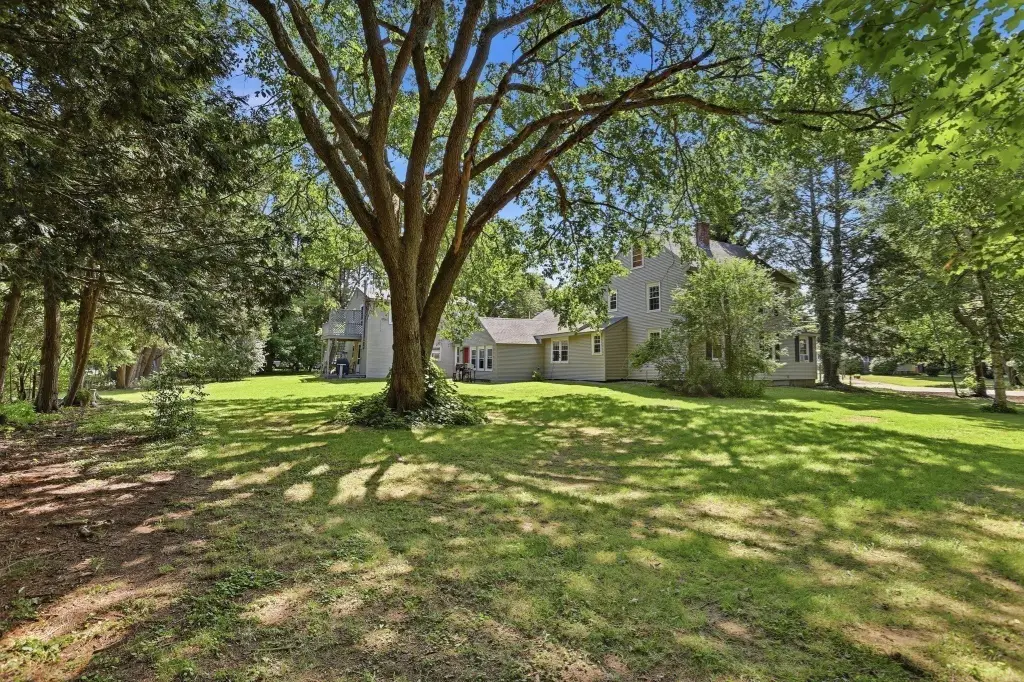
large yard
Building Details
Year built
1900
Floors in Building
4
Number of units
3
Listing Agency:
Keller Williams Realty Boston Northwest
Listed By:
Christina Hill
(978) 369-5775
Added: Sep 9
Changed: Oct 24
Last Checked: Oct 25 at 6:06PM
MLS# 73574545
Copyright © 2026 MLS Property Information Network Inc. All rights reserved. All information provided by the listing agent/broker is deemed reliable but is not guaranteed and should be independently verified.

Ask AI about this property
Review the available facts, identify missing information and prepare questions for the agent.
Investment Insights
Based on property information with market context.
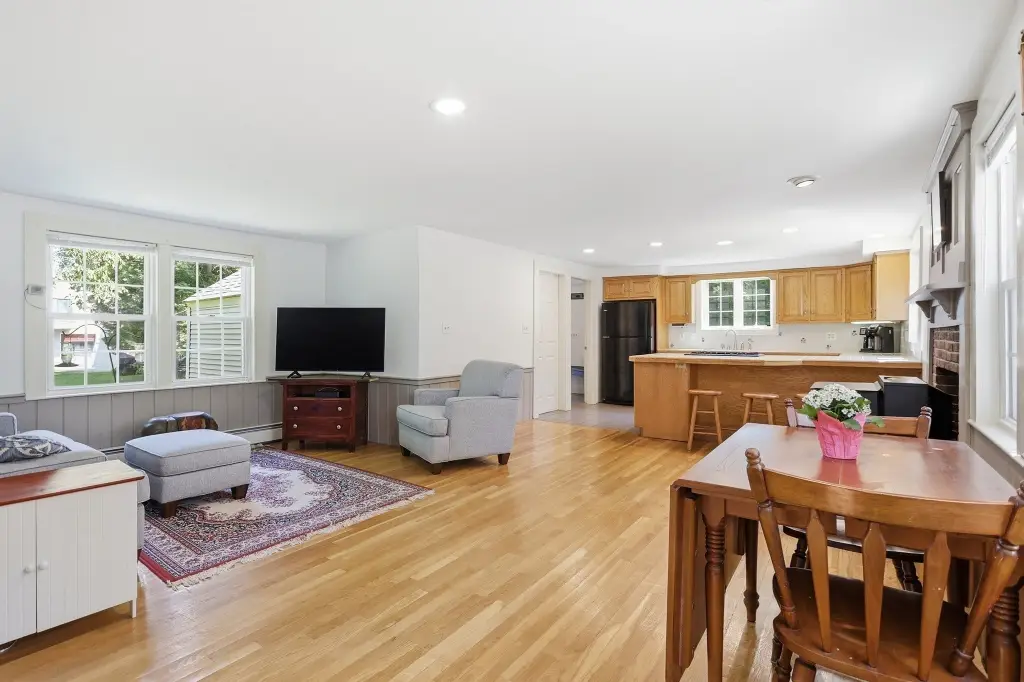
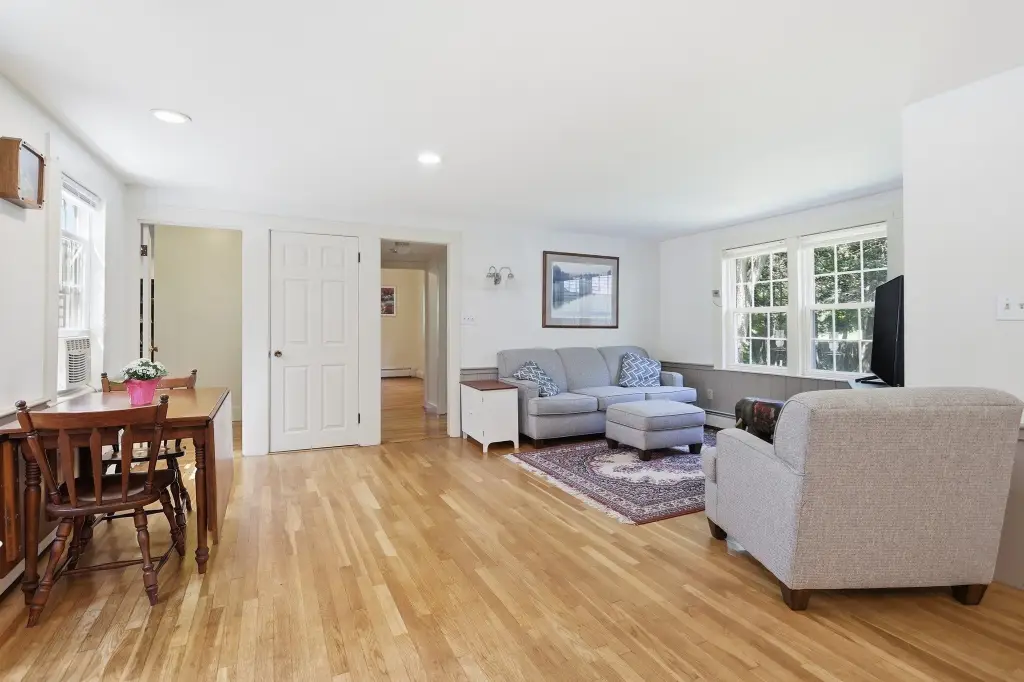
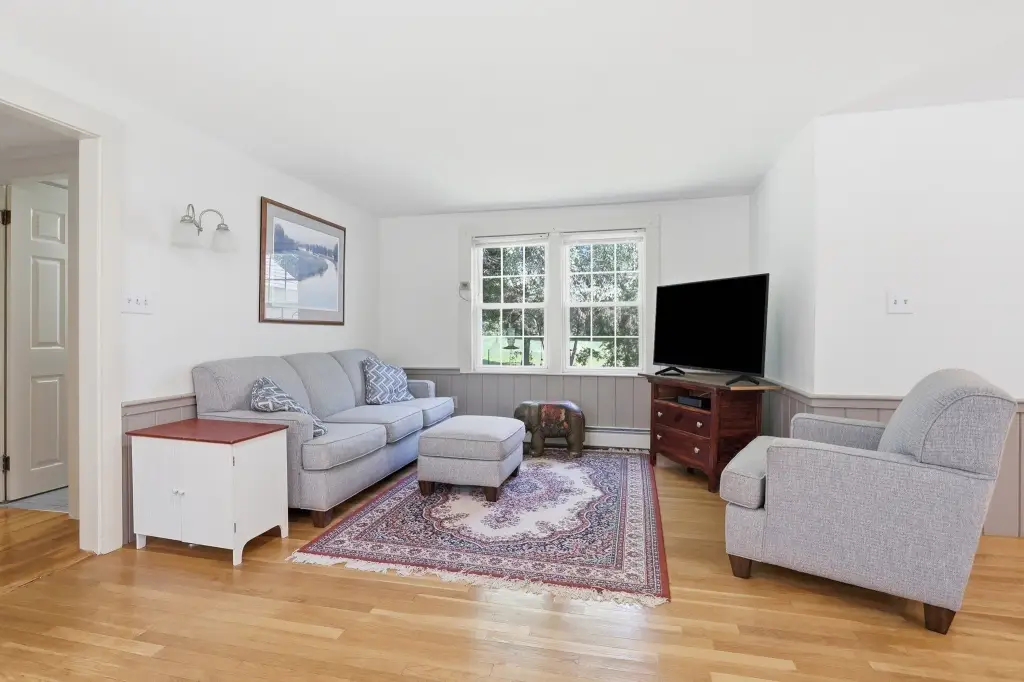
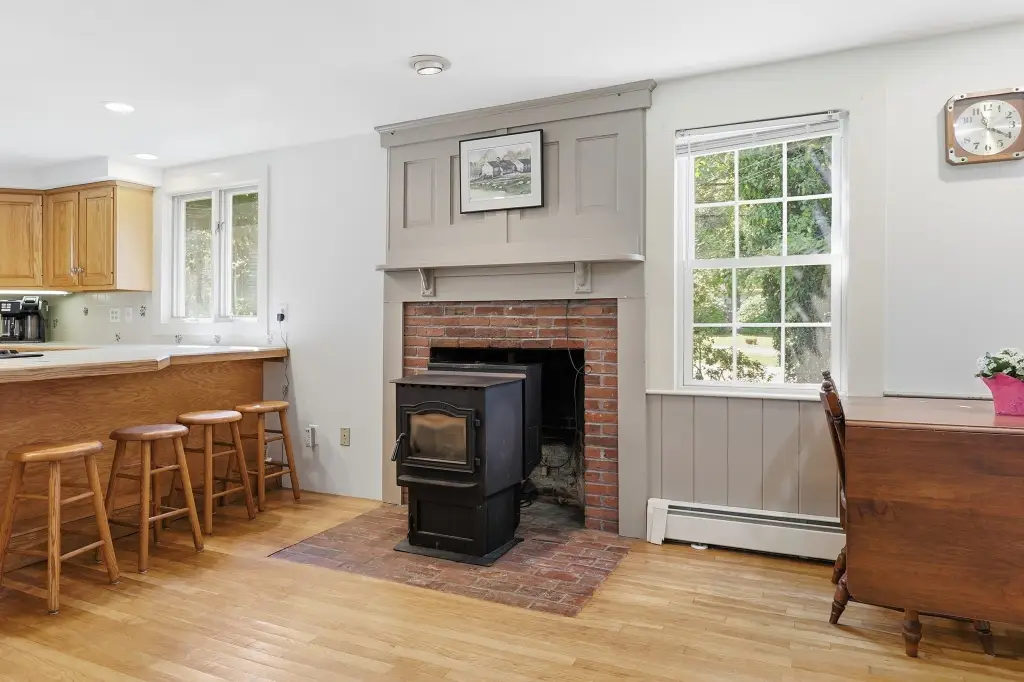
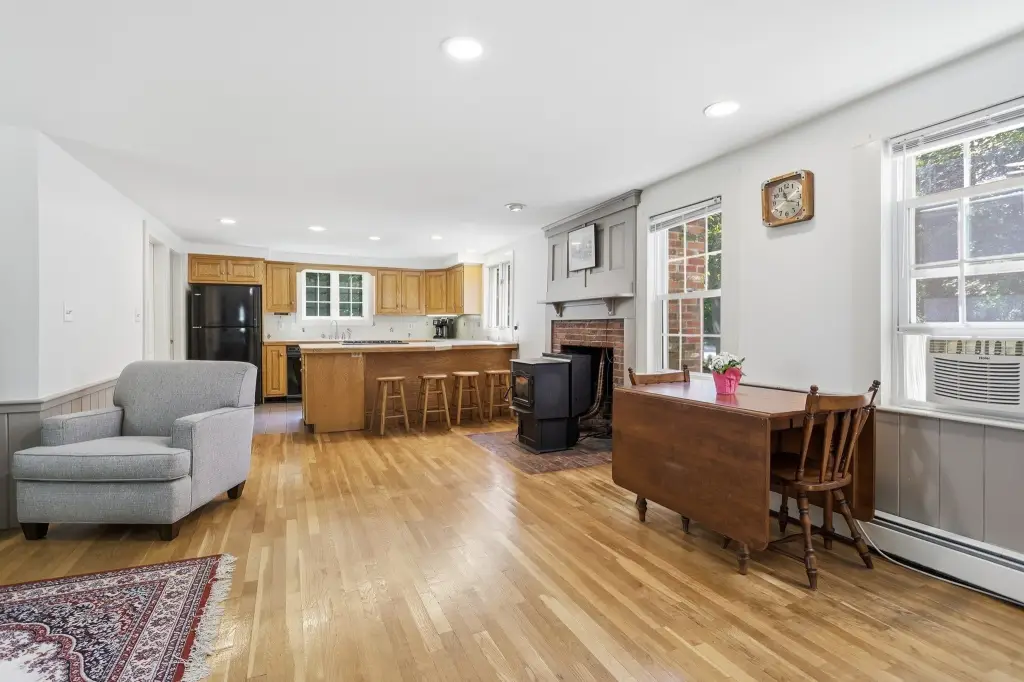
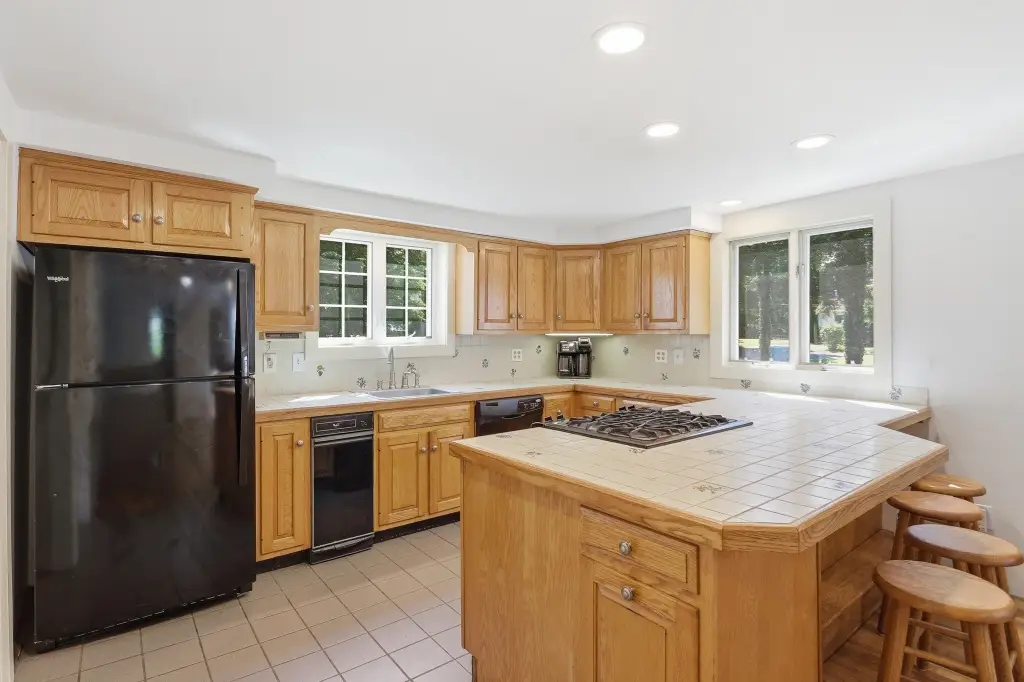
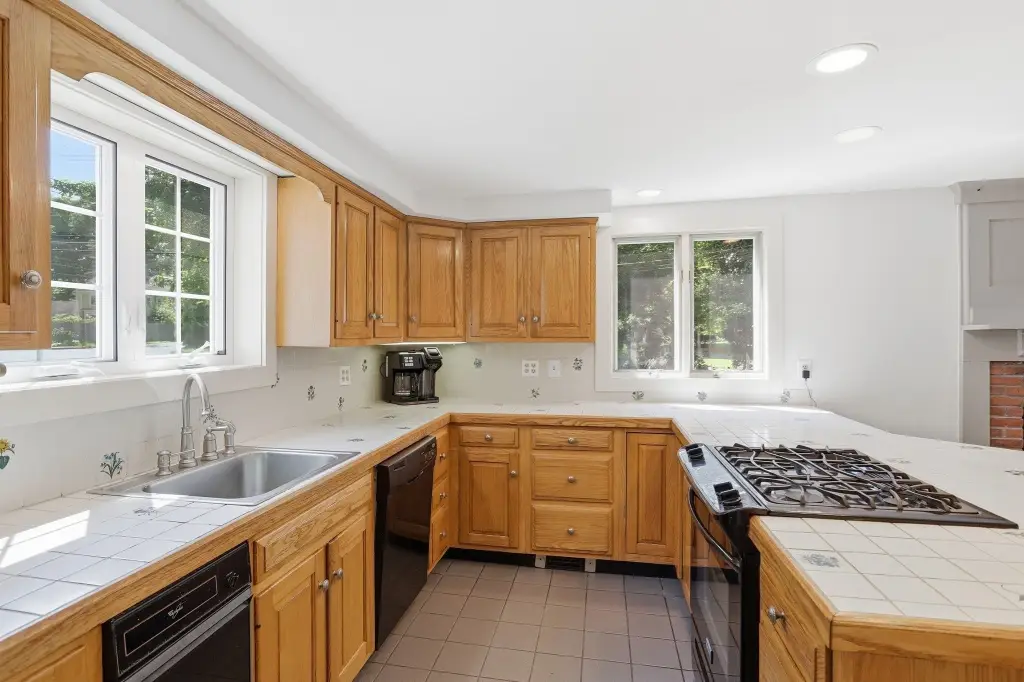
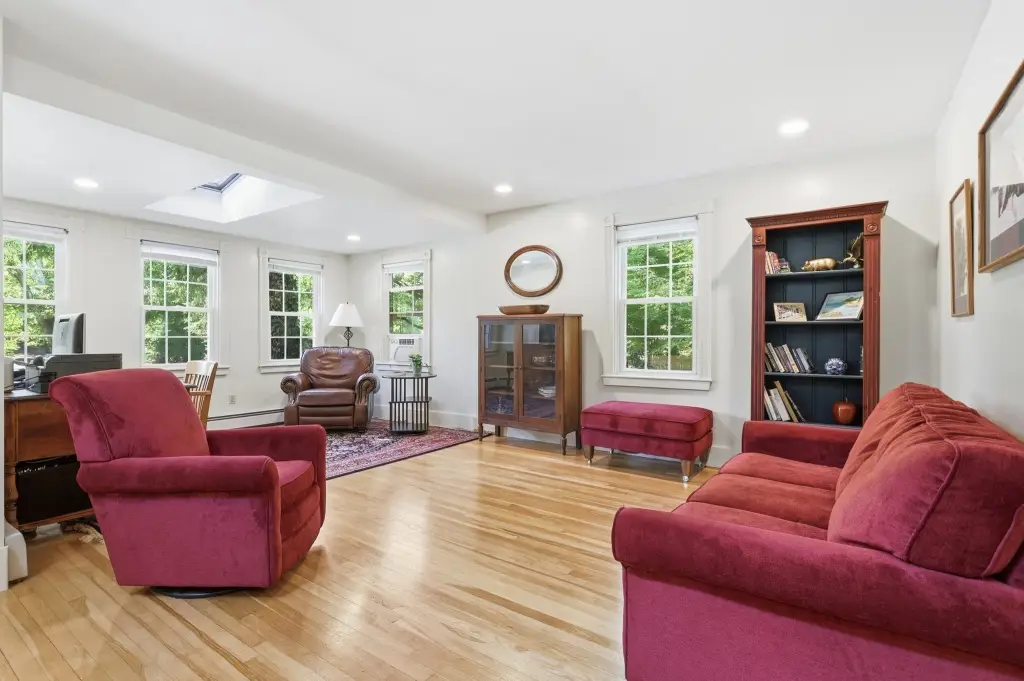
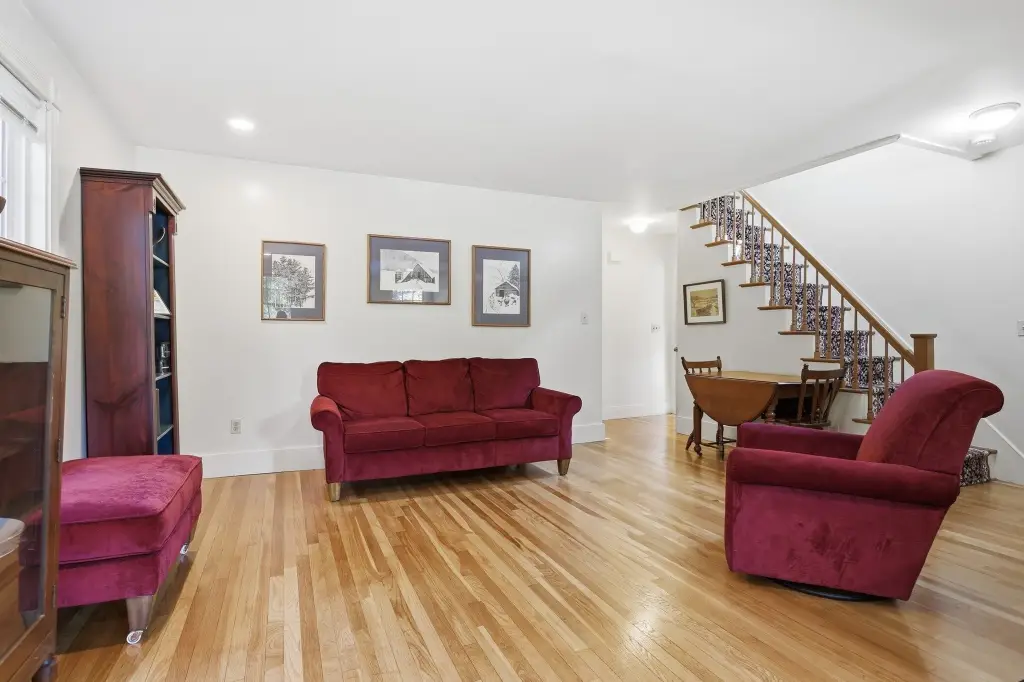
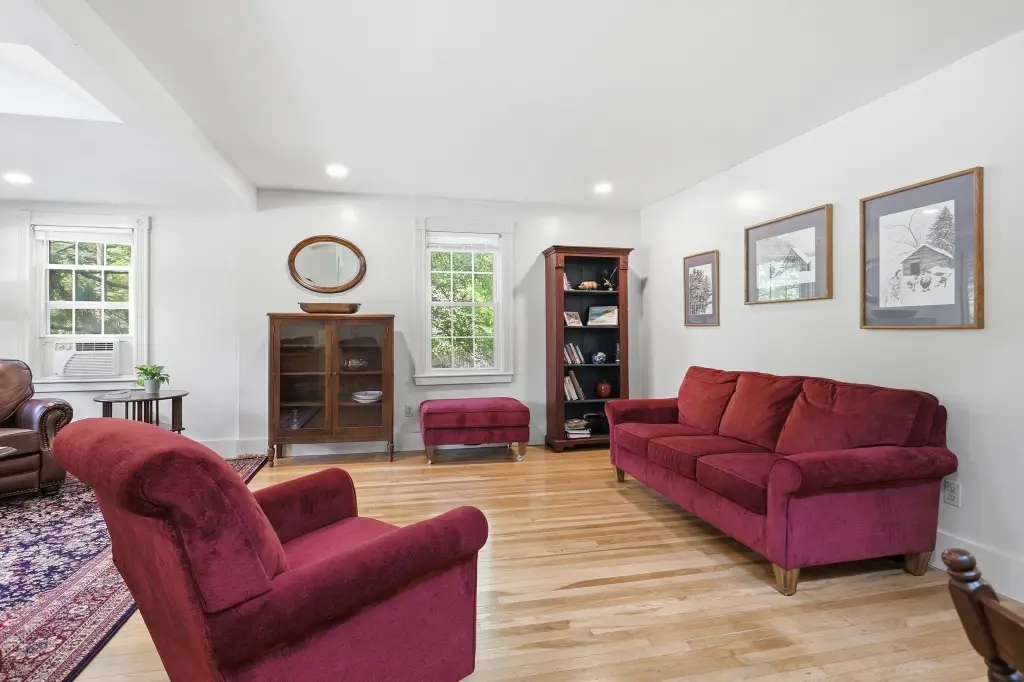
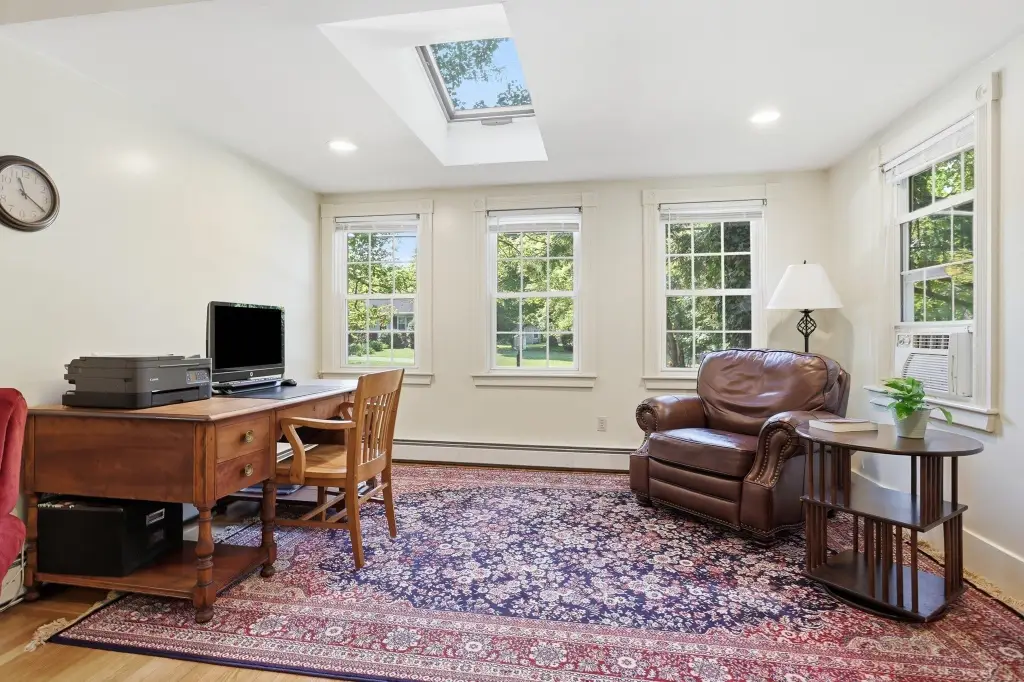
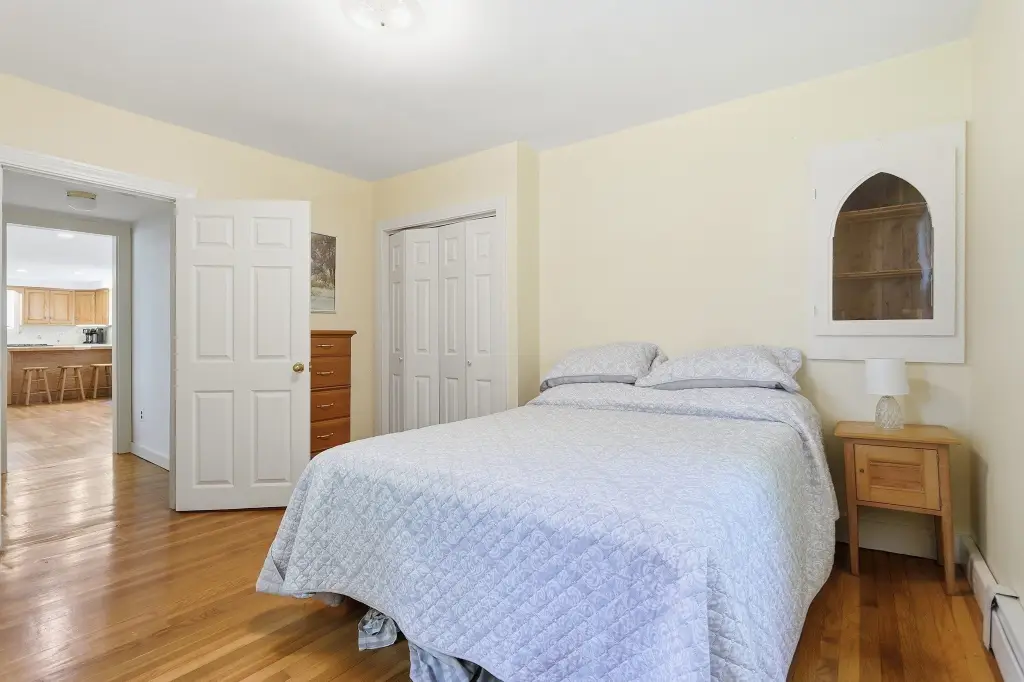
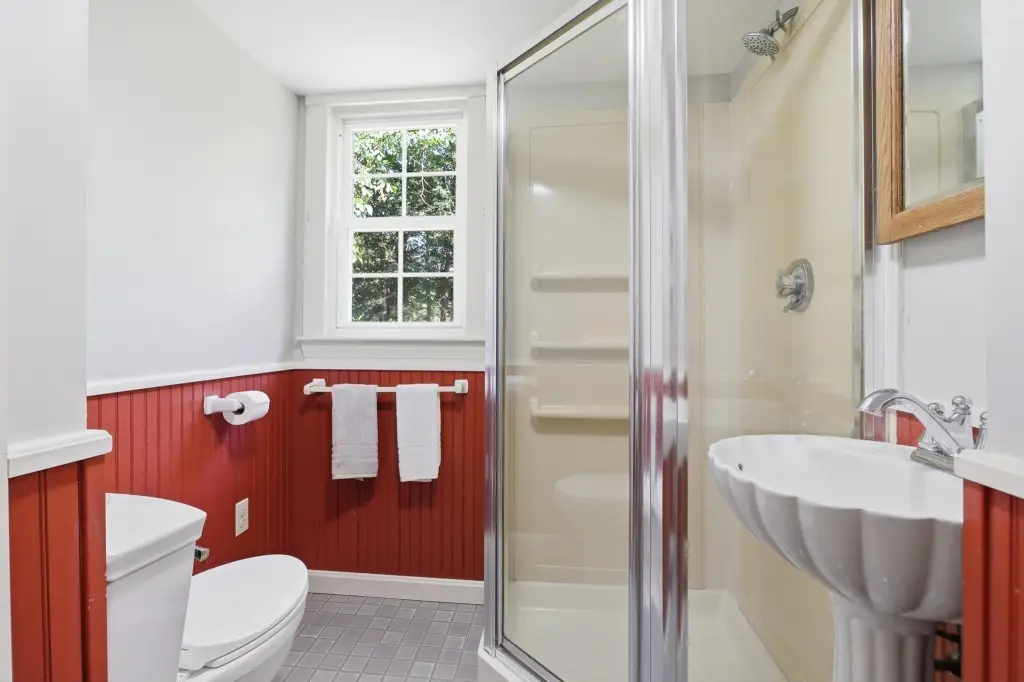
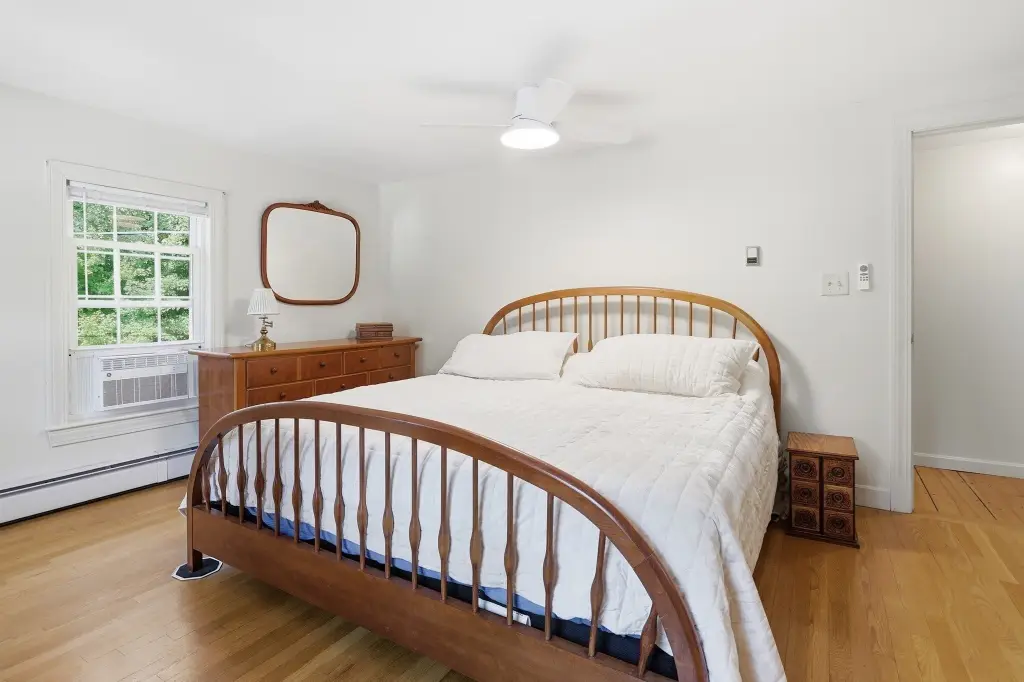
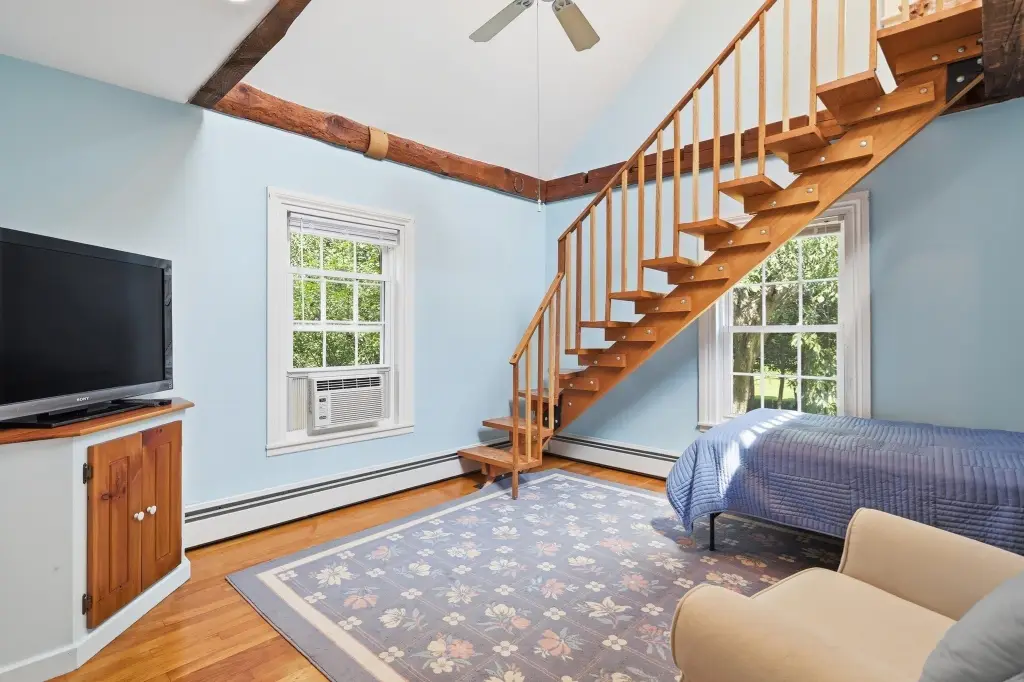
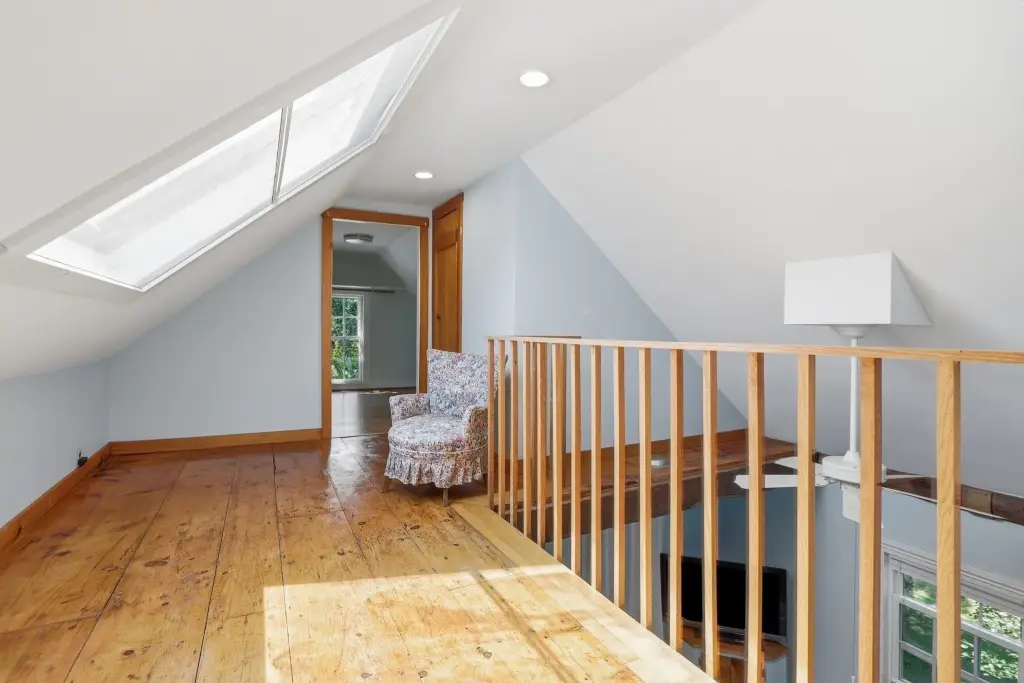
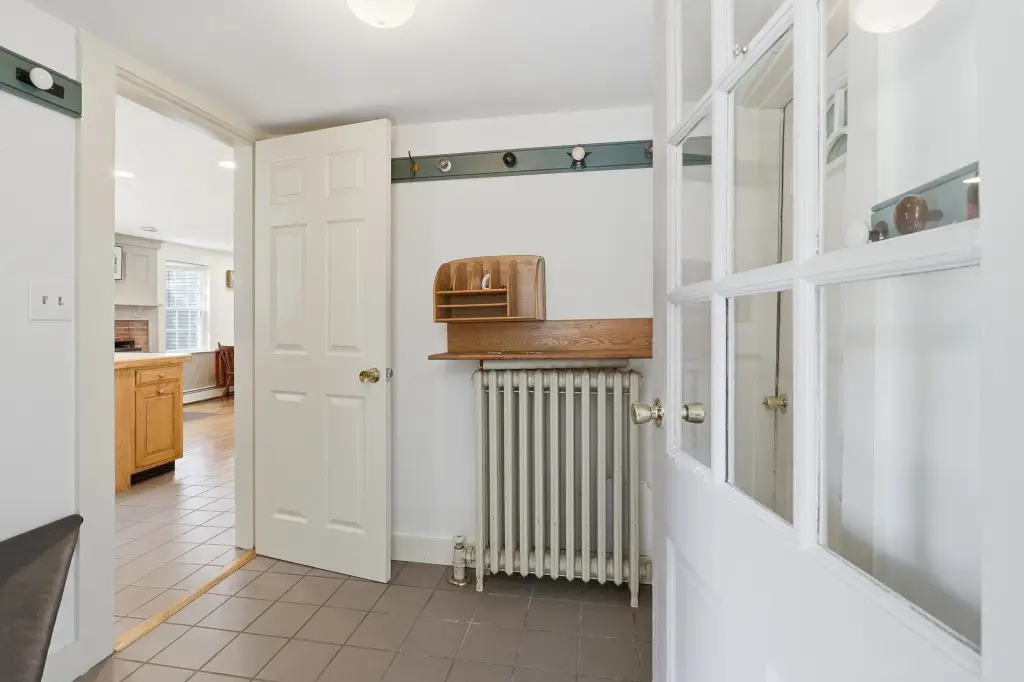
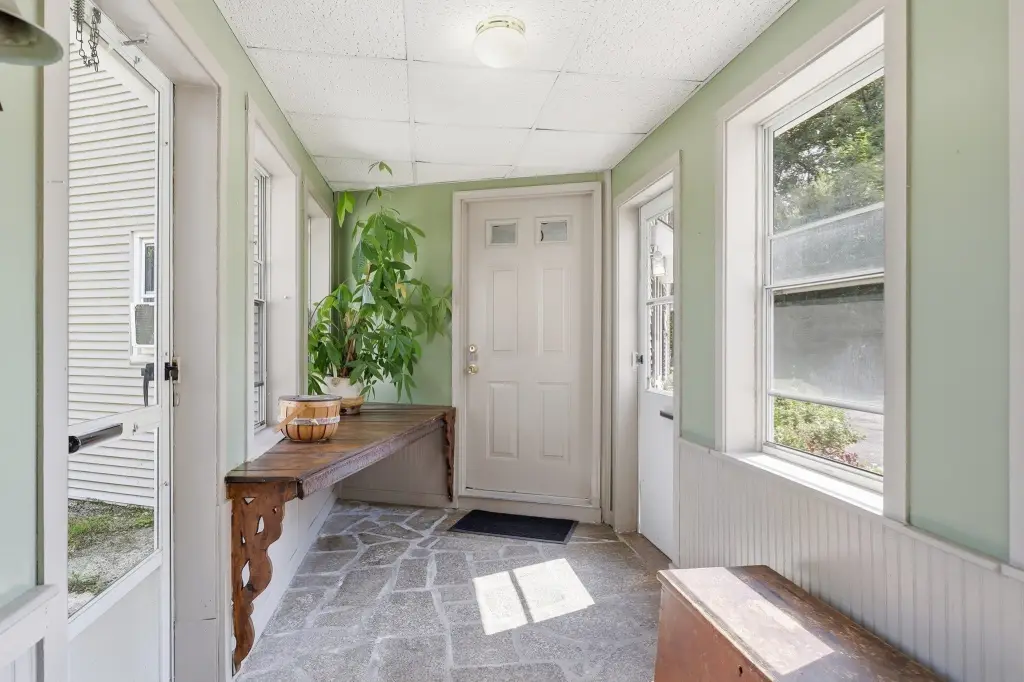
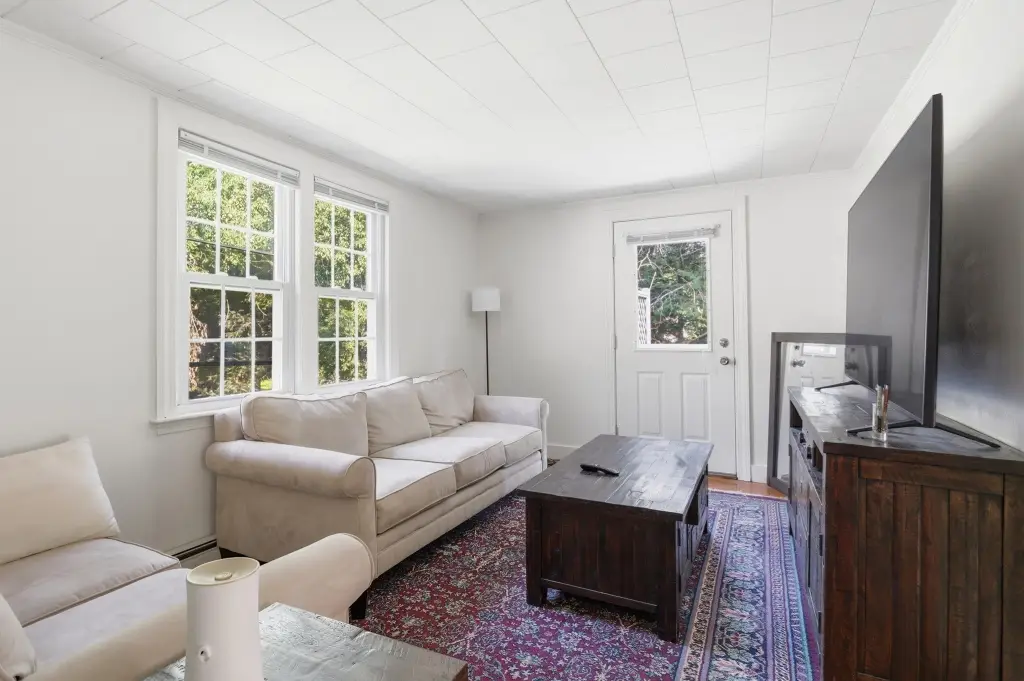
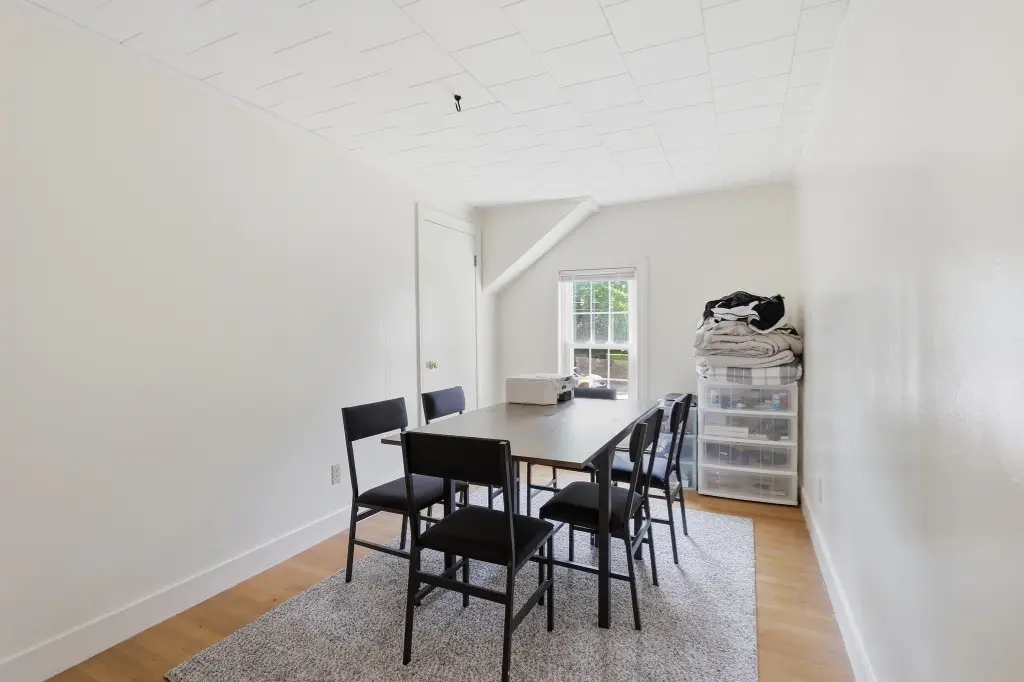
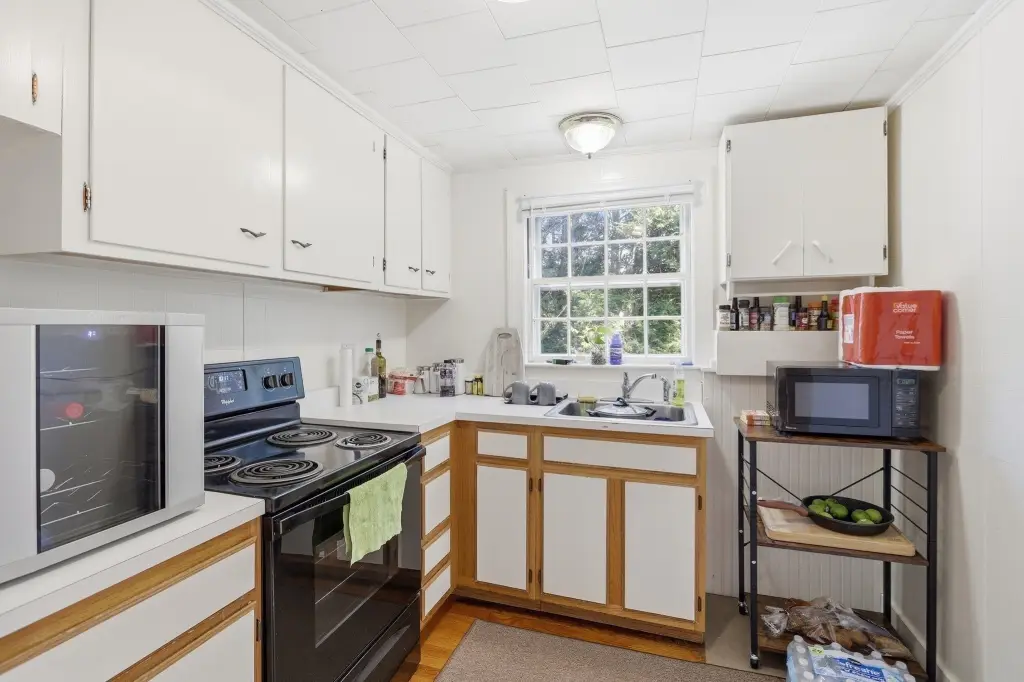
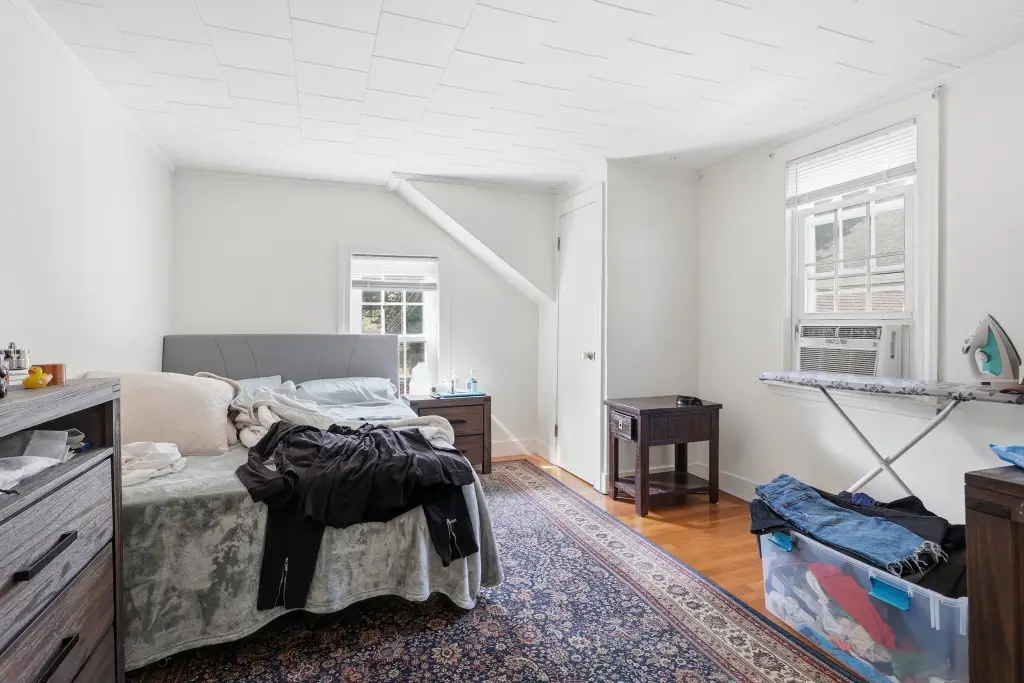
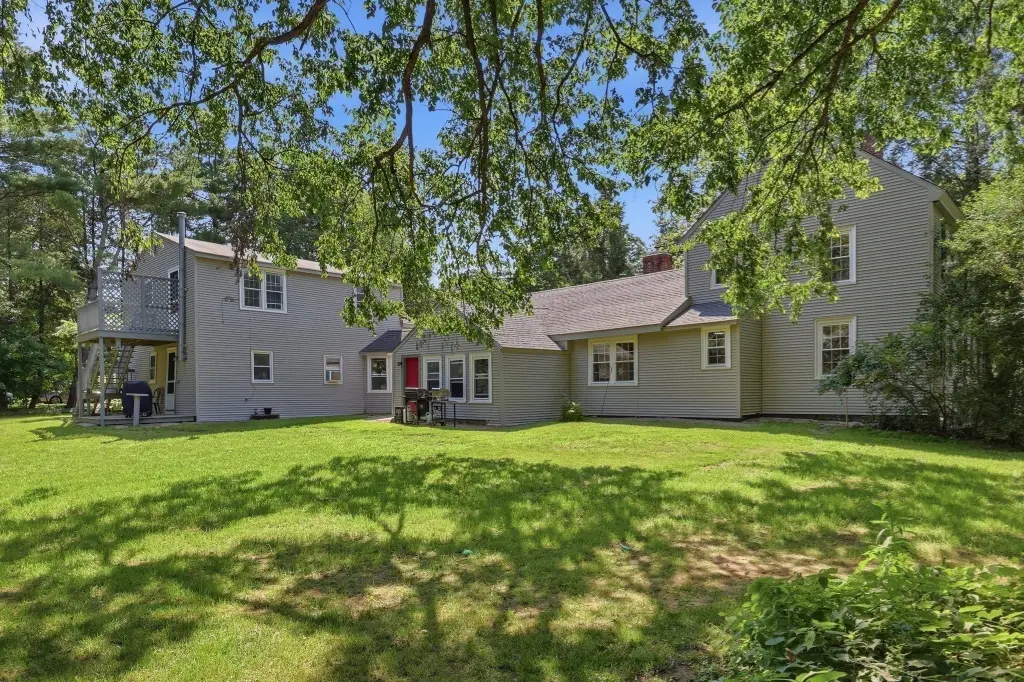
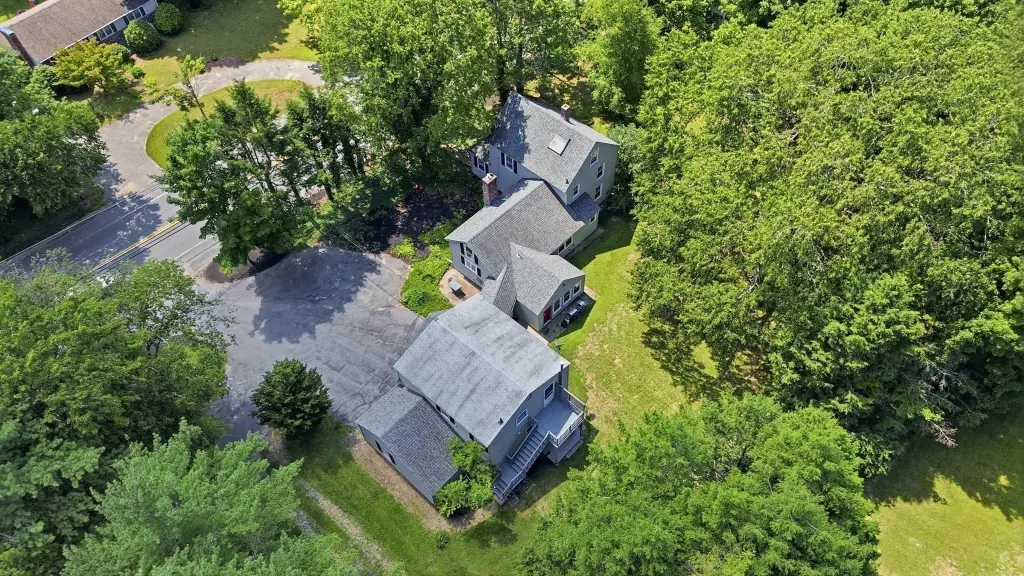
This 3,323-square-foot triplex includes a three-bedroom, two-bathroom main residence and two additional apartments. The primary home features an open kitchen with gas cooking, a large peninsula, walk-in pantry, mudroom, family room with pellet stove, and hardwood flooring in the living and dining areas. One upstairs bedroom connects to a walk-up loft and bonus room.
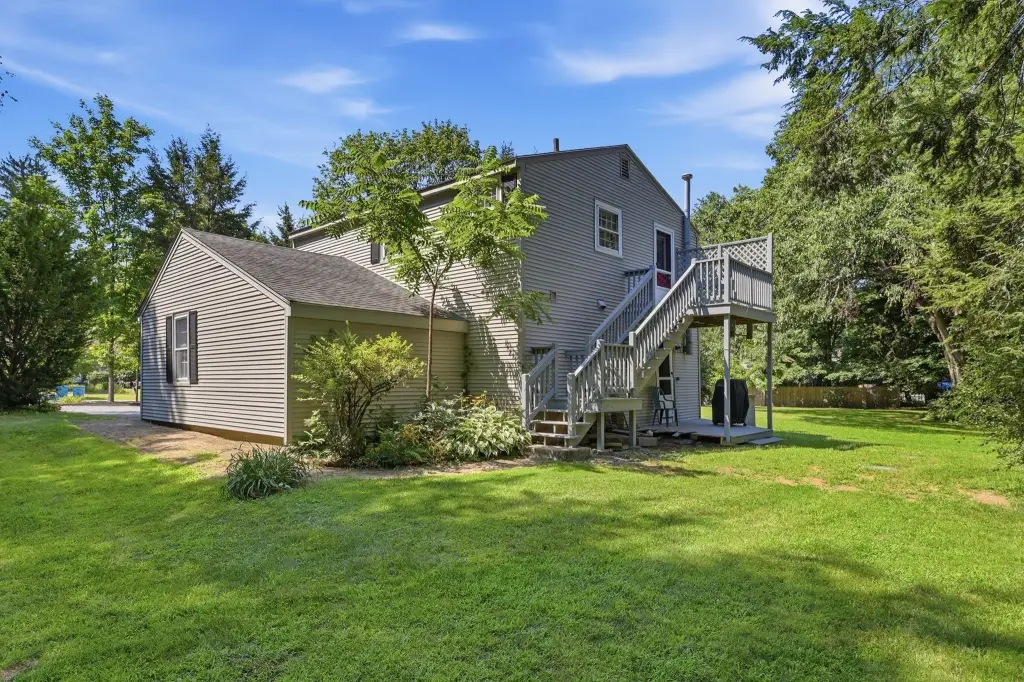
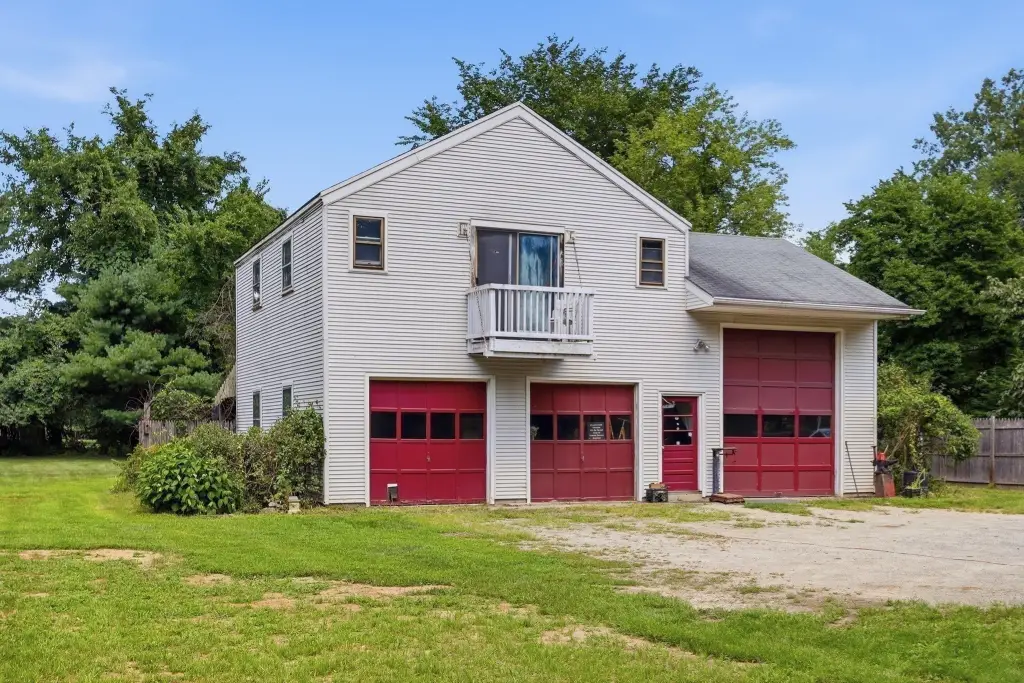
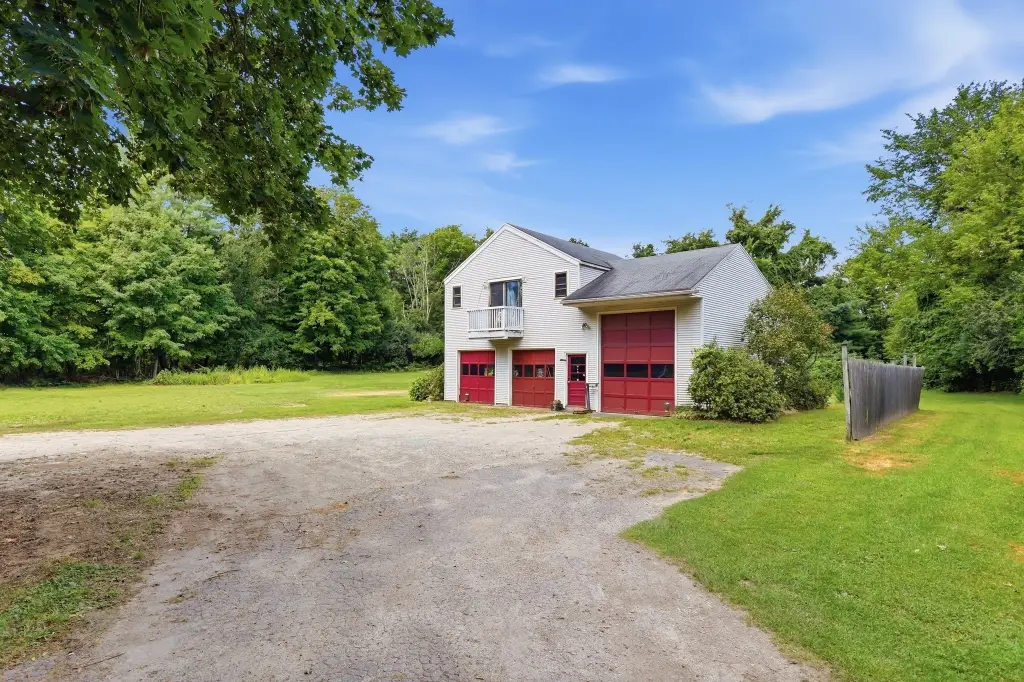
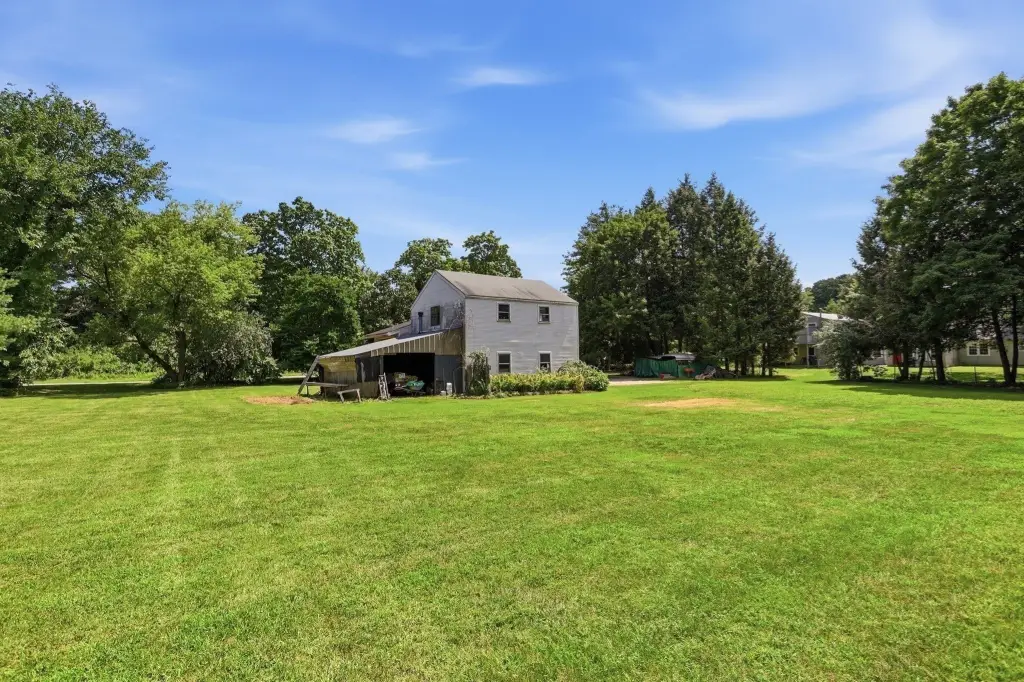
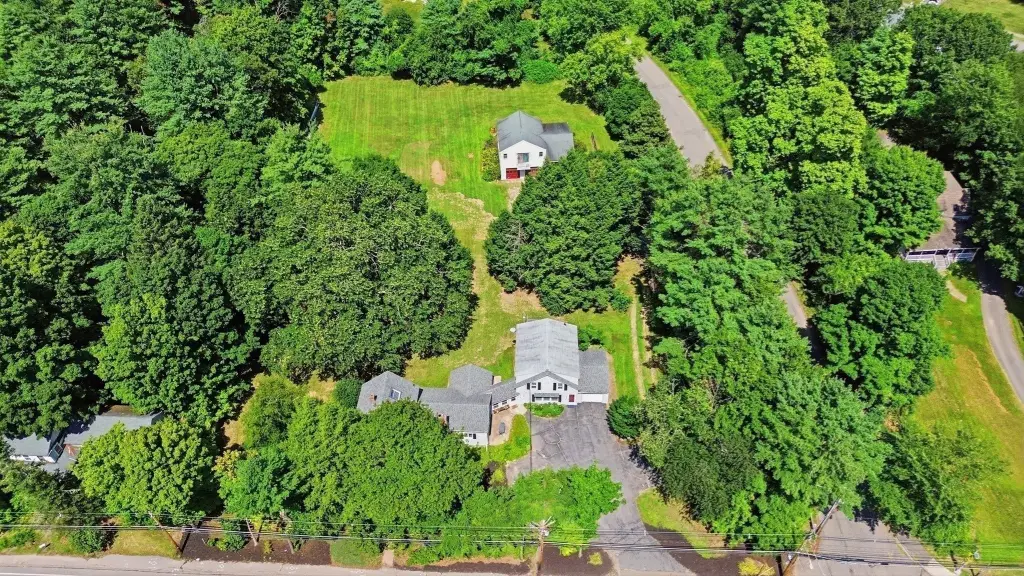
A detached, two-story garage provides three oversized bays with access from the neighboring side street, supporting workshop, equipment, storage, and hobby uses. The property occupies a 1.6-acre corner lot near the entrance to a cul-de-sac neighborhood, with a large yard and two new septic systems. Nearby amenities include Center School, Masters Academy, Lake Boon, golf courses, community recreation, conservation trails, Lower Village shopping, and commuter rail.
A detached, two-story garage provides three oversized bays with access from the neighboring side street, supporting workshop, equipment, storage, and hobby uses. The property occupies a 1.6-acre corner lot near the entrance to a cul-de-sac neighborhood, with a large yard and two new septic systems. Nearby amenities include Center School, Masters Academy, Lake Boon, golf courses, community recreation, conservation trails, Lower Village shopping, and commuter rail.
Key Highlights
- 3,323 SF triplex with three total living units
- Main residence includes 3 bedrooms and 2 bathrooms
- Detached two‑story garage with 3 oversized bays
Financial Insights
Estimated NOI and Cap Rate
NOI / Yr
$70,316
Cap Rate
8.28%
Suggested Prices Based on Cap Rates
Cap Rate 5%
$1,406,320
$1.4M
Cap Rate 7%
$1,004,514
$1.0M
Cap Rate 9%
$781,289
$781.3K
Market Conditions
NOI Build-Up for 3,323 SF
Gross rent
$105.7K $31.80/SF
− Vacancy
−$5.2K −$1.57/SF
EGI
$100.5K $30.23/SF
− OpEx
−$30.1K −$9.07/SF
NOI
$70.3K $21.16/SF
Area
Middlesex County, MA
Vacancy
4.94%
Lease Rate
$31.80 /SF/Yr
Expense Ratio
30.00%
Simulate Cap Rate and NOI
Suggested Prices Based on Cap Rates
Cap Rate 5%
$1,406,320
Cap Rate 7%
$1,004,514
Cap Rate 9%
$781,289
Alternative Uses
Best Use
Multifamily LT 5
$1.00M
$879.0K – $1.17M
NOI $70,316 @ 7.0% cap · market cap 8.28%
Second Best
Apartment 5plus
$944.5K
$826.5K – $1.10M
NOI $66,116 @ 7.0% cap · market cap 7.79%
Theoretical Best
Office A
$1.97M
$1.72M – $2.30M
NOI $137,704 @ 7.0% cap · market cap 16.22%
Zoning and permitted uses should be independently verified with authorities.
How Realmo checks its estimates
Property Analytics
Contact the owner directly
Get the owner's phone numbers and email
Open Analytics
Lease Details
3
Residential units
Yes
Paved road access
Location Intelligence
Trade Area within ½ mile
191
Businesses Nearby
Explore this area
Business Placement
Demographics for 01775, MA
7,190
Population
2,761
Households
2.6
Avg Household Size
46
Median Age
77%
College-Educated
99%
High-School Grad
17.3 sq mi
ZIP Area
416
Density / Sq Mi
$177,862
Median Household Income
$82,837
Median Earnings
$1,829
Median Rent
$657,900
Median Home Value
Check the figures for this property
Cap Rate, Value Estimation, Potential NOI and more
View Realmo Analytics
Market
Vacancy Rate% for Multifamily in Northeast region

Frequently Asked Questions
What type of property is this?
Triplex - Three living units offer flexible options for rental use, extended family, or adaptable household arrangements.
Where is this triplex located?
The property is located at 213 Great Road Stow, MA.
What is the asking price?
The asking price for this property is $849,000.
What are key features of this property?
This property features: 3,323 SF triplex with three total living units; Main residence includes 3 bedrooms and 2 bathrooms; Detached two‑story garage with 3 oversized bays


