Duplex with Private
For Sale
Contact for pricing
2125 Montclair Drive, Sarasota, FL 34231
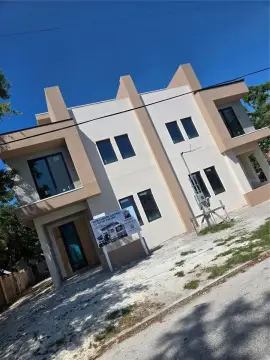
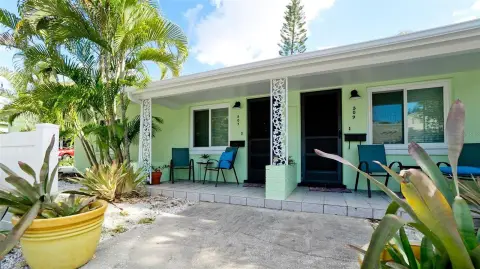
Two masonry, two-story 3BR/2.5BA units, each with screened patio, private yard, and separately metered utilities.
Property Size5,682 SF
Price / SF$156.55
Days on Market135
Property Features for 2125 Montclair Drive
General Information
Standard status
Active
Size
5,682 SF
Class
B
Total Parking Spaces
4
Property subtype
Multifamily
Investment Type
Value Add
Additional Details
Multifamily Units
2
Building Details
Year Built
2007
Buildings
1
Stories
2
Units
2
Tenancy
Multi
Listing Agency:
The Multifamily Firm
Listed By:
Phil Ginexi · License #FL SL3266689
(941) 444-6160
Source:
Crexi
Added: Jun 9
Changed: Oct 16
Last Checked: Oct 19 at 6:14AM
Displayed information is deemed reliable but is not guaranteed and should be independently verified. All listing content including descriptions, pricing, images are the copyrighted material of The Multifamily Firm

Ask AI about this property
Review the available facts, identify missing information and prepare questions for the agent.
Investment Insights
Based on property information with market context.
Montclair Villas is a 2007 masonry duplex featuring two spacious, two-story residences, each offering three bedrooms and two and a half bathrooms. Each unit includes an open living area with tile flooring, sliding glass doors, recessed lighting, and decorative tray ceilings with crown molding. Outdoor space is a major highlight, with a private swimming pool, a screened patio, and a private yard. Both residences also have a two-car garage.
Operationally, the property is set up for efficiency, with all utilities separately metered and paid directly by tenants. In addition, each unit and the common area have separate parcel IDs, which may support future flexibility for an individual condo sell-off strategy.
Located at 2125 Montclair Drive in the Coquina Island area, the property is described as being just minutes from Siesta Key, making it well-suited for buyers evaluating both long-term residency and potential vacation rental use.
Operationally, the property is set up for efficiency, with all utilities separately metered and paid directly by tenants. In addition, each unit and the common area have separate parcel IDs, which may support future flexibility for an individual condo sell-off strategy.
Located at 2125 Montclair Drive in the Coquina Island area, the property is described as being just minutes from Siesta Key, making it well-suited for buyers evaluating both long-term residency and potential vacation rental use.
Key Highlights
- 2007 masonry duplex in the Coquina Island area, just minutes from Siesta Key
- Two two‑story units, each with 3 bedrooms and 2.5 bathrooms
- Each residence features tile flooring, sliding glass doors, recessed lighting, and tray ceilings with crown molding
Financial Insights
Estimated NOI and Cap Rate
NOI / Yr
$58,068
Cap Rate
6.53%
Suggested Prices Based on Cap Rates
Cap Rate 5%
$1,161,360
$1.2M
Cap Rate 7%
$829,543
$829.5K
Cap Rate 9%
$645,200
$645.2K
Market Conditions
NOI Build-Up for 5,682 SF
Gross rent
$92.0K $16.20/SF
− Vacancy
−$9.1K −$1.60/SF
EGI
$83.0K $14.60/SF
− OpEx
−$24.9K −$4.38/SF
NOI
$58.1K $10.22/SF
Area
Sarasota County, FL
Vacancy
9.88%
Lease Rate
$16.20 /SF/Yr
Expense Ratio
30.00%
Simulate Cap Rate and NOI
Suggested Prices Based on Cap Rates
Cap Rate 5%
$1,161,360
Cap Rate 7%
$829,543
Cap Rate 9%
$645,200
Alternative Uses
Best Use
Multifamily LT 5
$829.5K
$725.9K – $967.8K
NOI $58,068 @ 7.0% cap · market cap 6.53%
Second Best
Apartment 5plus
$739.2K
$646.8K – $862.4K
NOI $51,746 @ 7.0% cap · market cap 5.82%
Theoretical Best
Office A
$1.61M
$1.41M – $1.88M
NOI $113,041 @ 7.0% cap · market cap 12.71%
Zoning and permitted uses should be independently verified with authorities.
How Realmo checks its estimates
Property Analytics
Unlock full access to Insights
Subscribe to Realmo Intelligence
Open Analytics
Lease Details
2
Residential units
Location Intelligence
Trade Area within ½ mile
520
Businesses Nearby
Explore this area
Business Placement
Demographics for 34231, FL
31,492
Population
19,017
Households
1.7
Avg Household Size
55
Median Age
38%
College-Educated
95%
High-School Grad
9.4 sq mi
ZIP Area
3,350
Density / Sq Mi
$69,721
Median Household Income
$40,608
Median Earnings
$1,707
Median Rent
$363,400
Median Home Value
Check the figures for this property
Cap Rate, Value Estimation, Potential NOI and more
View Realmo Analytics
Market
Vacancy Rate% for Multifamily in South region





Frequently Asked Questions
What type of property is this?
Duplex - Two masonry, two-story 3BR/2.5BA units, each with screened patio, private yard, and separately metered utilities.
Where is this duplex located?
The property is located at 2125 Montclair Drive Sarasota, FL.
What is the asking price?
The asking price for this property is $889,500.
What are key features of this property?
This property features: 2007 masonry duplex in the Coquina Island area, just minutes from Siesta Key; Two two‑story units, each with 3 bedrooms and 2.5 bathrooms; Each residence features tile flooring, sliding glass doors, recessed lighting, and tray ceilings with crown molding


