Freestanding Salon
For Sale
$70,000
211 S 10th St, Temple, TX 76501
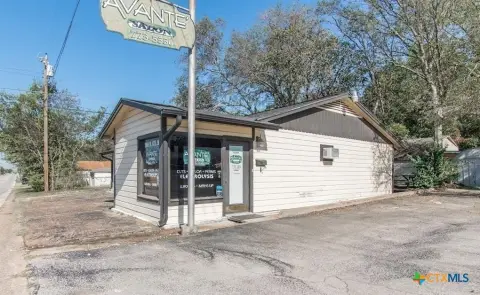
Built in 1980, the property includes a small parking area and City of Temple water, trash, and sewer service.
Property Size240 SF
Price / SF$291.67
Days on Market105
Property Features for 211 S 10th St
General Information
Standard status
Active
Size
240 SF
Building Details
Year Built
1980
Listing Agency:
Jirasek Realty
Listed By:
Jeremy Jirasek, David Jirasek · License #0594801
(254) 541-8895
Source:
Ashbyregroup
Added: Jul 13
Changed: Oct 10
Last Checked: Oct 7 at 1:57PM
Displayed information is deemed reliable but is not guaranteed and should be independently verified. All listing content including descriptions, pricing, images are the copyrighted material of Jirasek Realty

Ask AI about this property
Review the available facts, identify missing information and prepare questions for the agent.
Investment Insights
Based on property information with market context.
This freestanding salon property contains approximately 240 square feet and was built in 1980. The site measures approximately 60 feet by 110 feet and includes a small parking area. City of Temple water, trash, and sewer services are available, along with Oncor electric service.
Located at 211 S 10th Street in East Temple, the property sits within the African-American Churches Historic Neighborhood District, southeast of Downtown Temple. It carries SF-3-PD zoning with a current non-conforming status, while the designated future land use is Downtown Transition.
Located at 211 S 10th Street in East Temple, the property sits within the African-American Churches Historic Neighborhood District, southeast of Downtown Temple. It carries SF-3-PD zoning with a current non-conforming status, while the designated future land use is Downtown Transition.
Key Highlights
- Approximately 240 Sq.Ft. freestanding salon built in 1980
- Approximately 60’ x 110’ site
- Small on‑site parking area
Financial Insights
Estimated NOI and Cap Rate
NOI / Yr
$3,251
Cap Rate
4.64%
Suggested Prices Based on Cap Rates
Cap Rate 5%
$65,020
$65.0K
Cap Rate 7%
$46,443
$46.4K
Cap Rate 9%
$36,122
$36.1K
Market Conditions
NOI Build-Up for 240 SF
Gross rent
$4.9K $20.52/SF
− Vacancy
−$281 −$1.17/SF
EGI
$4.6K $19.35/SF
− OpEx
−$1.4K −$5.81/SF
NOI
$3.3K $13.55/SF
Area
Bell County, TX
Vacancy
5.70%
Lease Rate
$20.52 /SF/Yr
Expense Ratio
30.00%
Simulate Cap Rate and NOI
Suggested Prices Based on Cap Rates
Cap Rate 5%
$65,020
Cap Rate 7%
$46,443
Cap Rate 9%
$36,122
Alternative Uses
Best Use
Retail
$46.4K
$40.6K – $54.2K
NOI $3,251 @ 7.0% cap · market cap 4.64%
Second Best
—
—
no second resolved use
Theoretical Best
Multifamily LT 5
$2.68M
$2.34M – $3.13M
NOI $187,548 @ 7.0% cap · market cap 267.93%
Zoning and permitted uses should be independently verified with authorities.
How Realmo checks its estimates
Property Analytics
Contact the owner directly
Get the owner's phone numbers and email
Open Analytics
Current Use
Location Intelligence
Trade Area within ½ mile
1,038
Businesses Nearby
Under-served
Demand for This Use
Explore this area
Business Placement
Demographics for 76501, TX
16,987
Population
7,298
Households
2.3
Avg Household Size
39
Median Age
20%
College-Educated
86%
High-School Grad
118.2 sq mi
ZIP Area
144
Density / Sq Mi
$50,764
Median Household Income
$35,856
Median Earnings
$879
Median Rent
$151,000
Median Home Value
Check the figures for this property
Cap Rate, Value Estimation, Potential NOI and more
View Realmo Analytics
Market
Vacancy Rate% for Retail in South region




Similar Off Market Nearby
- Nurseria tres palmas — 18 E Avenue I, Temple, TX 76504
- Avas Floral Arrangements — Temple, TX 76501
Frequently Asked Questions
What type of property is this?
Storefront property - Built in 1980, the property includes a small parking area and City of Temple water, trash, and sewer service.
Where is this storefront property located?
The property is located at 211 S 10th St Temple, TX.
What is the asking price?
The asking price for this property is $70,000.
What are key features of this property?
This property features: Approximately 240 Sq.Ft. freestanding salon built in 1980; Approximately 60’ x 110’ site; Small on‑site parking area