Historic Quadplex with Covered
For Sale
$850,000
211 E Park St, Lakeland, FL 33803
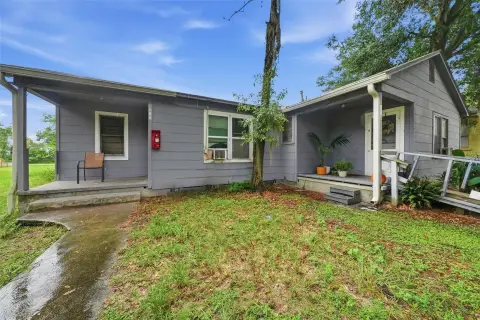
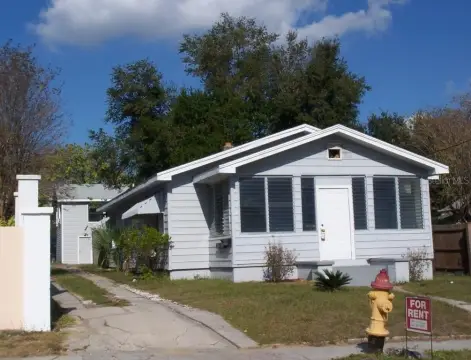
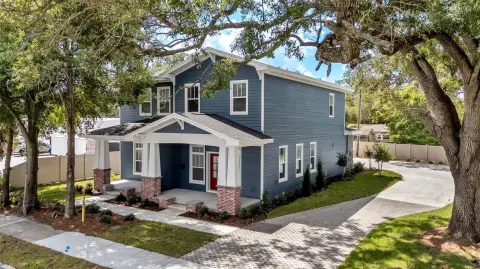
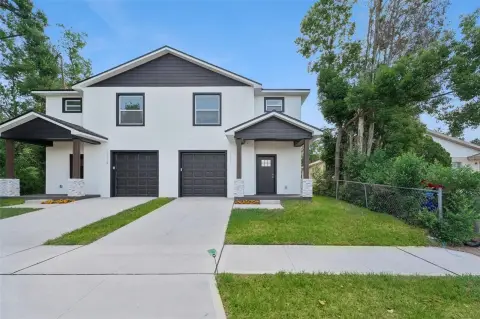
Fully rented residential property with updated kitchens, separately metered utilities, private decks, and individual HVAC systems.
Property Size3,640 SF
Price / SF$233.52
Days on Market87
Property Features for 211 E Park St
General Information
Standard status
Active
Size
3,640 SF
Property subtype
Residential Income
Occupancy
100%
Units
Unit Mix
4 x 2BR/1BA
Multifamily Units
4
Additional Details
Utilities to Site
Yes
Taxes and HOA fees
Annual Taxes
$11,040
Amenities
washer/dryer hookups
covered parking
private decks
Building Details
Buildings
1
Listing Agency:
EXP REALTY LLC
(888) 883-8509
Listed By:
Luis Perez Garcia · License #3619398
(864) 309-3088
Source:
Exprealty
Added: Jul 22
Changed: Oct 7
Last Checked: Oct 16 at 10:25AM
Displayed information is deemed reliable but is not guaranteed and should be independently verified. All listing content including descriptions, pricing, images are the copyrighted material of EXP REALTY LLC

Ask AI about this property
Review the available facts, identify missing information and prepare questions for the agent.
Investment Insights
Based on property information with market context.
This 3,640-square-foot historic quadplex contains four two-bedroom, one-bath units, each with its own deck, covered carport space, and exterior washer and dryer hookups. Renovations include updated kitchens with contemporary appliances, individual refrigerators and ranges, newer carpeting, fresh interior paint, separate water heaters, and individual air conditioning systems. Original architectural elements—including wall casing, crown molding, built-ins, and other period details—remain in place. All utilities are separately metered, and the property is fully rented.
A new roof was installed in March 2026. The property is located at 211 E Park St in Lakeland’s South Lake Morton Historic District, near Lake Hollingsworth and local destinations including Cob & Pen, Concord Coffee, The Peach House, and Patio 850.
A new roof was installed in March 2026. The property is located at 211 E Park St in Lakeland’s South Lake Morton Historic District, near Lake Hollingsworth and local destinations including Cob & Pen, Concord Coffee, The Peach House, and Patio 850.
Key Highlights
- Four two‑bedroom, one‑bath units in a 3,640‑square‑foot quadplex
- New roof installed in March 2026
- Fully rented with all utilities separately metered
Financial Insights
Estimated NOI and Cap Rate
NOI / Yr
$38,595
Cap Rate
4.54%
Suggested Prices Based on Cap Rates
Cap Rate 5%
$771,900
$771.9K
Cap Rate 7%
$551,357
$551.4K
Cap Rate 9%
$428,833
$428.8K
Market Conditions
NOI Build-Up for 3,640 SF
Gross rent
$59.0K $16.20/SF
− Vacancy
−$3.8K −$1.05/SF
EGI
$55.1K $15.15/SF
− OpEx
−$16.5K −$4.54/SF
NOI
$38.6K $10.60/SF
Area
Lakeland, FL
Vacancy
6.50%
Lease Rate
$16.20 /SF/Yr
Expense Ratio
30.00%
Simulate Cap Rate and NOI
Suggested Prices Based on Cap Rates
Cap Rate 5%
$771,900
Cap Rate 7%
$551,357
Cap Rate 9%
$428,833
Alternative Uses
Best Use
Multifamily LT 5
$551.4K
$482.4K – $643.3K
NOI $38,595 @ 7.0% cap · market cap 4.54%
Second Best
Apartment 5plus
$492.5K
$431.0K – $574.6K
NOI $34,478 @ 7.0% cap · market cap 4.06%
Theoretical Best
Office A
$874.7K
$765.4K – $1.02M
NOI $61,231 @ 7.0% cap · market cap 7.20%
Zoning and permitted uses should be independently verified with authorities.
How Realmo checks its estimates
Property Analytics
Unlock full access to Insights
Subscribe to Realmo Intelligence
Open Analytics
Current Use
Lease Details
4
Residential units
100%
Occupancy
Yes
Utilities to site
Location Intelligence
Trade Area within ½ mile
949
Businesses Nearby
Explore this area
Business Placement
Demographics for 33803, FL
29,082
Population
15,086
Households
1.9
Avg Household Size
42
Median Age
34%
College-Educated
94%
High-School Grad
16.6 sq mi
ZIP Area
1,752
Density / Sq Mi
$63,180
Median Household Income
$40,358
Median Earnings
$1,337
Median Rent
$236,200
Median Home Value
Check the figures for this property
Cap Rate, Value Estimation, Potential NOI and more
View Realmo Analytics
Market
Vacancy Rate% for Multifamily in South region





Frequently Asked Questions
What type of property is this?
Quadplex - Fully rented residential property with updated kitchens, separately metered utilities, private decks, and individual HVAC systems.
Where is this quadplex located?
The property is located at 211 E Park St Lakeland, FL.
What is the asking price?
The asking price for this property is $850,000.
What are key features of this property?
This property features: Four two‑bedroom, one‑bath units in a 3,640‑square‑foot quadplex; New roof installed in March 2026; Fully rented with all utilities separately metered


